Download presentation
Presentation is loading. Please wait.

1
State of In-House Physician Recruitment Fall 2014

2
Industry Reports Overview Recruitment Processes Report Recruitment Benchmarking Report Physician Compensation, Benefits and Recruitment Incentives Report (Physicians) Physician Recruitment Incentives and Contracts Report (In-House Recruiters)
 Physician Recruitment Incentives and Contracts Report (In-House Recruiters)")
3
2014 ASPR In-House Physician Recruitment Processes Report Overview

4
2014 ASPR In-House Physician Recruitment Processes Report 240 in-house physician recruitment professionals participated Participant Employment Type: –72.5% worked for an Integrated Delivery System –15.4% worked for a Physician Owned Practice –5% worked for a Contracted Physician Management Company (hospitalist, EM, etc.) –3.8% worked for a University or Medical School
 –3.8% worked for a University or Medical School")
5
2014 ASPR In-House Physician Recruitment Processes Report

6
Reporting Structure: –27% report to Chief Human Resources Officer or VP of HR –22% report to Chief Executive Officer –20% report to Chief Medical Officer or VP Medical Affairs –10% report to VP of Development –7% report to Chief Operating Officer –1% report to VP of Marketing –14% report to “Other” positions Chief/VP RecruitmentOther Dept.

7
2014 ASPR In-House Physician Recruitment Processes Report Title: –31% Director –24% Recruiter –23% Senior Recruiter –18% Manager – 3% Vice President – 1% Coordinator/Assistant –.5% Onboarding Specialist Experience in Physician Recruitment:

8
2014 ASPR In-House Physician Recruitment Processes Report Number of Provider Searches Conducted Annually: –60% conduct ≤ 15 searches –30% conduct 16-30 –11% conduct 30+ Coincides with 2014 Benchmarking Report: –Median of 15 searches per recruiter Anticipated Volume Change in upcoming 12 months: –48% expect an increase –38% expect no change – 7% expect a decrease – 7% are not sure

9
2014 ASPR In-House Physician Recruitment Processes Report Split of Physician vs. APP searches: –Most recruiters searches are split with 75% physicians and 25% APPs 35% searched exclusively for physicians 3% searched exclusively for APPs

10
2014 ASPR In-House Physician Recruitment Processes Report What? You’re Busy? Doing What? On Top of Recruiting Responsibilities: –64% have Onboarding Responsibilities –51% have Provider Retention Responsibilities –27% have Physician Practice Acquisition Responsibilities –44% have Supervisory Responsibilities –60% participate in Senior Management and/or Strategic Planning meetings

11
2014 ASPR In-House Physician Recruitment Processes Report CV Screening Processes - Reasons for disqualification for further screening: –82% lack of Board Certification –71% too many job changes –67% time gaps –51% spelling errors –30% residency changes or gap in training –18% poor CV formatting

12
2014 ASPR In-House Physician Recruitment Processes Report Phone Screening Processes - Reasons for disqualification for further screening: –92% unsatisfactory responses to “red flag” items –90% license sanction –85% poor communication skills –69% poor interpersonal skills –42% poor follow up

13
2014 ASPR In-House Physician Recruitment Processes Report Who Needs to Speak to the Candidate Before Inviting to an Interview? –72% require only the physician recruiter –61% require a physician leader –18% require an administrative leader –8% require a practice administrator 57% use Behavioral Interviewing on the phone or in person

14
2014 ASPR In-House Physician Recruitment Processes Report When Do You Conduct Reference Checks? –60% after interview –30% after phone screening –7% after letter of intent –2% after contract is signed –1% after contract is sent When Do You Conduct Formal Background Checks? –36% after the contract is signed –22% after the letter of intent –16% after the interview –15% after the phone screening –11% after the contract is sent

15
2014 ASPR In-House Physician Recruitment Processes Report Do You Include a Community Tour on First Site Visit? –68% usually do –20% sometimes do – 8% rarely do – 4% never do Who Conducts the Community Tour? –79% Realtor –11% Physician Recruiter – 6% Relocation Company – 3% Administrative Leader – 1% Physician Leader

16
2014 ASPR In-House Physician Recruitment Processes Report Contract Process: –80% utilize a written contract –54% utilize a letter of intent –51% utilize a verbal offer –46% utilize a sample contract Time Lapse Between Interview and Offer* –61% send some sort of offer between 3 and 10 business days * Verbal offer, letter of intent, or contract

17
2014 ASPR In-House Physician Recruitment Processes Report 72% of Recruitment Departments Track Key Dates (date search opened, candidate presented, interviews, contracts offered/signed, etc.) 55% of Recruitment Departments have Applicant Tracking Systems 64% of Recruitment Departments Report to Administration either Weekly (24%) or Monthly (40%) –14% report quarterly –10% report annually –12% NEVER report
 55% of Recruitment Departments have Applicant Tracking Systems 64% of Recruitment Departments Report to Administration either Weekly (24%) or Monthly (40%) –14% report quarterly –10% report annually –12% NEVER report")
18
Overview of the 2014 ASPR In-House Physician Recruitment Benchmarking Report

19
145 organizations participated (data for 427 in-house physician recruiters and 4,987 active searches) 69% of searches were for Hospital/Integrated Delivery Systems ASPR In-House Physician Recruitment Benchmarking Survey
 69% of searches were for Hospital/Integrated Delivery Systems ASPR In-House Physician Recruitment Benchmarking Survey")
20
Median number of employed physician recruiters: 2 (average of 3.1) – up from median of 1 in 2013 Report Organization is more likely to have more than 2 recruiters if: –Located in the Midwest –Located in population size of 500,000 or more –Conducts more than 50 searches per year Median number of active searches per recruiter: 15 –Organizations with 1 recruiter median 12 searches –Organizations with 4+ recruiters median 23 searches 2014 Benchmarking Report Highlights
 – up from median of 1 in 2013 Report Organization is more likely to have more than 2 recruiters if: –Located in the Midwest –Located in population size of 500,000 or more –Conducts more than 50 searches per year Median number of active searches per recruiter: 15 –Organizations with 1 recruiter median 12 searches –Organizations with 4+ recruiters median 23 searches 2014 Benchmarking Report Highlights")
21
Top Physician Searches: Family Medicine, Pediatrics, Hospital Medicine, Internal Medicine, and Emergency Medicine Advanced Practice Provider searches accounted for 17% of all searches – most for primary care 38% of searches remained open at year end (up from 33%) More positions remained unfilled in organizations located in smaller populations 46.6% unfilled in populations of 10,000 or less 39.9% unfilled in populations of 500,000 + Specialties least likely filled: Dermatology, Orthopedic Subspecialties, Endocrinology, Rheumatology, and Podiatry
 More positions remained unfilled in organizations located in smaller populations 46.6% unfilled in populations of 10,000 or less 39.9% unfilled in populations of 500,000 + Specialties least likely filled: Dermatology, Orthopedic Subspecialties, Endocrinology, Rheumatology, and Podiatry")
22
Physician Recruiter Compensation: Median total compensation was ~$71,000 52% of in-house physician recruiters receive a bonus Varies by title, experience, education, and Fellowship Certification status 2014 Benchmarking Report Highlights

23
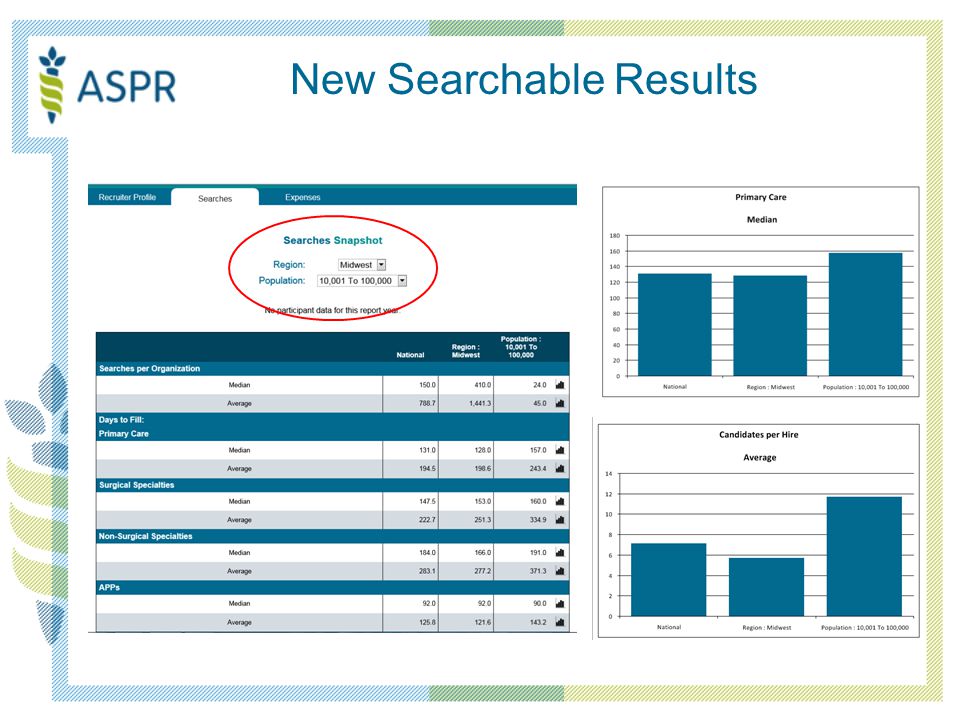
New Searchable Results

25
Physician Compensation & Benefits – Comparison of Survey Data 2014 ASPR Physician Comp & Benefits Report 2014 ASPR Physician Comp & Benefits Report 314 physicians surveyed –100 each: primary care, surgical, and specialty 50% Physician owned practice 29% Hospital/Integrated Delivery System Even distribution across geographic and population size 208 In-house physician recruiters surveyed 11% Physician owned practice 77% Hospital/Integrated Delivery System Even distribution across geographic and population size Conducted in partnership with:

26
Most Common Compensation Structures: Physician Compensation & Benefits – Comparison of Survey Data Physicians Report: 25% paid for call Physicians Report: 59% salary 13% RVU 16% % of revenue Recruiters Report: 50% salary 44% RVU Pay for Call (ED or Group): Recruiters Report: 32% paid for call
: Recruiters Report: 32% paid for call")
27
Physicians Report: 57% have APP supervisory responsibilities 43% are not compensated 8% are compensated Half receive $2,000 or more annually Half receive less than $2,000 annually Physician Compensation & Benefits – Comparison of Survey Data Advanced Practice Provider (APP) Supervision: Recruiters Report: 88% have APP supervisory responsibilities 28% do not pay physicians to supervise APP’s
 Supervision: Recruiters Report: 88% have APP supervisory responsibilities 28% do not pay physicians to supervise APP’s")
28
Physicians Report: 66% are eligible for a bonus Physician Compensation & Benefits – Comparison of Survey Data Eligible for Bonus: Bonus Structure Tied To: Recruiters Report: 53% offer a bonus 39% responded “unknown” Bonus Tied To:Recruiters Report: Physicians Report: Productivity73%77% Quality Measures65%38% Patient Satisfaction55%27% Medical Records29%18% Citizenship/Behavior34%14%

29
Physicians Report: 44% No Time 36% 1 Week Varies by employer type Physician Compensation & Benefits – Comparison of Survey Data Recruiters Report: 12% No Time 54% 1 Week Benefits – Most Common Amount of CME Paid Time Off: Physicians Report: 32% receive $0 43% up to $3K 19% between $3K and $5K Recruiters Report: 2% receive $0 26% up to $3K 62% between $3K and $5K Benefits – Most Common Amount of CME Funding:

30
Benefits – Top Three Professional Fees Paid For: Physician Compensation & Benefits – Comparison of Survey Data Physicians Report: 64% DEA 63% Medical License 50% Boards Recruiters Report: 84% Medical License 82% DEA 69% Boards

31
Physician Compensation & Benefits – Comparison of Survey Data Benefits – Annual Time Off: Similar Data for both Surveys Vacation/Paid Time Off Most provide/receive 2-4 weeks Holidays Recruiters: Most provide 5-6 days Physicians : Most receive 4 days or less Sick Time Most provide/receive 0 days

32
Satisfaction with Compensation Plan: Most physicians are “Somewhat Satisfied” Primary care less likely to indicate “Very Satisfied” 25% vs. 30% Specialty and 32% Surgical Surgical more likely to indicate “Very Dissatisfied” 11% vs. 9% Primary Care and 3% Specialty Physician Compensation & Benefits – Comparison of Survey Data

33
Recruitment Incentives – Signing Bonus: Physician Compensation & Benefits – Comparison of Survey Data Signing BonusRecruiters Report: Physicians Report: % Offered/Received89%25% Up to $10K15%5% $10-20K34%9% $20-30K34%5% $30K+11%6%

34
Recruitment Incentives: Physician Compensation & Benefits – Comparison of Survey Data Physicians Report: Stipends in final year 7% received Malpractice insurance 73 % received Amounts varied by employer type Recruiters Report: Stipends in final year 41% offered Malpractice insurance 93% offered Most recruiters were not aware of the amount provided

35
Recruitment Incentives – Relocation: Physician Compensation & Benefits – Comparison of Survey Data RelocationRecruiters Report: Physicians Report: % Offered/Received97% offered37% received Up to $10K30%27% $10-15K52%5% $15-20K10%1% $20K+4% Taxes paid by:59% physician 20% employer 71% physician 29% employer

36
Recruitment Incentives – Student Loan Repayment: Physician Compensation & Benefits – Comparison of Survey Data RelocationRecruiters Report: Physicians Report: % Offered/Received45% Offered10% received Up to $25K15%2% $25-50K26%2% $50-75K23%2% $75-100K10%1% $100K+15%3% Paid directly to:65% to physician 28% to lender 63% to physician 37% to lender Commitment Timeframe: 62% 2-3 yrs 27% 3-4 yrs 51% no commitment 29% 2-3 yrs

37
Physician Compensation & Benefits 11% of physician’s time spent on administrative work 64% of physicians report no time allotted in their schedule

39
So - What Now? Download Reports from the ASPR website New “Industry Data” section Several Reports are free Benchmarking free to participants/$350 otherwise Additional Industry Surveys and Reports Underway What Can You Do? Participate in the surveys! Use the data! Be an expert! Share the results with your administrators!

40
Thank You! Questions? Please contact: Jennifer Metivier, MS, FASPR Executive Director, ASPR jmetivier@aspr.org 651-290-6294 800-830-2777

Similar presentations


 State.>")


>")
