Download presentation
Presentation is loading. Please wait.

5
ScenarioDescription/ExampleTime HorizonData Size AlertingDetecting and Mitigating ProblemsNowSmall to Large DashboardsService InsightNow-RecentModest ReportsHow is feature X adoption progressing day o?Hourly/DailyMedium Data ScienceBuilding prediction models based on past behaviors UnlimitedVery Large

6
Complex cloud architecture example...

7
Cloud apps have key differences from traditional on-premises systems Internet-facing, always up Service SLAs – uptime requirements Larger scale – ISVs/SaaS vendors host all customers vs. sell/deploy each customer 1-by-1 Troubleshooting in the Cloud Too many machines/databases/etc. to troubleshoot manually Separate “mitigate” vs. “root cause”(RCA) determination Generate telemetry to determine RCA (later) Find a way to get things working ASAP (reboot/failover/whatever)
 determination Generate telemetry to determine RCA (later) Find a way to get things working ASAP (reboot/failover/whatever).")
10
Analyze: At a certain size tools to analyze and monitor the system works System for the system: Beyond that your need a system to monitor the system 11 22 33 44

18
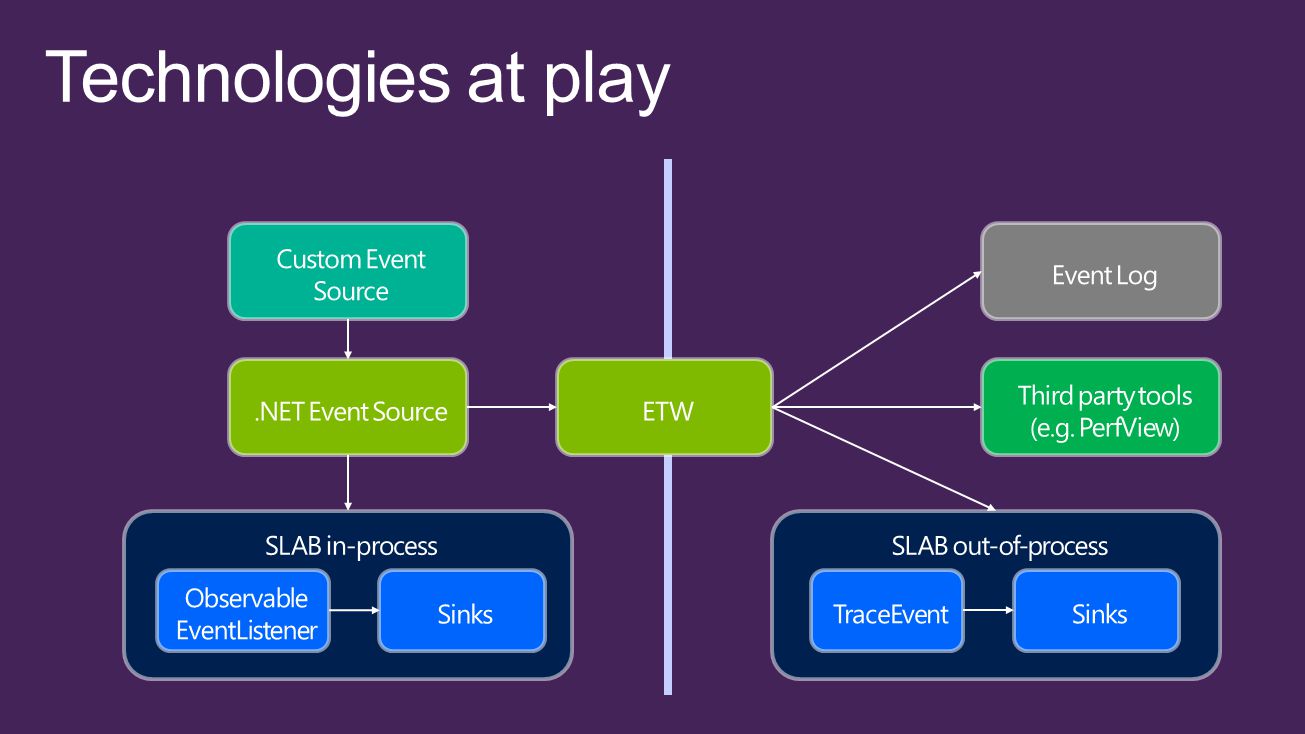
Event Tracing for Windows (ETW) Native to Windows platform Great performance & OK diagnostic tooling Historically hard to publish events EventSource class New in.NET Framework 4.5 Meant to ease authoring experience Extensible but supports ETW-only out of the box Semantic Logging Application Block (SLAB) Provides several destinations for events published with EventSource Does not require any knowledge in ETW Additional tooling support for authoring events
 Native to Windows platform Great performance & OK diagnostic tooling Historically hard to publish events EventSource class New in.NET Framework 4.5 Meant to ease authoring experience Extensible but supports ETW-only out of the box Semantic Logging Application Block (SLAB) Provides several destinations for events published with EventSource Does not require any knowledge in ETW Additional tooling support for authoring events")
21
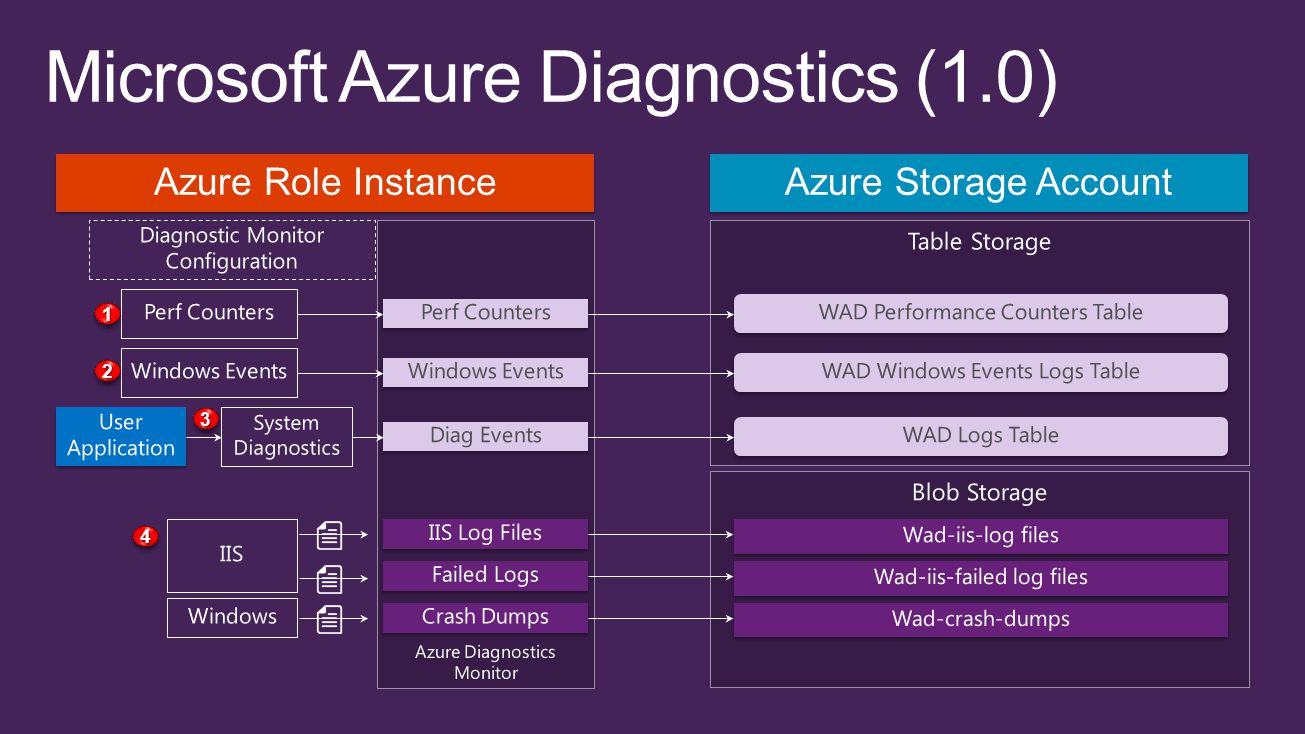
11 22 33 44
22
Data SourceDescription IIS LogsInformation about IIS web sites. Azure Diagnostic infrastructure logsInformation about Diagnostics itself. IIS Failed Request logs Information about failed requests to an IIS site or application. Windows Event logsInformation sent to the Windows event logging system. Performance countersOperating System and custom performance counters. Crash dumps Information about the state of the process in the event of an application crash. Custom error logsLogs created by your application or service..NET EventSource Events generated by your code using the.NET EventSource class. EventSource class Manifest based ETWETW events generated by any process.

23
Health (master) sys.event_log sys.bandwidth_usage sys.database_connection_stats Resource Usage master.sys.resource_usage* master.sys.resource_stats* userdb.sys.dm_db_resource_stats Data Access & Usage sys.dm_db_index_usage_stats sys.dm_db_missing_index_details sys.dm_db_missing_index_groups sys.dm_db_missing_index_group_stats sys.dm_exec_sessions Performance sys.dm_exec_query_stats sys.dm_exec_sql_text sys.dm_exec_query_plan sys.dm_exec_requests sys.dm_db_wait_stats Windows Azure SQL Database and SQL Server -- Performance and Scalability Compared and Contrasted http://msdn.microsoft.com/en-us/library/windowsazure/jj879332.aspx
 sys.event_log sys.bandwidth_usage sys.database_connection_stats Resource Usage master.sys.resource_usage* master.sys.resource_stats* userdb.sys.dm_db_resource_stats Data Access & Usage sys.dm_db_index_usage_stats sys.dm_db_missing_index_details sys.dm_db_missing_index_groups sys.dm_db_missing_index_group_stats sys.dm_exec_sessions Performance sys.dm_exec_query_stats sys.dm_exec_sql_text sys.dm_exec_query_plan sys.dm_exec_requests sys.dm_db_wait_stats Windows Azure SQL Database and SQL Server -- Performance and Scalability Compared and Contrasted")
24
DMVDetailsUse sys.dm_exec_query_statsCumulative view of query statisticsTotal and average resource consumption sys.dm_exec_query_sql_textReturns the text of the SQL batch that is identified by the specified sql_handle Provide overall batch text for statement sys.dm_exec_query_planReturns plan in XML for specified plan handleProvide plan for tuning and analysis sys.dm_exec_requestsCurrent requests executing on your DBCheck for blocking, contention related issues, convoys, etc

26
Look at the Top N’s CPU / IO / Worker Time / Executions / Avgs Compare Queries Between Shards Plan Changes Resources Executes / Hot Shards? What is Slow? Look at Durations… DML Blocking / Waits / Throttling One Offs

31
Works on prem and in the cloud Free -> ~ $2578.00/mo (10 x- large instances) Agent based, hooking profiling API Great cross-instance correlation features
 Agent based, hooking profiling API Great cross-instance correlation features")
32
Availability Performance Usage

37
Application DB Telemetry SCOM SCOM Azure Management Pack: http://www.microsoft.com/en-us/download/details.aspx?id=11324

38
Generating Telemetry WA Table Storage: General maximum throughput is 1000 entities / partition / table Performance Counters: Uses part of timestamp as partition key (limits number of concurrent entity writes) Each partition key is 60 seconds wide, and are written asynchronously in bulk Consuming Telemetry WA Table storage Read performance degrades with # entities/partition Example: Entities/Partition := (# perf counter entries) * (# role instances being monitored) Scaling The Solution – You can extend this approach by Collecting performance counters at a coarser grain (Example: 1 minute -> 5 minutes) Filter more records (skip WARN/INFO messages, keep ERROR) Problems Some PaaS services don’t expose performance counters (Azure SQL DB, Service Bus, etc.)
 Each partition key is 60 seconds wide, and are written asynchronously in bulk Consuming Telemetry WA Table storage Read performance degrades with # entities/partition Example: Entities/Partition := (# perf counter entries) * (# role instances being monitored) Scaling The Solution – You can extend this approach by Collecting performance counters at a coarser grain (Example: 1 minute -> 5 minutes) Filter more records (skip WARN/INFO messages, keep ERROR) Problems Some PaaS services don’t expose performance counters (Azure SQL DB, Service Bus, etc.)")
39
Application DB Telemetry DB DMVs Worker Role Reports/Dashboards

42
Generating Telemetry WA Blob Storage supports higher limits (but you need to batch writes better) Polling DBs requires DMV diffing (which is imperfect but better than nothing) Multi-threading helps scale the system (to a point), but eventually you have latency Consuming Telemetry Database allows use of existing tools (Reporting Services, etc.) Writing Dashboards initially takes some time, but it can really help Scaling The Solution – You can extend this approach by (Same as approach 1 – collect less often or collect less data) Problems Eventually you want data “faster” and things slow down as you scale your service
 Polling DBs requires DMV diffing (which is imperfect but better than nothing) Multi-threading helps scale the system (to a point), but eventually you have latency Consuming Telemetry Database allows use of existing tools (Reporting Services, etc.) Writing Dashboards initially takes some time, but it can really help Scaling The Solution – You can extend this approach by (Same as approach 1 – collect less often or collect less data) Problems Eventually you want data faster and things slow down as you scale your service")
44
Generating Telemetry On-Node collectors batch telemetry, write to Multiple WA Blob Storage Containers Per-Geo Region Accounts (collocated with service stamps in each region) Big Data (Hadoop or similar) system reads data across all stamps Aggregations/Trace Processing generate output data (to WA Blob Storage) ETL moves data into the DW Consuming Telemetry Users Query DW with star schema (facts/dimensions) using normal DB techniques Reports generated for common activities needed to run the business Queries using Hive against Hadoop also possible Scaling The Solution – You can extend this approach by Add more cores to Hadoop Buy a larger DW box Change aggregation grain for aggregation jobs Problems E2E Latency Layers between Hadoop world and Microsoft world (expertise in two technology stacks)
 Big Data (Hadoop or similar) system reads data across all stamps Aggregations/Trace Processing generate output data (to WA Blob Storage) ETL moves data into the DW Consuming Telemetry Users Query DW with star schema (facts/dimensions) using normal DB techniques Reports generated for common activities needed to run the business Queries using Hive against Hadoop also possible Scaling The Solution – You can extend this approach by Add more cores to Hadoop Buy a larger DW box Change aggregation grain for aggregation jobs Problems E2E Latency Layers between Hadoop world and Microsoft world (expertise in two technology stacks)")
51
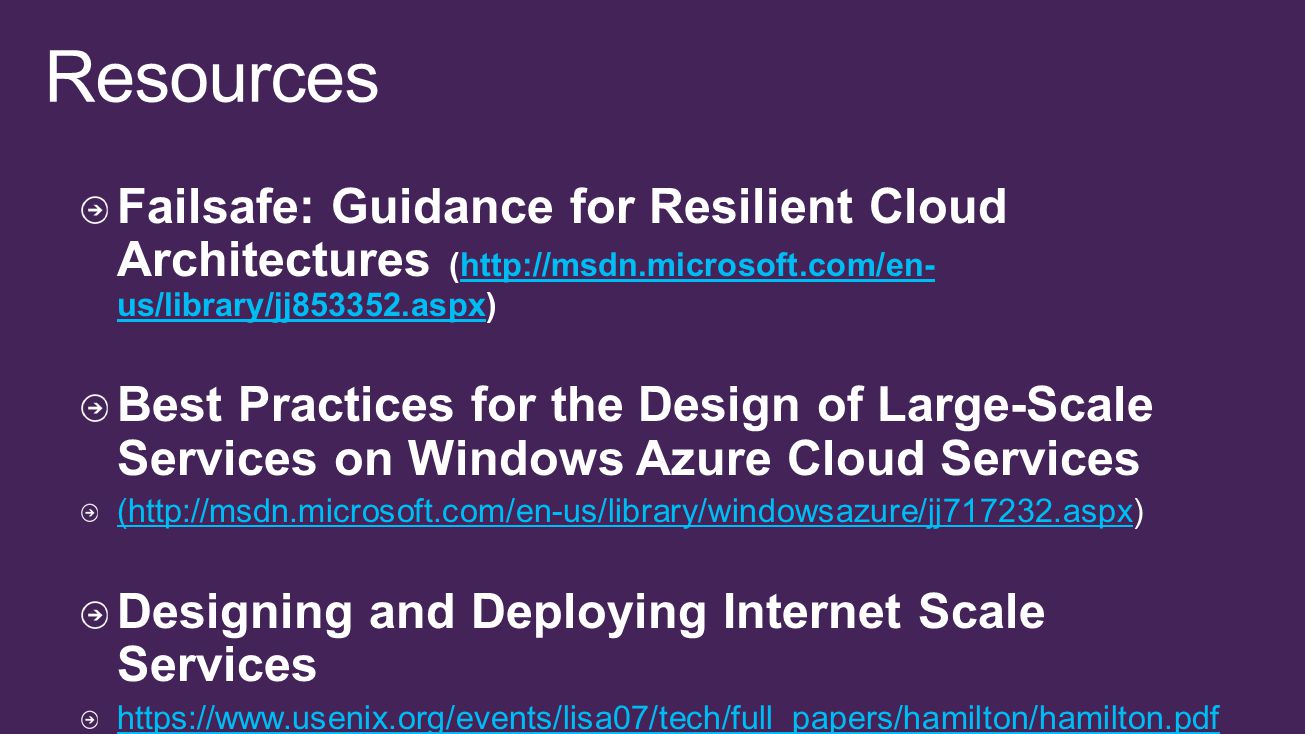
www.microsoft.com/learning http://developer.microsoft.com http://microsoft.com/technet http://channel9.msdn.com/Events/TechEd
Similar presentations


 and SQL Azure Emil Tabakov Telerik Software Academy academy.telerik.com.>")


