Download presentation
Presentation is loading. Please wait.

1
CHAPTER 6 EARTHQUAKES AND RELATED PHENOMENA

2
Struck the Los Angeles area on January 17, 1994 Initiated on a steep fault surface 18 km (11 mi) below surface Shaking lasted about 15 sec Killed 57 people, collapsed freeways, parking structures, and more than 3000 buildings Caused about $40 billion in property damage Case History: Northridge Quake
 below surface Shaking lasted about 15 sec Killed 57 people, collapsed freeways, parking structures, and more than 3000 buildings Caused about $40 billion in property damage Case History: Northridge Quake")
3
Chapter 6 Opening Figure

4
Violent ground-shaking phenomenon by the sudden release of strain energy stored in rocks One of the most catastrophic and devastating hazards Globally, most earthquakes are concentrated along plate boundaries USGS estimates about 1 million quakes annually Millions of people killed and billions of dollars in damage by catastrophic earthquakes Earthquakes

5
Selected Major Earthquake s

6
Stress and strain Stress: A force exerted per unit area within rocks or other Earth materials Strain: Deformation (size, shape, and orientation) of rock materials caused by stress Rock strength: Rock’s ability to withstand a magnitude level of stress before rupture Earthquake: strain beyond rock strength Causes for Earthquakes (1)
 of rock materials caused by stress Rock strength: Rock’s ability to withstand a magnitude level of stress before rupture Earthquake: strain beyond rock strength Causes for Earthquakes (1)")
7
Earthquake: Sudden release of strain energy caused by rock rupture (through faulting) Earthquakes induced by human activities Much smaller magnitude Reservoir-induced earthquakes Deep waste disposal and earthquakes example: chemical waste pumped into ground beneath Rocky Mountain Arsenal Nuclear explosions Causes for Earthquakes (2)
 Earthquakes induced by human activities Much smaller magnitude Reservoir-induced earthquakes Deep waste disposal and earthquakes example: chemical waste pumped into ground beneath Rocky Mountain Arsenal Nuclear explosions Causes for Earthquakes (2)")
8
Human Induced Earthquakes Figure 6.25a

9
Figure 6.25b

10
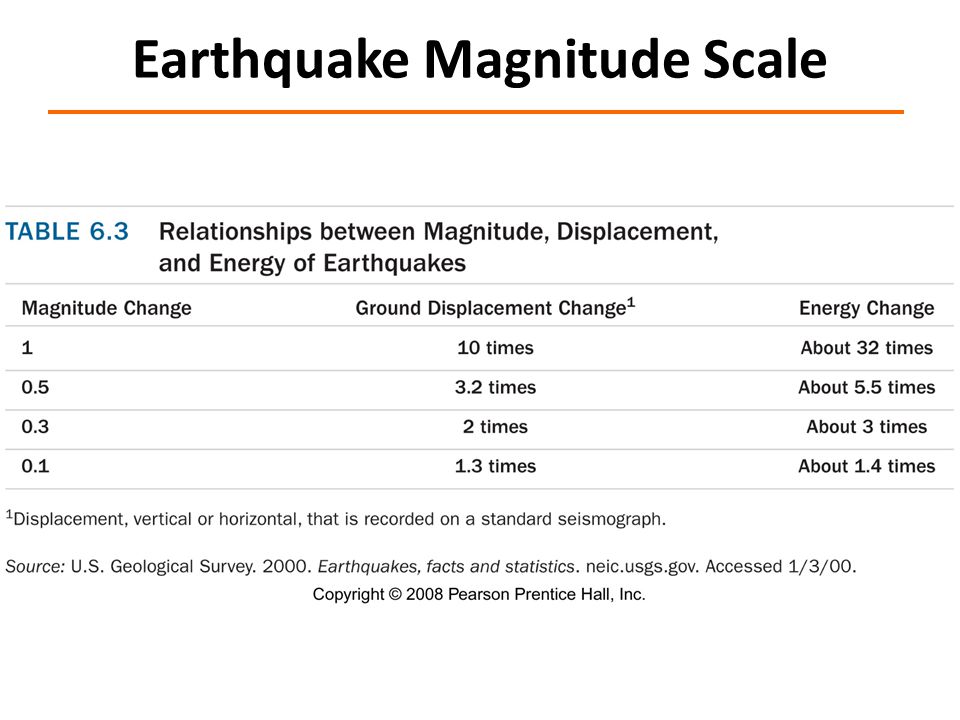
Richter scale: The amplitude of ground motion Increasing one order in magnitude, a tenfold increase in amplitude Moment magnitude scale Measuring the amount of strain energy released Based on the amount of fault displacement Applicable over a wider range of ground motions than the Richter scale Earthquake energy: Increase one order in magnitude, about a 32-times increase in energy Earthquake Magnitude Scale

12
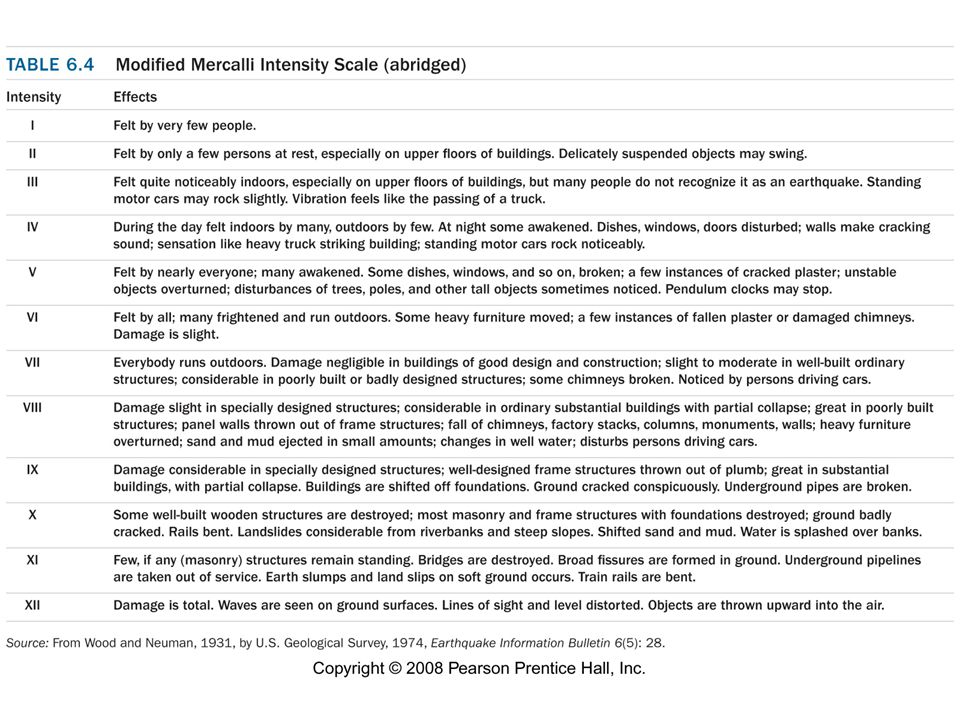
Modified Mercalli ScaleModified Mercalli Scale 12 divisions Qualitative severity measurement of damages and ground movement Based on ground observations, instead of instrument measurement Scale depending on earthquake’s magnitude, duration, distance from the epicenter, site geological conditions, and condition of infrastructure (age, building code, etc.) Often reported by individuals making observations, not measurements! Earthquake Intensity Scale

14
Most earthquakes are concentrated along plate boundaries, and nearly all catastrophic earthquakes are shallow earthquakes Divergent plate boundary: Shallow earthquakes Transform plate boundary: Shallow to intermediate earthquakes Convergent plate boundary: Wide zone of shallow, intermediate, and deep earthquakes; 80% of seismic energy released along the earthquake zone around the Pacific rim Plate Boundary and Earthquakes

15
Map of global seismicity Figure 6.7 Plate Boundary and Earthquakes

16
1811–1812 New Madrid earthquake Nearly destroyed the town of New Madrid Killed unknown number of people Rang church bells as far away as Boston Forests flattened Estimated magnitude >8.0 1886 Charleston earthquake (M 7.5) Killed 60 people Damaged or destroyed most buildings of the city Impacted area beyond 1000 km (620 mi) Major Intraplate Earthquakes
 Killed 60 people Damaged or destroyed most buildings of the city Impacted area beyond 1000 km (620 mi) Major Intraplate Earthquakes")
17
Figure 6.8a

18
Figure 6.8b

19
FaultsFaults Fault types (normal, reverse, thrust, and strike- slip fault) Mapping faults: Surface fault and buried subsurface fault Fault activity (active, potentially active, and inactive faults) Fault-related tectonic creep Global plate boundaries, regional and local faults Earthquake Processes
 Mapping faults: Surface fault and buried subsurface fault Fault activity (active, potentially active, and inactive faults) Fault-related tectonic creep Global plate boundaries, regional and local faults Earthquake Processes")
20
Figure 6.10 TYPES of FAULTS Strike Slip (right or left Lateral) Reverse Fault Hanging wall “up” (compressional) Normal Fault Hanging wall “down” (extensional)
 Reverse Fault Hanging wall up (compressional) Normal Fault Hanging wall down (extensional)")
21
Earthquake’s focus and epicenter Seismic wave propagation outward from the focus P wave: Compressional waves, travel fastest through all physical states of media S wave: Shear waves, travel slower than P waves, but faster than surface waves, only propagate through solid materials Surface waves: Moving along Earth’s surface, travel slowest, but cause most of the damage Seismic Waves

22
Figure 6.3

23
Figure 6.13 3 Types of waves P waves compressional, fastest, travel through solids and liquids S waves, perpendicular ndicular motion, travel through solids, not liquids, slower, arrive after P Surface waves (R), cause of most rolling ground motion, slowest
, cause of most rolling ground motion, slowest")
24
Seismograph or seismometer: device to record seismic waves Seismogram: the record of an earthquake Amplitude of seismic waves: Amplitude of ground vibration First arrival of seismic waves Determine the time of earthquake Distance to epicenter from a seismograph based on the difference in arrival time between P waves and S waves Measuring Seismic Waves

25
Figure 6.14a

26
Three wave types recorded: Figure 6.14c

27
Figure 6.14d THREE seismic stations Required to locate an epicenter

28
Seismic waves travel differently through different rock materials Propagate faster through dense and solid rocks Material amplification: Intensity (amplitude of vertical movement) of ground shaking more severe in unconsolidated materials Seismic energy attenuated more and propagated less distance in unconsolidated materials Material Amplification
 of ground shaking more severe in unconsolidated materials Seismic energy attenuated more and propagated less distance in unconsolidated materials Material Amplification")
29
Figure 6.16

30
Mexico City Earthquake Figure 6.17a

31
Mexico City 1985: City built on ancient lake deposits Figure 6.17b

32
Ground motion is related to the amplitude of seismic waves and its acceleration Measured by accelometers in terms of the acceleration of gravity Both vertical and horizontal accelerations M 6.0 to M 6.9 can have 0.3 g to 0.7 g accelerations Structure designs target to withstand 0.6 g to 0.7 g Ground Acceleration

33
Faulting and elastic rebound Stages of earthquake cycle Inactive and aftershock stage Stress accumulation stage Foreshocks Main shock (major earthquake) Earthquake cycle over time: Recurrence intervals Earthquake cycle in space: Seismic gaps Earthquake Cycles
 Earthquake cycle over time: Recurrence intervals Earthquake cycle in space: Seismic gaps Earthquake Cycles")
34
Figure 6.24 Earthquake Cycle: Undeformed rock Stress (created by a force) Strain (change in shape) Rupture followed by Elastic rebound (rock returns to original shape But may be displaced horizontally, Vertically, or both
 Strain (change in shape) Rupture followed by Elastic rebound (rock returns to original shape But may be displaced horizontally, Vertically, or both")
35
Primary effects Ground shaking, tilting, and ground rupture Loss of life and collapse of infrastructure Secondary effects Landslides, liquefaction, and tsunamis Fires, floods, and diseases Tertiary effects Social and psychological impacts Effects of Earthquakes (1)
")
36
Figure 6.19a

37
Figure 6.19b 1989 Loma Prieta “World Series Earthquake” Freeway collapse supports failed

38
Japanese word for “large harbor waves” Triggered by earthquake, submarine volcanic explosion, underwater landslide, asteroid impact Recent tsunami examples 1960 Chile earthquake, killing 61 people in Hawaii 1964 Alaska earthquake, killing about 130 people in AK and CA 1993 earthquake near Japan, killing 120 people in Japan 1998 Papua New Guinea earthquake, killing more than 2100 people 2004 Indonesian earthquake, killing about 250,000 people Effects of Earthquakes: Tsunami

39
Figure 6.29

40
Figure 6.Aa

41
Shallow Earthquake triggered tsunami as ocean floor was displaced upward Figure 6.Ab

42
Figure 6.B

43
Figure 6.Ca

44
Figure 6.Cb

45
Pacific Warning System failed to warn of the tsunami. New warning system being set up in Indian Ocean Figure 6.30

46
Earthquake risks Probabilistic methods for a given magnitude or intensity Earthquake risk of an area Earthquake risk of a fault segment Seismic hazard maps Conditional probabilities for future earthquakes Earthquake Risks

47
Figure 6.31a

48
Long-term prediction Earthquake hazard risk mapping Short-term prediction (forecast) Frequency and distribution pattern of foreshocks Deformation of the ground surface: Tilting, elevation changes Emission of radon gas Seismic gap along faults Abnormal animal activities? Earthquake Prediction

49
Figure 6.31b Risk varies Along the San Andreas Fault in California depending on Activity along the Fault, whether There is fault creep To relieve the Strain, or whether There is a seismic Gap where strain Is building

50
Along the active Anatolian Fault in northern Turkey, densely populated cities are at risk as fault activity migrates west over time. Figure 6.32

51
Hazard Reduction Programs Develop a better understanding of the source and processes of earthquakes Determine earthquake risk potential Predict effects of earthquakes: this will vary By ground type, structural properties, and population density Apply research results Response to Earthquake Hazards (1)
")
52
Adjustments to earthquake activitiesAdjustments to earthquake activities Site selection for critical facilities: power Plants, waste disposal, schools, hospitals Structure reinforcement and protection Engineering and building codes for homes, bridges, skyscrapers Land-use regulation and planning Consideration of location of populations where possible away from faults, reservoirs, historically damaged areas Emergency planning and management: Insurance and relief measures Communication, utilities, fire control, water, transportion Response to Earthquake Hazards (2)
")
53
Technically feasible: only about a minute warning Network of seismometers, sensing the first earthquake motion and sending a warning to critical facilities and public Warning system Not a prediction tool Can create a false alarm Better prediction and better warning system? Earthquake Warning Systems

54
Public education and preparedness for the earthquake potential, even psychologically Pre-earthquake planning: what to do when struck During-earthquake: understand the situation and formulate a good strategy Post-earthquake emergency response Better engineering of structural designs to minimize the future hazard risks Perception of the Earthquake Hazard

Similar presentations


>")


