Download presentation
Presentation is loading. Please wait.

1
Green Team Speed System Proportional Only Controller Design and Experimental 11-09-05 Dustin Fraley DeAndre Strong Stephanie Wilson

2
Outline Description of Speed System Previous work Step Response Frequency Response Root Locus Proportional only controller response curves Model Experimental Results Conclusions

3
Speed System Diagram SRC 1 ST 1 Motor / Generator SCZ 1

4
SSOC Input-Output Relationship Speed System M(t) Input (%) C(t) Output (RPM)
 Input (%) C(t) Output (RPM)")
6
Step Response Input-Output Relationship Ke -t 0 M(t) Input (%) C(t) Output (RPM) τ – Time Constant (s) = 0.2 t 0 – Dead Time (s) = 0.1 K – Gain (RPM/%) = 17
 Input (%) C(t) Output (RPM) τ – Time Constant (s) = 0.2 t 0 – Dead Time (s) = 0.1 K – Gain (RPM/%) = 17")
7
Frequency Response Input-Output Relationship Ke -t 0 M(t) Input (%) C(t) Output (RPM) τ – Time Constant (s) t 0 – Dead Time (s) K – Gain (RPM/%)
 Input (%) C(t) Output (RPM) τ – Time Constant (s) t 0 – Dead Time (s) K – Gain (RPM/%)")
8
tau - t 0 - tau -0.2 s t 0 – 0.1 s

10
Step and Frequency Response Experiments Conclusions FOPDT Parameters = 0.2 s t o = 0.1 s K = 17 RPM/% order about 1st f u = 3.5 Hz K cu = 0.3%/RPM

11
Feedback Controller

12
Characteristic Equation (CE) Padés Approximation
 Padés Approximation")
13
Control Gain Locations K C-CD =0.02 %/RPM K CU =0.3 %/RPM K QD =0.19 %/RPM Over-damped Under-dampedUnstable f u = 24/2 Π = 3.82 Hz

14
Root Locus Conclusions Ultimate K cu = 0.3 Quarter Decay K c = 0.19 Critically Damping K CD = 0.02 Underdamped 0.02<K c <0.3 Overdamped 0<K c <0.02 *all units are % / RPM

15
Determination of f u Bode plots f u = 3.5 Hz Characteristic Equation (CE) f u = 4 Hz Root Locus f u = 3.8 Hz
 f u = 4 Hz Root Locus f u = 3.8 Hz")
16
P-only Controller Analysis Model FOPDT Parameters = 0.2 s t o = 0.1 s K = 17 RPM/% Values found for Ultimate (Marginal Stability) Quarter Decay Critical Damping Overdamped
 Quarter Decay Critical Damping Overdamped")
18
Decay Ratio – 1 Oscillatory Settling Time – Never Offset - CBD Set Point Output

19
Decay Ratio – 0.25 Oscillatory Settling Time – 1.25 s Offset – 71 RPM Set Point Output

20
Decay Ratio – 0 Monotonic Settling Time – 0.5 s Offset – 219 RPM Set Point Output

21
Decay Ratio – 0 Monotonic Settling Time – 0.5 s Offset – 230 RPM Set Point Output

23
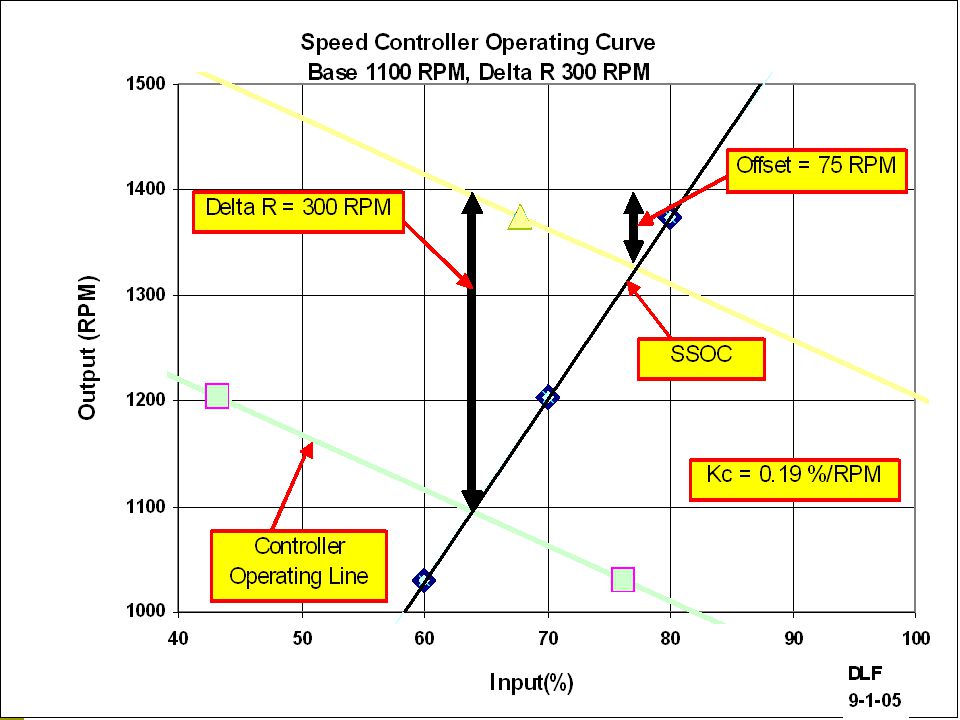
Controller Operating Curve for Model m bar = 63% r(t) = 1100 RPM delta r = 300 RPM
 = 1100 RPM delta r = 300 RPM")
28
P-only Controller Analysis Experimental FOPDT Parameters = 0.2 s t o = 0.1 s K = 17 RPM/% Values found for Ultimate (Marginal Stability) Quarter Decay Critical Damping Overdamped
 Quarter Decay Critical Damping Overdamped")
29
Set Point Output SIW 11-5-05

30
RPM Set Point Output SIW 11-5-05

31
RPM Set Point Output SIW 11-5-05

32
Set Point Output SIW 11-5-05

33
could not be determined

34
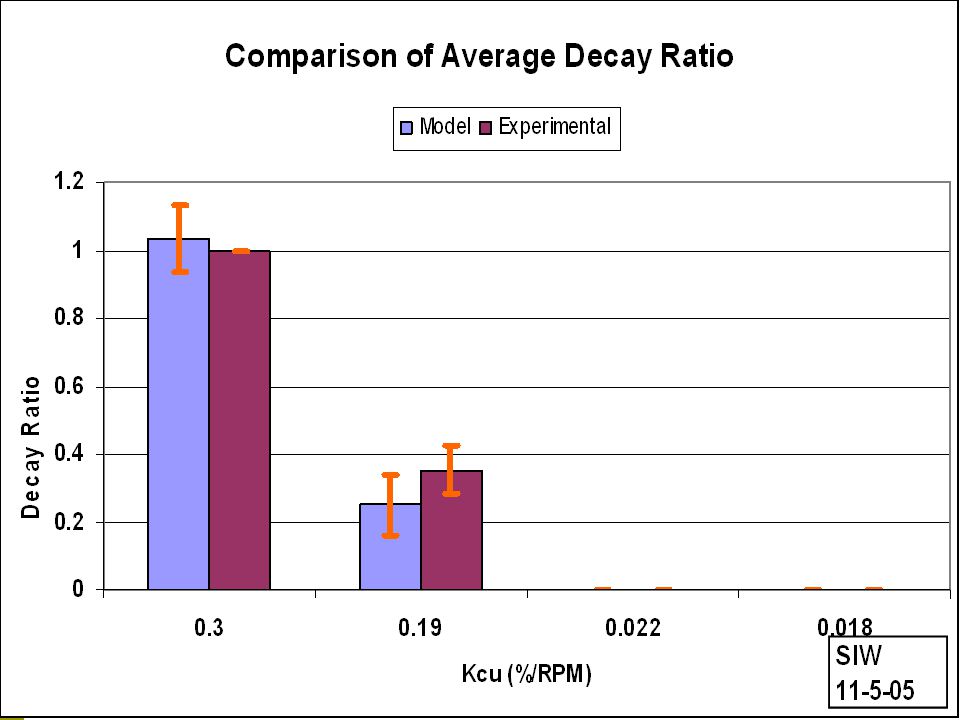
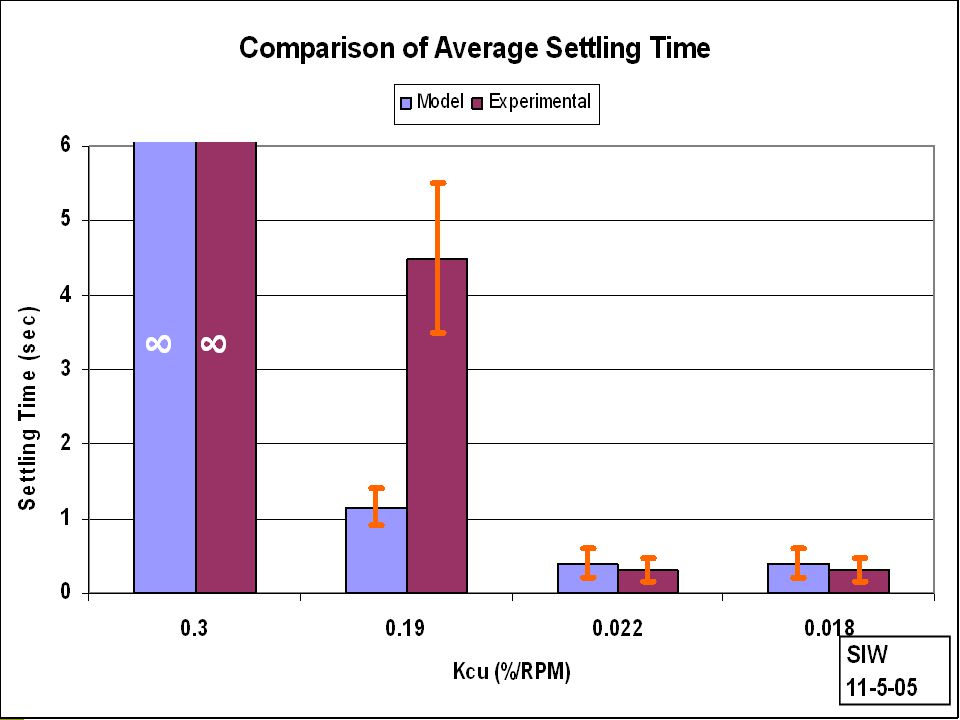
Model vs. Experimental Decay Ratio Settling Offset

37
FVT = delta R*(1-K C K/(1+K C K))
)")
38
Conclusions Low K c values Model and experimental responses are analogous Higher K c values Experimental responses never settle Recommended K c = 0.19 (%/RPM) High offset (75 RPM)
 High offset (75 RPM)")
39
Proportional-Integral Feedback Controller

Similar presentations


 into c(t): Negative Feedback Control with Proportional Only Controller Jigsaw Team Estrogen Stephanie Wilson Amanda Newman Jessica Raymond.>")

 Controllers Team Purple: John Pangle Jessica Raymond Justin Whitt ENGR 329 November 30, 2005.>")


>")


