Download presentation
Presentation is loading. Please wait.

1
111 Update on Clinical Trials Registration and Results Reporting Requirements Deborah A. Zarin, M.D. ClinicalTrials.gov February 24, 2009

2
Context: Continuing Concerns About Lack of Transparency of Clinical Trial Information

3
Recent Events: Lack of Transparency in Clinical Research

4
Source: Figure 1A. Turner et al. (NEJM, 2008)
")
5
The investigation was launched following concerns… …although the ENHANCE trial ended in April 2006, the data had not yet been released. …[the sponsors] did not register the clinical trial in a timely manner. …[the sponsors] attempted to change the study endpoints, and thus the study results, prior to the public release of the results.

6
ENHANCE Source: Kastelein JJ, Sager PT, de Groot E, Veltri E. Am Heart J. 2005 Feb;149(2):234-9. 1 2 3
:")
7
Primary Outcome Measures: Change in ultrasound-determined average carotid artery intima-media thickness (IMT) on a per subject basis between baseline and endpoint. [ Time Frame: 24 months ] Primary Outcome Measures: Change in ultrasound-determined average carotid artery intima-media thickness (IMT) on a per subject basis between baseline and endpoint. [ Time Frame: 24 months ]
 on a per subject basis between baseline and endpoint. [ Time Frame: 24 months ].")
8
Source: Silverstein FE et al. JAMA. 2000 Sep 13;284(10):1247-55.
:")
9
Kaplan-Meier estimates for ulcer complications according to traditional definition. Results are truncated after 12 months, no ulcer complications occurred after this period. Adapted from Lu 2001. Source: Jüni P, Rutjes AW, Dieppe PA. BMJ. 2002 Jun 1;324(7349):1287-8.
:")
10
10 “The Neurontin Legacy – Marketing through Misinformation and Manipulation” Studies “designed and commissioned specifically to promote Neurontin use.” Seeding trial “to give neurologists the opportunity to titrate to higher doses [up to twice the FDA- approved limit] when needed” Delayed publication of negative results to mitigate damage to “neurontin’s marketing success” Summary: “the documentation of comprehensive manipulation of research and publication related to Neurontin is remarkable.” Landefeld CS, Steinman MA. NEJM. N Engl J Med 360:103-6
![10 The Neurontin Legacy – Marketing through Misinformation and Manipulation Studies designed and commissioned specifically to promote Neurontin use. Seeding trial to give neurologists the opportunity to titrate to higher doses [up to twice the FDA- approved limit] when needed Delayed publication of negative results to mitigate damage to neurontin’s marketing success Summary: the documentation of comprehensive manipulation of research and publication related to Neurontin is remarkable. Landefeld CS, Steinman MA.](http://images.slideplayer.com/16/5244269/slides/slide_10.jpg "NEJM. N Engl J Med 360:")
11
11

12
(WSJ, Aug 2008)
")
14
PLoS Med. 2008;5(11): e217
: e217")
15
Lee K, Bacchetti P, Sim I. PLoS Med. 2008;5(9): e191
: e191")
16
16 History of ClinicalTrials.gov FDAMA 113 (1997): Mandates Registry –IND trials for serious and life-threatening diseases or conditions ClinicalTrials.gov Launched in February 2000 Calls for Increased Transparency of Clinical Trials –Maine State Law; State Attorneys General –Journal Editors (2004) ClinicalTrials.gov Accommodates Other Policies FDAAA 801 (2007): Expands Registry and Adds Results Database
: Mandates Registry –IND trials for serious and life-threatening diseases or conditions ClinicalTrials.gov Launched in February 2000 Calls for Increased Transparency of Clinical Trials –Maine State Law; State Attorneys General –Journal Editors (2004) ClinicalTrials.gov Accommodates Other Policies FDAAA 801 (2007): Expands Registry and Adds Results Database")
17
17 Policies and Users ClinicalTrials.gov FDAMA 113 BPCA Maine FDAAA Sponsor Policy (e.g., NIH, VA) ICMJE WHO Ottawa Statement Recruitment (e.g., patients, physicians) Journal Editors Research Funders IRBs Health Policy Makers
 ICMJE WHO Ottawa Statement Recruitment (e.g., patients, physicians) Journal Editors Research Funders IRBs Health Policy Makers")
18
18 ClinicalTrials.gov Statistics (as of 02/03/2009) NumberPercent Total67,064 100% Type of Trial* Observational 10,690 16% Interventional57,119 84% –Drug & Biologic42,684 –Surgical Procedure 8,585 –Behavioral, Gene Transfer, Other 7,997 –Device** 3,862 International Sites (161 countries) US only32,772 49% Non-US only23,109 34% US & Non-US mixed 4,064 6% Missing 7,119 11% * 171 records missing Study Type information **173 device trials – “delayed posting”
 NumberPercent Total67, % Type of Trial* Observational 10,690 16% Interventional57,119 84% –Drug & Biologic42,684 –Surgical Procedure 8,585 –Behavioral, Gene Transfer, Other 7,997 –Device** 3,862 International Sites (161 countries) US only32,772 49% Non-US only23,109 34% US & Non-US mixed 4,064 6% Missing 7,119 11% * 171 records missing Study Type information **173 device trials – delayed posting")
19
19 ClinicalTrials.gov Statistics (cont.) (as of 02/03/2009) User Statistics Page Views per month 40 Million Unique visitors per month 500,000 NumberPercent Trials by Data Provider US Federal (including NIH)18,088 27% Industry21,072 31% University, Other28,820 42% Total 67,980
 (as of 02/03/2009) User Statistics Page Views per month 40 Million Unique visitors per month 500,000 NumberPercent Trials by Data Provider US Federal (including NIH)18,088 27% Industry21,072 31% University, Other28,820 42% Total 67,980")
20
Search Features Powerful Search Engine –Synonymy E.g., can find V501 studies by searching “Gardasil” –Hierarchies E.g., can find Crohn’s disease by searching for IBD –Spelling relaxation Interface allows for field specific searching –E.g., can find “condition” without finding “exclusion criterion”

25
Update on Clinical Trial Registration

26
26 Public Law 110-85 Sec.801 Expanded Clinical Trial Registry Enacted on September 27, 2007 Requires Trial Registration (Dec 2007) –Phase II-IV drug and device trials for all diseases –Data elements: ClinicalTrials.gov + ~ WHO/ICMJE Requires Results Reporting (Sept 2008) –Trials of FDA-approved or cleared drugs and devices –“Basic” Results: Baseline Characteristics, Primary & Secondary Outcomes, Statistical Analyses –Adverse Events (Sept 2009) –“Expansion” of results by rulemaking (Sept 2010) Added enforcement provisions
 –Phase II-IV drug and device trials for all diseases –Data elements: ClinicalTrials.gov + ~ WHO/ICMJE Requires Results Reporting (Sept 2008) –Trials of FDA-approved or cleared drugs and devices – Basic Results: Baseline Characteristics, Primary & Secondary Outcomes, Statistical Analyses –Adverse Events (Sept 2009) – Expansion of results by rulemaking (Sept 2010) Added enforcement provisions")
27
Enforcement Provisions Notices of non-compliances Civil monetary penalties up to $10,000/day Withholding of NIH grant funds

28
Key Terms Applicable Clinical Trials –Interventional trials –Phase 2-4 drug, biologic, device –>= one site in U.S. –Ongoing as of 9/27/07, or later Responsible Party –Sponsor, grantee –PI if designated (Primary) Completion Date
 Completion Date.")
29
Wood AJJ. Progress and deficiencies in the registration of clinical trials. NEJM. 2009

31
What Information Is In the Trial Registry? Basic Protocol Details –Condition, intervention(s), design, outcome measures, key dates Administrative Information –NCT#, other IDs, Responsible Party, PI Recruitment and location status Linkages –PubMed, FDA resources, consumer health info 31
, design, outcome measures, key dates Administrative Information –NCT#, other IDs, Responsible Party, PI Recruitment and location status Linkages –PubMed, FDA resources, consumer health info 31.")
32
New Registrations Continue to Increase

33
Registration of Phase 1 and Device Trials 2100 device trials registered between 9/07 and 1/09 –175 are in “lock box” 162 Industry 13 Other Phase 1 trials –186/month in fy 2008 (73% increase from 07) –205/month in fy 2009* (10% increase from 08) * First four months
 –205/month in fy 2009* (10% increase from 08) * First four months")
34
Key Points: Memo from Dr. Kington, Acting Director, to NIH Grant Awardess “For grants, NIH is generally not the sponsor … and, as such, NIH would not be the responsible party.” “Responsible parties who have not yet registered their clinical trials should do so immediately.” “Thank you for your attention to this important matter and your commitment to helping enhance the transparency of NIH funded clinical trials.”

35
Status of Stanford Trials 73 may be “applicable” –65 have outcome measure –2 have RP –62 have start date –1 has “primary completion date” –8 have “completion date” How many “results” are due? 35

36
Enforcement Provisions Notices of non-compliances Civil monetary penalties up to $10,000/day Withholding of NIH grant funds

37
Bottom Line Register prior to enrollment: –Phase 2-4 interventional trials that include a drug, device or biologic –Regardless of whether or not the trial is being used to support an FDA application Report results: –Any trial described above once the drug, device or biologic has been approved; OR –Within one year of “primary completion date” Keep all information up to date! 37

38
38 Basic Results Database

39
39 Basic Results Database: General Characteristics Results of “applicable clinical trials” of FDA-approved/cleared medical products Generally, submission within 12 months of the earlier of estimated or actual trial completion date (of primary outcome) Delayed Submission of Results –Seeking initial approval –Seeking approval of a new use –Extensions for “good cause”
 Delayed Submission of Results –Seeking initial approval –Seeking approval of a new use –Extensions for good cause")
40
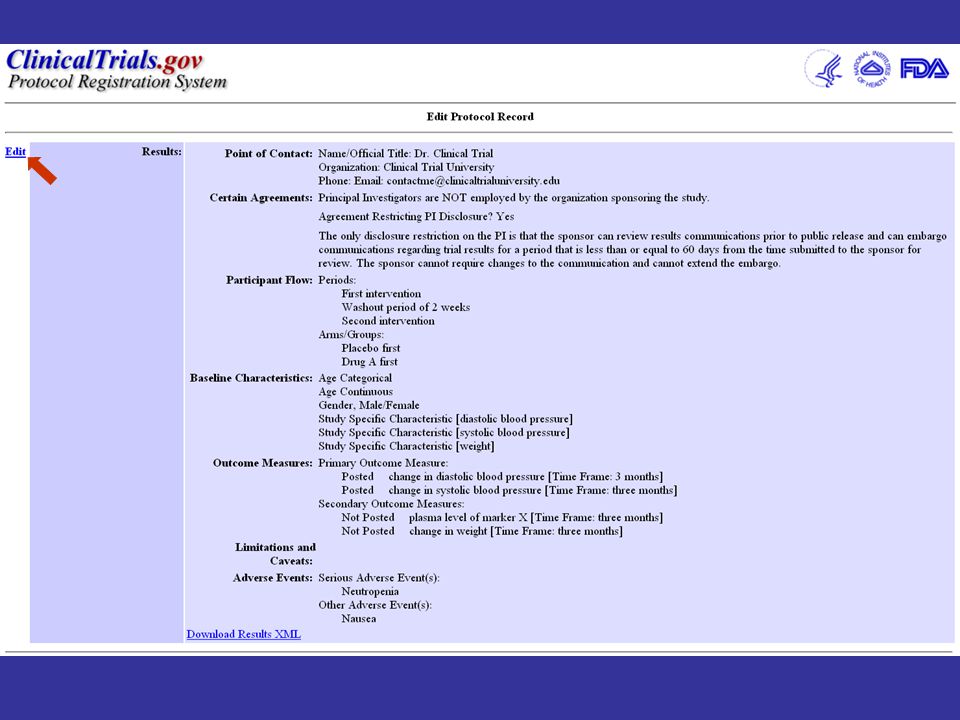
Basic Results Modules Participant Flow Baseline and Demographic Characteristics Outcome Measures Adverse Events (summary data) Other Information –“Certain Agreements” Restricting Results Disclosure –Overall Limitations and Caveats –Results Point of Contact
 Other Information – Certain Agreements Restricting Results Disclosure –Overall Limitations and Caveats –Results Point of Contact")
41
41 Current Status – “Basic Results” (as of 02/06/09) Functional Web-based Data Entry System Launched in September 2008 Ongoing system of feedback and improvements 410 Results Records have been submitted Industry: 293 records from 72 data providers Other: 117 records from 80 data providers Anticipate greatly increased rate of submission
 Functional Web-based Data Entry System Launched in September 2008 Ongoing system of feedback and improvements 410 Results Records have been submitted Industry: 293 records from 72 data providers Other: 117 records from 80 data providers Anticipate greatly increased rate of submission")
42
42 Sample Posted Results

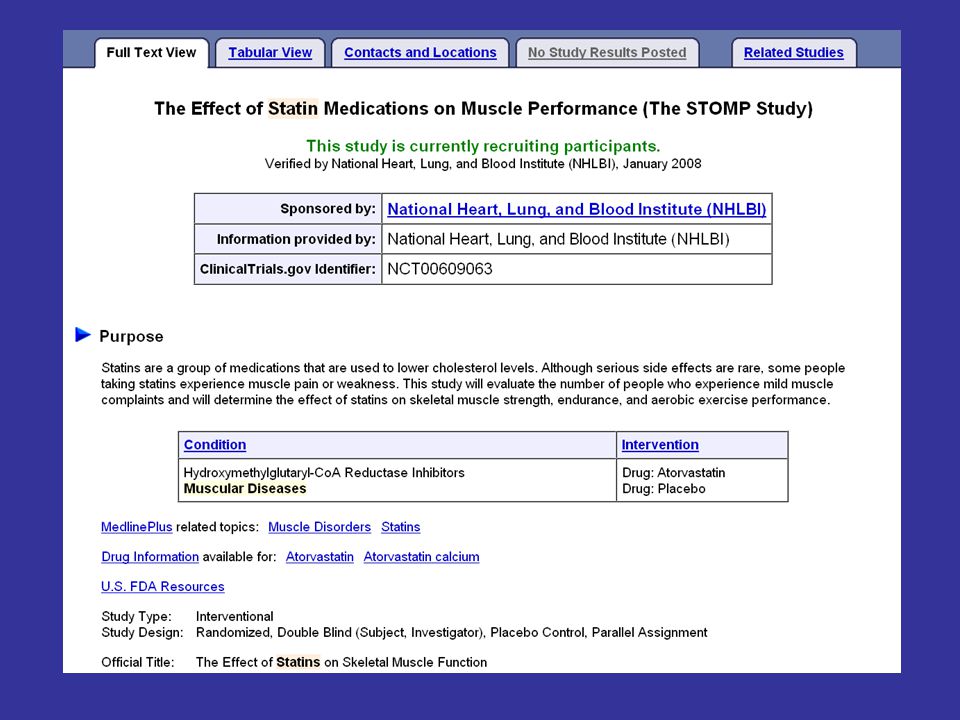
43
43 Published Participant Flow Source: Kimmick GG et al. Breast J. 2006 Mar-Apr;12(2):114-22.
:")
45
Reasons Not Completed Milestone Arms

46
Multiple “Periods” Crossover Design

47
Published Baseline Data Source: Richter JE et al. Am J Gastroenterol. 2001 Mar;96(3):656-65.
:")
48
User-Specified Measure “Default” Required Measures Categories

49
Arms

50
50

51
51 Published Primary Outcome Source: Kimmick GG et al. Breast J. 2006 Mar-Apr;12(2):114-22.
:")
53
Categories

54
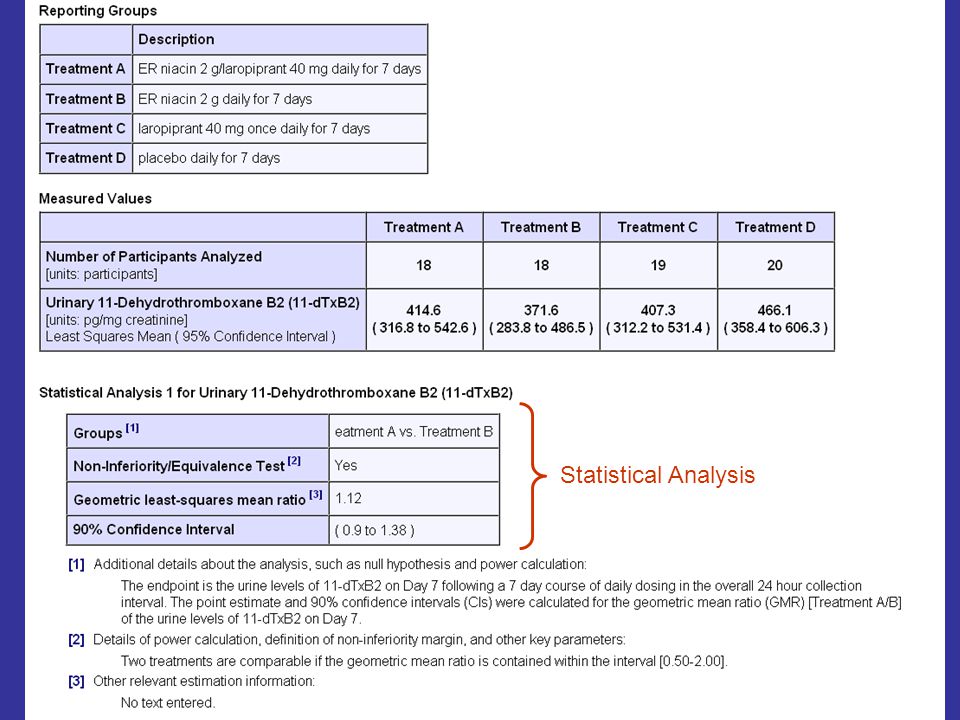
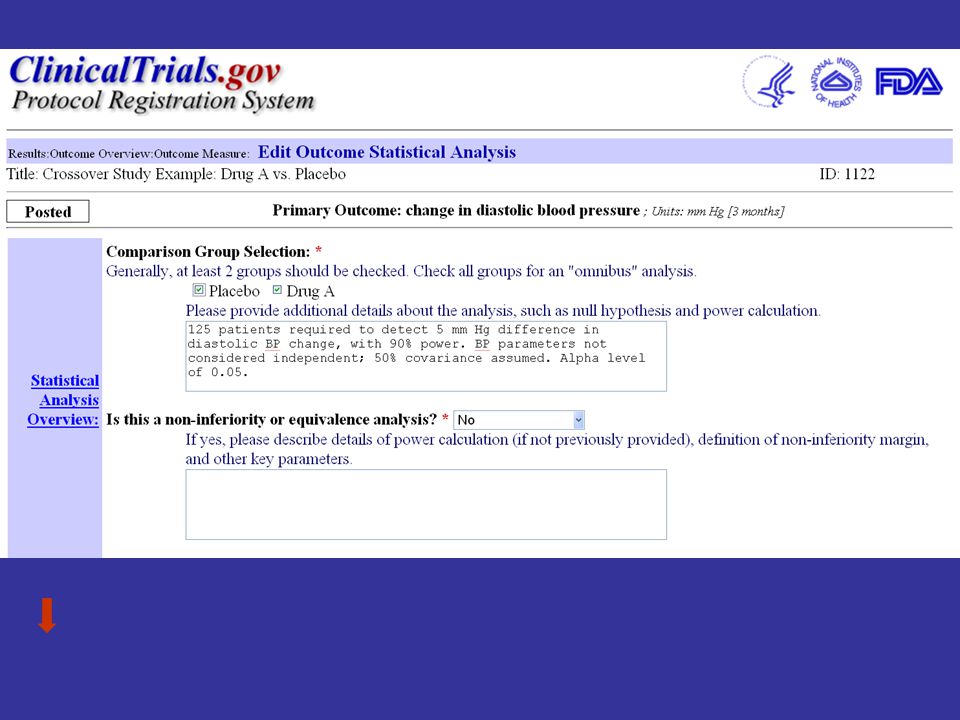
Statistical Analysis

56
Published Adverse Events

57
57

59
59 Results Data Entry Process Technical Issues

60
60 Design Requirements Display consists of data tables with minimal text—must be self-explanatory System must accommodate range of study designs and facilitate comparison across studies NLM directed to: –Consider different methods of display based on principles of risk communication for different audiences –Ensure the data are searchable in many ways Structured data entry required to facilitate search and display needs 60

61
61 Design Features Tables are “constructed” by the data provider –Columns are pre-set as study arms, but can be changed by the data provider –Rows are measures—some are pre-set, others are customized for each study –Type of measure determines specific design of “cells” Attempt to balance fixed structure with flexibility

62
62 Principles for Using the Basic Results Database Submitted data are used to develop basic tables for the public display Tables must be interpretable by people not familiar with each particular study Labels for rows, columns, and units of measure must be meaningful and precise

63
Who is the Audience? PI and Clinical Research Team (You!) Other Medical Researchers in same field [Study Sponsor] Other Medical Researchers in other fields Other Readers of the medical literature Science Writers Lay Public (readers of consumer health literature)
 Other Medical Researchers in same field [Study Sponsor] Other Medical Researchers in other fields Other Readers of the medical literature Science Writers Lay Public (readers of consumer health literature).")
71
Resources to Help Data Providers “Helpful Hints” –Illustrates process for entering different study designs (parallel, crossover, diagnostic accuracy, bioequivalence—in progress) Webinar “Common Errors” Individual discussions regarding particular studies Presentations
 Webinar Common Errors Individual discussions regarding particular studies Presentations")
72
72 Interesting Findings to Date Large numbers of submitted Outcome Measures and Statistical Analyses Power of Defaults (e.g., “Baseline Measures”) –Age > 65 –Race and Ethnicity –Region of Enrollment Problems with imprecise entries
 –Age > 65 –Race and Ethnicity –Region of Enrollment Problems with imprecise entries")
73
Lessons Learned from Early Submissions of Basic Results Many iterations with the QA staff are necessary to reach minimal quality standards and to correct serious flaws Data Providers must be able to understand the study design and data analysis –Typically, the investigator and a statistician will need to be involved 73

74
Quality Assurance Challenges Data tables will be the public representation of the study—must be clear and informative; NLM QA Focuses on: –Apparent Validity (when possible) –Meaningful Entries –Internal consistency/logic –Format
 –Meaningful Entries –Internal consistency/logic –Format")
75
75 Common Quality Concerns Reporting of percentage without reporting absolute numbers Improper use of terms Incidence Proportion and Ratio Frequency Reporting a change—lack of specificity Subtraction: minuend vs. subtrahend Ratio: nominator vs. denominator Complicated outcomes that cannot be understood

76
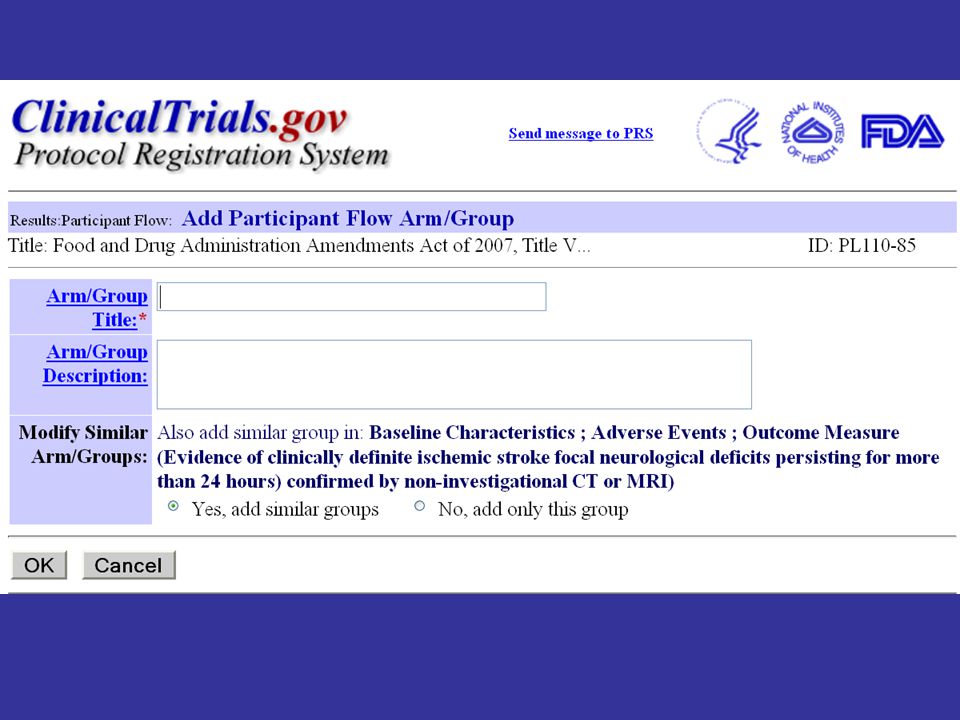
Registration and Results Data Must be Consistent Participant Flow Numbers and Enrollment Study Design and Results Tables –Number of Arms

77
77 Actual Enrollment: 229 Study Start Date: June 2006 Study Completion Date: October 2007 Primary Completion Date: October 2007 (Final data collection date for primary outcome measure) Summary Protocol Section: Basic Results Section: PlaceboDrug X STARTED220211 COMPLETED218210 NOT COMPLETED21 Participant Flow: Initial Treatment Actual enrollment (229) displayed in the protocol section does not match total number started in the basic results section (220 + 211 = 431) BEFORE Revision (Public View)
 Summary Protocol Section: Basic Results Section: PlaceboDrug X STARTED COMPLETED NOT COMPLETED21 Participant Flow: Initial Treatment Actual enrollment (229) displayed in the protocol section does not match total number started in the basic results section ( = 431) BEFORE Revision (Public View)")
78
Table Structure Must be Logical

79
79 Measured Values Drug X, Week 10 Drug X, Change from Week 10 to 18 Number of Participants Analyzed8880 Treatment Satisfaction Questionnaire After 18 Weeks of Treatment [units: Score] Mean ± Standard Deviation 81 ± 17.467.9 ± 12.16 Inconsistency between columns and rows: Measure “at week 10” and Measure “after 18 weeks of treatment” BEFORE Revision (Public View)
![79 Measured Values Drug X, Week 10 Drug X, Change from Week 10 to 18 Number of Participants Analyzed8880 Treatment Satisfaction Questionnaire After 18 Weeks of Treatment [units: Score] Mean ± Standard Deviation 81 ± ± Inconsistency between columns and rows: Measure at week 10 and Measure after 18 weeks of treatment BEFORE Revision (Public View)](http://images.slideplayer.com/16/5244269/slides/slide_79.jpg "79 Measured Values Drug X, Week 10 Drug X, Change from Week 10 to 18 Number of Participants Analyzed8880 Treatment Satisfaction Questionnaire After 18 Weeks of Treatment [units: Score] Mean ± Standard Deviation 81 ± ± Inconsistency between columns and rows: Measure at week 10 and Measure after 18 weeks of treatment BEFORE Revision (Public View)")
80
Data Must Make Sense Outcome Measure Name, Description, Units and Data are Compatible

81
81 Measured Values Intervention XControl Number of Participants Analyzed2827 Hours Per Day of Sleep [units: Average Hours per Day] Mean ± Standard Deviation 823 ± 92864 ± 106 Inconsistency between Units of Measure, “average hours per day,” and Measure Data: value provided is greater than the total number of hours in a day BEFORE Revision (Public View)
![81 Measured Values Intervention XControl Number of Participants Analyzed2827 Hours Per Day of Sleep [units: Average Hours per Day] Mean ± Standard Deviation 823 ± ± 106 Inconsistency between Units of Measure, average hours per day, and Measure Data: value provided is greater than the total number of hours in a day BEFORE Revision (Public View)](http://images.slideplayer.com/16/5244269/slides/slide_81.jpg "81 Measured Values Intervention XControl Number of Participants Analyzed2827 Hours Per Day of Sleep [units: Average Hours per Day] Mean ± Standard Deviation 823 ± ± 106 Inconsistency between Units of Measure, average hours per day, and Measure Data: value provided is greater than the total number of hours in a day BEFORE Revision (Public View)")
82
82 Measure TypeSecondary Measure NameUse of Community Health Resources Measure DescriptionEvaluation of visits to primary care pediatrician, hospital emergency and re- hospitalization Time FrameUp to 3 months after discharge Safety IssueNo Secondary Outcome Measure: Use of Community Health Resources Measured Values Early Discharge Standard Discharge Number of Participants Analyzed9086 Use of Community Health Resources [units: Number] 4.4%10.5% Data are inconsistent: percentages of what? Invalid entry: needs to be numerical (cannot include “%”) BEFORE Revision (Public View) Implies number of health resources used – how was it measured?
![82 Measure TypeSecondary Measure NameUse of Community Health Resources Measure DescriptionEvaluation of visits to primary care pediatrician, hospital emergency and re- hospitalization Time FrameUp to 3 months after discharge Safety IssueNo Secondary Outcome Measure: Use of Community Health Resources Measured Values Early Discharge Standard Discharge Number of Participants Analyzed9086 Use of Community Health Resources [units: Number] 4.4%10.5% Data are inconsistent: percentages of what.](http://images.slideplayer.com/16/5244269/slides/slide_82.jpg "Invalid entry: needs to be numerical (cannot include % ) BEFORE Revision (Public View) Implies number of health resources used – how was it measured .")
83
83 Measure TypePrimary Measure NameFrequency and Magnitude of Antibody Response Measure DescriptionNasal secretions to Virus A/12 and B/14. Antibody Response: Three-fold increase after immunization Time FrameVisit 3 (Week 15) Safety IssueYes Secondary Outcome Measure: Frequency and Magnitude of Antibody Response Measured Values Vaccine, Low Dose Vaccine, High Dose Number of Participants Analyzed3534 Frequency and Magnitude of Antibody Response [units: Participants] 1721 May mean “three-fold or greater increase” BEFORE Revision (Public View) Same unit cannot represent measures of “frequency” and “magnitude” “Participants” is not a unit of measure for “frequency” or “magnitude” Best to provide both categories for a dichotomous measure: < 3x increase ≥ 3x increase Best to provide both categories for a dichotomous measure: < 3x increase ≥ 3x increase
 Safety IssueYes Secondary Outcome Measure: Frequency and Magnitude of Antibody Response Measured Values Vaccine, Low Dose Vaccine, High Dose Number of Participants Analyzed3534 Frequency and Magnitude of Antibody Response [units: Participants] 1721 May mean three-fold or greater increase BEFORE Revision (Public View) Same unit cannot represent measures of frequency and magnitude Participants is not a unit of measure for frequency or magnitude Best to provide both categories for a dichotomous measure: < 3x increase ≥ 3x increase Best to provide both categories for a dichotomous measure: < 3x increase ≥ 3x increase.")
84
Measure TypePrimary Measure NameMaximum Tolerated Dose (MTD) Determination as Measured by Dose Limiting Toxicity (DLT) Measure DescriptionThe primary variable for determination of the MTD was the occurrence of DLT during the first treatment cycle. MTD has been exceeded if >=2 of 6 patients experience a DLT. Time FrameCycle 1 Safety IssueYes Primary Outcome Measure: Maximum Tolerated Dose (MTD) Determination … Measured Values Dose A.1 Dose A.2 Dose B.1 Dose B.2 Dose C.1 Dose C.2 Number of Participants Analyzed673674 Maximum Tolerated Dose (MTD)… [units: Participants] Number (#) of DLT130210 # Patients at dose level < MTD000074 # Patients at dose level = MTD603000 # Patients at dose level > MTD070600
 Determination … Measured Values Dose A.1 Dose A.2 Dose B.1 Dose B.2 Dose C.1 Dose C.2 Number of Participants Analyzed Maximum Tolerated Dose (MTD)… [units: Participants] Number (#) of DLT # Patients at dose level < MTD # Patients at dose level = MTD # Patients at dose level > MTD")
85
Tables Must Be Informative Scales should include: –Full name –Construct or domain (e.g., pain) –Direction of scores (Best/Worst Value) –Other information as necessary Measures Have Useful Descriptions Avoid Abbreviations
 –Direction of scores (Best/Worst Value) –Other information as necessary Measures Have Useful Descriptions Avoid Abbreviations")
86
86 Investigational Drug X GOG Performance Status [units: Score] 048 127 24 BEFORE Revision (Public View) Need information about this scale Full Name Construct/domain Range and directionality Baseline Measures Need information about these values (e.g., is “0” better or worse than “2”?) Need to change to “participants” – data represent “number of participants” with a particular score Are these the only possible scores?
![86 Investigational Drug X GOG Performance Status [units: Score] BEFORE Revision (Public View) Need information about this scale Full Name Construct/domain Range and directionality Baseline Measures Need information about these values (e.g., is 0 better or worse than 2 ) Need to change to participants – data represent number of participants with a particular score Are these the only possible scores](http://images.slideplayer.com/16/5244269/slides/slide_86.jpg "86 Investigational Drug X GOG Performance Status [units: Score] BEFORE Revision (Public View) Need information about this scale Full Name Construct/domain Range and directionality Baseline Measures Need information about these values (e.g., is 0 better or worse than 2 ) Need to change to participants – data represent number of participants with a particular score Are these the only possible scores")
87
Open Label Number of Participants Analyzed403 Duration (Days) [units: Days] Mean ± Standard Deviation 195.5 ± 43.87 Measure TypeSecondary Measure NameDuration (Days) Measure DescriptionExtent of Exposure for All Treated Subjects Time FrameDuration of Study Safety IssueNo Secondary Outcome Measure: Duration (Days) Measured Values BEFORE Revision (Public View) Needs description: Duration of what? Needs Arm Label: What is the intervention?
![Open Label Number of Participants Analyzed403 Duration (Days) [units: Days] Mean ± Standard Deviation ± Measure TypeSecondary Measure NameDuration (Days) Measure DescriptionExtent of Exposure for All Treated Subjects Time FrameDuration of Study Safety IssueNo Secondary Outcome Measure: Duration (Days) Measured Values BEFORE Revision (Public View) Needs description: Duration of what.](http://images.slideplayer.com/16/5244269/slides/slide_87.jpg "Needs Arm Label: What is the intervention .")
88
Measure Information Must be Precise and Accurate Avoid misuse of terms, e.g., –proportion –ratio –incidence State what is being measured and how –Do not provide results in measure description field

89
Drug XDrug YDrug X + Y Number of Participants Analyzed351361384 Proportion of Patients with Controlled SBP [units: Participants] 186135287 Measure TypePrimary Measure NameProportion of Patients with Controlled SBP Measure DescriptionControlled SBP defined as SBP < 130 mmHg Time FrameBaseline to 12 weeks Safety IssueNo Primary Outcome Measure: Proportion of Patients with Controlled SBP Spell out acronym Not a proportion BEFORE Revision (Public View) Not a proportion
![Drug XDrug YDrug X + Y Number of Participants Analyzed Proportion of Patients with Controlled SBP [units: Participants] Measure TypePrimary Measure NameProportion of Patients with Controlled SBP Measure DescriptionControlled SBP defined as SBP < 130 mmHg Time FrameBaseline to 12 weeks Safety IssueNo Primary Outcome Measure: Proportion of Patients with Controlled SBP Spell out acronym Not a proportion BEFORE Revision (Public View) Not a proportion](http://images.slideplayer.com/16/5244269/slides/slide_89.jpg "Drug XDrug YDrug X + Y Number of Participants Analyzed Proportion of Patients with Controlled SBP [units: Participants] Measure TypePrimary Measure NameProportion of Patients with Controlled SBP Measure DescriptionControlled SBP defined as SBP < 130 mmHg Time FrameBaseline to 12 weeks Safety IssueNo Primary Outcome Measure: Proportion of Patients with Controlled SBP Spell out acronym Not a proportion BEFORE Revision (Public View) Not a proportion")
90
Drug XDrug YDrug X + Y Number of Participants Analyzed351361384 Change in Sitting DBP From Baseline to End of Study [units: mmHg] Lease Squares Mean ± Standard Error -8.4 ± 0.2-6.7 ± 0.2-11.2 ± 0.3 Measure TypePrimary Measure NameChange in Sitting DBP From Baseline to End of Study Measure DescriptionChange in Sitting DBP Time FrameBaseline to 12 weeks Safety IssueNo Primary Outcome Measure: Change in Sitting DBP From Baseline to End of Study Spell out acronym Specify calculation details: which value was subtracted from which? BEFORE Revision (Public View)
![Drug XDrug YDrug X + Y Number of Participants Analyzed Change in Sitting DBP From Baseline to End of Study [units: mmHg] Lease Squares Mean ± Standard Error -8.4 ± ± ± 0.3 Measure TypePrimary Measure NameChange in Sitting DBP From Baseline to End of Study Measure DescriptionChange in Sitting DBP Time FrameBaseline to 12 weeks Safety IssueNo Primary Outcome Measure: Change in Sitting DBP From Baseline to End of Study Spell out acronym Specify calculation details: which value was subtracted from which.](http://images.slideplayer.com/16/5244269/slides/slide_90.jpg "BEFORE Revision (Public View).")
91
Measure TypeSecondary Measure NameTo Compare Drug X and Drug Y for Efficacy Measure Description Time Frame4 months Safety IssueNo Secondary Outcome Measure: To Compare Drug X and Drug Y for Efficacy State what is being measured, not the purpose BEFORE Revision (Public View) Needs description: what is being measured and how?
 Needs description: what is being measured and how")
92
Data in All Tables Must be Internally Consistent and Logical Participants must “flow” “Number analyzed” must be consistent with participant flow data Avoid Illogical Entries

93
93 PlaceboDrug X STARTED301299 COMPLETED291285 NOT COMPLETED1014 Participant Flow: First Period Number of participants STARTED in second period of Participant Flow needs to be the same as numbers COMPLETED in the first period BEFORE Revision (Public View) PlaceboDrug X STARTED298290 COMPLETED288278 NOT COMPLETED1012 Participant Flow: Second Period
 PlaceboDrug X STARTED COMPLETED NOT COMPLETED1012 Participant Flow: Second Period")
94
94 Measured Values Intervention XControl Number of Participants2827 Hours Per Day of Sleep [units: Average Hours per Day] Mean ± Standard Deviation 823 ± 92864 ± 106 Inconsistency between Units of Measure, “average hours per day,” and Measure Data: value provided is greater than the total number of hours in a day BEFORE Revision (Public View)
![94 Measured Values Intervention XControl Number of Participants2827 Hours Per Day of Sleep [units: Average Hours per Day] Mean ± Standard Deviation 823 ± ± 106 Inconsistency between Units of Measure, average hours per day, and Measure Data: value provided is greater than the total number of hours in a day BEFORE Revision (Public View)](http://images.slideplayer.com/16/5244269/slides/slide_94.jpg "94 Measured Values Intervention XControl Number of Participants2827 Hours Per Day of Sleep [units: Average Hours per Day] Mean ± Standard Deviation 823 ± ± 106 Inconsistency between Units of Measure, average hours per day, and Measure Data: value provided is greater than the total number of hours in a day BEFORE Revision (Public View)")
95
Statistical Analyses Must be Logical Compatible with Data Informative (report informative metrics)
")
96
96 GroupsEarly Discharge vs. Standard Discharge MethodANOVA P-Value0.05 Mean Difference (Net)9 Statistical Analysis 1 for Parental Stress Measured Values Early DischargeStandard Discharge Number of Participants100 Parental Stress [units: Points on a Likert Scale] Mean ± Standard Deviation 9.3 ± 1.27.8 ± 2.1 Inconsistency between Measure Data and Method of Estimation Reported Mean Difference: “9” By Inspection: 9.3 – 7.8 = 1.5 BEFORE Revision (Public View)
9 Statistical Analysis 1 for Parental Stress Measured Values Early DischargeStandard Discharge Number of Participants100 Parental Stress [units: Points on a Likert Scale] Mean ± Standard Deviation 9.3 ± ± 2.1 Inconsistency between Measure Data and Method of Estimation Reported Mean Difference: 9 By Inspection: 9.3 – 7.8 = 1.5 BEFORE Revision (Public View).")
97
97 PlaceboInvestigational Drug X Number of Participants148153 Time to Relapse of a Mood Episode [units: Days] Median (Inter-Quartile Range) 219 (83 to NA)NA (173 to NA) Measure TypeSecondary Measure NameTime to Relapse of a Mood Episode Measure Description Time Frame24 months Safety IssueNo Secondary Outcome Measure: Time to Relapse of a Mood Episode Measured Values Needs description Invalid entry BEFORE Revision (Public View)
![97 PlaceboInvestigational Drug X Number of Participants Time to Relapse of a Mood Episode [units: Days] Median (Inter-Quartile Range) 219 (83 to NA)NA (173 to NA) Measure TypeSecondary Measure NameTime to Relapse of a Mood Episode Measure Description Time Frame24 months Safety IssueNo Secondary Outcome Measure: Time to Relapse of a Mood Episode Measured Values Needs description Invalid entry BEFORE Revision (Public View)](http://images.slideplayer.com/16/5244269/slides/slide_97.jpg "97 PlaceboInvestigational Drug X Number of Participants Time to Relapse of a Mood Episode [units: Days] Median (Inter-Quartile Range) 219 (83 to NA)NA (173 to NA) Measure TypeSecondary Measure NameTime to Relapse of a Mood Episode Measure Description Time Frame24 months Safety IssueNo Secondary Outcome Measure: Time to Relapse of a Mood Episode Measured Values Needs description Invalid entry BEFORE Revision (Public View)")
98
98 Where is the Quality Line? Domains of Quality: Quality of Entries Scope of Entries Not Meaningful Meaningful Minimal Comprehensive QA Staff Resources

99
Who is the Audience? PI and Clinical Research Team (You!) Other Medical Researchers in same field [Study Sponsor] Other Medical Researchers in other fields Other Readers of the medical literature Science Writers Lay Public (readers of consumer health literature)
 Other Medical Researchers in same field [Study Sponsor] Other Medical Researchers in other fields Other Readers of the medical literature Science Writers Lay Public (readers of consumer health literature).")
100
Bottom Line Register within 21 days of enrollment: –Phase 2-4 interventional trials that include a drug, device or biologic –Regardless of whether or not the trial is being used to support an FDA application Report results: –Any trial described above within one year of “primary completion date” OR –once the drug, device or biologic has been approved; Keep all information up to date! 100

101
101 Additional Information Email LISTSERV and other FDAAA information: –http://prsinfo.clinicaltrials.gov/fdaaa.html Other general information: –http://prsinfo.clinicaltrials.gov Questions? –register@clinicaltrials.gov
102
102 Finding Results at ClinicalTrials.gov From Homepage –Go to “Search for Clinical Trials” –Select “Advanced Search” –Select “Studies with Results” from the menu for the Study Results field –Select study record from results list –Click “Study Results” tab

103
103

104
104 http://prsinfo.clinicaltrials.gov/fdaaa.html

105
105

106
106

107
107

Similar presentations


 vs. Clinicaltrials.gov>")


 NUMBER Clinical Trials Management Office December 17, 2014.>")