Download presentation
Presentation is loading. Please wait.

1
Results from the AVID Program in Chicago Jenny Nagaoka, Jonah Deutsch, Melissa Roderick, and Andy Brake January 29, 2008

2
Today Brief overview of findings on AVID in Chicago –Ninth grade course performance –Student and teacher survey responses How to read individual school reports How to use the information in your individual school reports

3
Are AVID students doing better than other students on 9 th grade outcomes? A preliminary analysis of 6 AVID schools in 2004-05

4
Summary of findings AVID shows positive effects on 9 th grade grades in math and English and weighted GPA. This cannot simply be explained by “creaming” within AVID schools or that AVID students systematically differ in other ways (i.e., coming from more supportive families) Some of the AVID effect seems to be linked to its practice of placing AVID students in honors courses
 Some of the AVID effect seems to be linked to its practice of placing AVID students in honors courses.")
5
2006-2007 AVID Survey Overview AVID student survey in April 2007 –9 th and 10 th graders –32 of 39 AVID Schools participated in the survey –2,890 of 3,752 AVID students surveyed (77% response rate) 2007 CCSR teacher survey (April) –28 AVID schools –Over 1,000 teachers surveyed Results provided to schools to highlight areas of success and points needing improvement in the AVID program across the district and within schools
 2007 CCSR teacher survey (April) –28 AVID schools –Over 1,000 teachers surveyed Results provided to schools to highlight areas of success and points needing improvement in the AVID program across the district and within schools")
6
AVID students are very positive about their experiences in the program

7
However, most AVID students do not report having in-depth conversations with their AVID teachers about postsecondary planning.

8
On all measures, students in schools in the “high” and “highest” categories are overwhelmingly positive about the impact that the program has had on them. 100% (81% in high category) report that they are a better writer. 83% (76% in high category) agree or strongly agree that their AVID teacher made a big difference in their life this year.
 report that they are a better writer. 83% (76% in high category) agree or strongly agree that their AVID teacher made a big difference in their life this year..")
9
Even students who attend schools in the “lowest” category are fairly positive about the program 70% agreed or strongly agreed that AVID gives them the support they need to be successful in high school. 79% agreed or strongly agreed that their AVID teacher had earned their respect.

10
Teachers in AVID schools are also positive about the program.

11
Organization of Report Four main areas: –Students’ and teachers’ evaluation of the AVID program –Skills learned through AVID –Relationships built with AVID teachers and tutors –Postsecondary planning in AVID Four groupings of results: –Results by school –Results by type of school (certified and new) –Results by type of students (gender, 7 th grade ITBS math score categories, and grade) –Results by type of students within schools
 –Results by type of students (gender, 7 th grade ITBS math score categories, and grade) –Results by type of students within schools")
12
Seven survey measures in four areas: 1. Students’ and teachers’ evaluation of the AVID program: –AVID Program Satisfaction (Student) – Students’ overall satisfaction with the AVID program, including skills learned and supports received. –AVID Program Impact (Teacher) – Teachers’ reports on the impact of the AVID program on their practice and on their students. 2. Skills learned through AVID: –AVID Skills – Students’ evaluation of whether AVID has taught them skills that impact their effectiveness as students in all their classes. 3. Relationships built through AVID: –AVID Teacher Support – Students’ perceptions of the amount of personal support they receive from their AVID teacher. –AVID Tutors – Students perceptions of the quality of guidance and academic and personal support they receive from their AVID tutors. 4. Postsecondary planning and preparation in AVID: –AVID Postsecondary Planning Discussions – Student reports of the extent their AVID teacher has discussed planning for students’ postsecondary education. –AVID Postsecondary Academic Planning & Preparation – Student reports of how often their AVID teacher has talked about the importance of course grades, course-taking, test preparation, and college planning for future success.
 – Students’ overall satisfaction with the AVID program, including skills learned and supports received. –AVID Program Impact (Teacher) – Teachers’ reports on the impact of the AVID program on their practice and on their students. 2. Skills learned through AVID: –AVID Skills – Students’ evaluation of whether AVID has taught them skills that impact their effectiveness as students in all their classes. 3. Relationships built through AVID: –AVID Teacher Support – Students’ perceptions of the amount of personal support they receive from their AVID teacher. –AVID Tutors – Students perceptions of the quality of guidance and academic and personal support they receive from their AVID tutors. 4. Postsecondary planning and preparation in AVID: –AVID Postsecondary Planning Discussions – Student reports of the extent their AVID teacher has discussed planning for students’ postsecondary education. –AVID Postsecondary Academic Planning & Preparation – Student reports of how often their AVID teacher has talked about the importance of course grades, course-taking, test preparation, and college planning for future success..")
13
Organization of Report Summary page of all measures: –School rating category –Summary rating across all measures On each measure: School-by-school means graph Table of survey question responses by school categories Table of school results by student type

15
Program Satisfaction (Student), Page 8
, Page 8")
16
Lowest 0.50 or lower Low 0.51 to 0.75 Average 0.76 to 1.24 High 1.25 to 1.49 Highest 1.50 or higher Your School 1.02 N of schools431555 N of students4627081,101327295150 How much do you agree with the following... % Agree and Strongly Agree to Each Question (% Strongly Agree) In AVID, I am learning the information I will need to go to college 71% (14%) 78% (20%) 88% (34%) 93% (49%) 97% (59%) 71% (10%) AVID gives me the support I need to be successful in high school 70% (12%) 78% (16%) 89% (28%) 93% (40%) 97% (46%) 67% (10%) I have become a better student since I enrolled in AVID 58% (10%) 60% (10%) 75% (18%) 83% (26%) 87% (36%) 60% (12%) I look forward to going to my AVID class each day 57% (10%) 65% (12%) 80% (19%) 81% (27%) 96% (44%) 59% (13%) I would recommend the AVID program to my friends 50% (11%) 62% (15%) 77% (25%) 82% (36%) 92% (47%) 50% (8%)
 In AVID, I am learning the information I will need to go to college 71% (14%) 78% (20%) 88% (34%) 93% (49%) 97% (59%) 71% (10%) AVID gives me the support I need to be successful in high school 70% (12%) 78% (16%) 89% (28%) 93% (40%) 97% (46%) 67% (10%) I have become a better student since I enrolled in AVID 58% (10%) 60% (10%) 75% (18%) 83% (26%) 87% (36%) 60% (12%) I look forward to going to my AVID class each day 57% (10%) 65% (12%) 80% (19%) 81% (27%) 96% (44%) 59% (13%) I would recommend the AVID program to my friends 50% (11%) 62% (15%) 77% (25%) 82% (36%) 92% (47%) 50% (8%).")
18
Program Satisfaction (Teacher), page 10 Lowest 0.50 or lower Low 0.51 to 0.75 Average 0.76 to 1.24 High 1.25 to 1.49 Highest 1.50 or higher N of schools46963 N of teachers9218535919767 How much do you agree with the following... % Agree and Strongly Agree to Each Question (% Strongly Agree) The AVID program supports my goals in the classroom. 70% (8%) 72% (11%) 88% (24%) 95% (36%) 95% (41%) AVID students are getting useful tools to improve their performance in class. 69% (7%) 73% (17%) 91% (29%) 95% (39%) 95% (47%) AVID has a positive effect on its students’ academic performance 65% (8%) 74% (17%) 88% (29%) 95% (41%) 96% (48%) I have implemented AVID strategies in my classroom. 56% (6%) 54% (11%) 67% (19%) 82% (28%) 95% (40%) I have a clear understanding of AVID strategies and classroom activities. 49% (7%) 59% (13%) 71% (23%) 80% (35%) 90% (38%) AVID has a positive effect on my instruction. 50% (2%) 57% (10%) 76% (20%) 84% (34%) 91% (36%) The AVID program is well run and implemented in our school. 47% (8%) 64% (10%) 85% (30%) 92% (41%) 95% (46%) AVID students are prepared to move into honors and AP courses. 42% (7%) 62% (10%) 70% (17%) 83% (28%) 80% (31%)
 The AVID program supports my goals in the classroom. 70% (8%) 72% (11%) 88% (24%) 95% (36%) 95% (41%) AVID students are getting useful tools to improve their performance in class. 69% (7%) 73% (17%) 91% (29%) 95% (39%) 95% (47%) AVID has a positive effect on its students’ academic performance 65% (8%) 74% (17%) 88% (29%) 95% (41%) 96% (48%) I have implemented AVID strategies in my classroom. 56% (6%) 54% (11%) 67% (19%) 82% (28%) 95% (40%) I have a clear understanding of AVID strategies and classroom activities. 49% (7%) 59% (13%) 71% (23%) 80% (35%) 90% (38%) AVID has a positive effect on my instruction. 50% (2%) 57% (10%) 76% (20%) 84% (34%) 91% (36%) The AVID program is well run and implemented in our school. 47% (8%) 64% (10%) 85% (30%) 92% (41%) 95% (46%) AVID students are prepared to move into honors and AP courses. 42% (7%) 62% (10%) 70% (17%) 83% (28%) 80% (31%).")
19
Skills, Page 12 Lowest 0.50 or lower Low 0.51 to 0.75 Average 0.76 to 1.24 High 1.25 to 1.49 Highest 1.50 or higher N of schools132152 N of students985131,86329095 How much do you agree with the following... % Agree and Strongly Agree to Each Question (% Strongly agree) Since I joined AVID: I am a better writer 87% (27%) 57% (11%) 71% (20%) 81% (31%) 100% (69%) I am more organized in school73% (9%) 69% (16%) 74% (19%) 87% (28%) 87% (32%) I ask better questions than I did before71% (17%) 56% (12%) 71% (19%) 86% (27%) 96% (50%) I feel more comfortable asking for help from adults 56% (8%) 60% (13%) 71% (16%) 78% (27%) 90% (30%) I speak up with my ideas in class more often42% (11%) 48% (10%) 64% (17%) 79% (25%) 83% (39%) I am more organized outside of school41% (2%) 49% (12%) 54% (12%) 60% (15%) 67% (20%)
 Since I joined AVID: I am a better writer 87% (27%) 57% (11%) 71% (20%) 81% (31%) 100% (69%) I am more organized in school73% (9%) 69% (16%) 74% (19%) 87% (28%) 87% (32%) I ask better questions than I did before71% (17%) 56% (12%) 71% (19%) 86% (27%) 96% (50%) I feel more comfortable asking for help from adults 56% (8%) 60% (13%) 71% (16%) 78% (27%) 90% (30%) I speak up with my ideas in class more often42% (11%) 48% (10%) 64% (17%) 79% (25%) 83% (39%) I am more organized outside of school41% (2%) 49% (12%) 54% (12%) 60% (15%) 67% (20%).")
20
Postsecondary Academic Planning and Preparation, page 20 Lowest 0.50 or lower Low 0.51 to 0.75 Average 0.76 to 1.24 High 1.25 to 1.49 Highest 1.50 or higher N of schools341555 N of students2058161,226302248 How much do you agree with the following...% of students saying that they have discussed the following with their AVID teacher either A little or A lot (% saying A lot) This year, has your AVID teacher: Encouraged you to do well in your classes 89% (47%) 94% (58%) 96% (68%) 100% (88%) 99% (90%) Helped you set goals for your grades88% (32%) 91% (33%) 94% (48%) 99% (75%) 99% (79%) Explained to you the importance of grades in preparing for college 87% (41%) 90% (53%) 96% (67%) 98% (81%) 99% (87%) Taught you how to make long-term goals for the future 85% (42%) 86% (39%) 93% (54%) 97% (72%) 98% (75%) Talked to you about honors or AP courses to take next year 52% (14%) 70% (27%) 86% (48%) 98% (69%) 97% (72%) Helped you prepare for standardized tests such as the PSAT, ACT, or SAT 42% (10%) 75% (29%) 75% (30%) 83% (40%) 91% (57%) Met with you one-on-one to discuss your college plans 27% (6%) 44% (15%) 49% (17%) 56% (24%) 73% (33%) Talked to your family members about college options 23% (6%) 34% (1%) 36% (14%) 46% (21%) 56% (25%)
 This year, has your AVID teacher: Encouraged you to do well in your classes 89% (47%) 94% (58%) 96% (68%) 100% (88%) 99% (90%) Helped you set goals for your grades88% (32%) 91% (33%) 94% (48%) 99% (75%) 99% (79%) Explained to you the importance of grades in preparing for college 87% (41%) 90% (53%) 96% (67%) 98% (81%) 99% (87%) Taught you how to make long-term goals for the future 85% (42%) 86% (39%) 93% (54%) 97% (72%) 98% (75%) Talked to you about honors or AP courses to take next year 52% (14%) 70% (27%) 86% (48%) 98% (69%) 97% (72%) Helped you prepare for standardized tests such as the PSAT, ACT, or SAT 42% (10%) 75% (29%) 75% (30%) 83% (40%) 91% (57%) Met with you one-on-one to discuss your college plans 27% (6%) 44% (15%) 49% (17%) 56% (24%) 73% (33%) Talked to your family members about college options 23% (6%) 34% (1%) 36% (14%) 46% (21%) 56% (25%)")
21
Each student was given a value based on how they responded to the items in a measure. –Measures are standardized to have a mean of 1 and standard deviation of 1 We grouped schools into categories based on their mean score: –Lowest: Schools that were at least half a standard deviation below the mean (0.50 or below) –Low: Schools that were between one quarter and one half standard deviation below the mean (0.50 to 0.75) –Average: Schools that were between one quarter standard deviation below or above the mean (0.75 to 1.25) –High: Schools that were between one quarter and one half standard deviation above the mean (1.25 to 1.50) –Highest: Schools that were at least one half standard deviation above the mean (1.50 or higher) Rating AVID Schools
 –Low: Schools that were between one quarter and one half standard deviation below the mean (0.50 to 0.75) –Average: Schools that were between one quarter standard deviation below or above the mean (0.75 to 1.25) –High: Schools that were between one quarter and one half standard deviation above the mean (1.25 to 1.50) –Highest: Schools that were at least one half standard deviation above the mean (1.50 or higher) Rating AVID Schools.")
22
Over a third of the schools had average scores that placed them in the “high” or “highest” categories Categories based on schools’ overall score Number of schools

23
Page 6

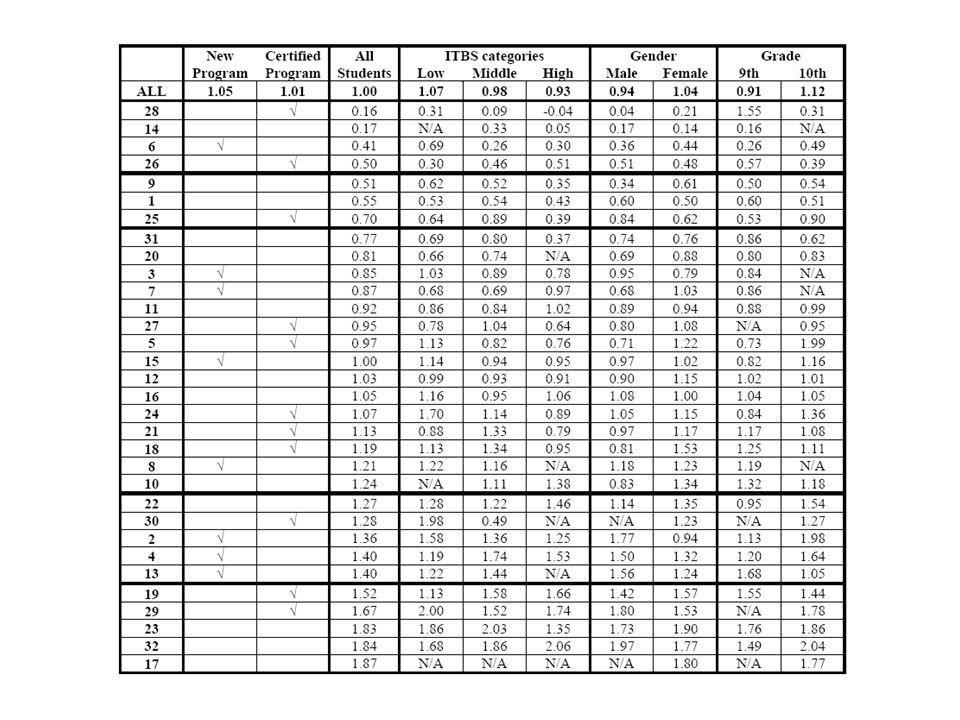
24
Comparing AVID outcomes by type of student, page 7 Overall N=120 ITBS categoriesGenderGrade Your school System Average Low N=18 Middle N=54 High N=23 Male N=43 Female N=48 9 th N=64 10 th N=67 Program Satisfaction 1.00 0.30 1.07 0.46 0.98 0.51 0.93 0.51 0.94 0.48 1.04 0.57 0.91 0.39 1.12 Skills 0.44 1.00 1.11 0.78 0.99 0.79 0.89 0.77 0.87 0.86 1.08 0.91 0.95 0.68 1.05 Teacher Support 0.66 1.00 0.70 1.08 0.38 0.94 0.76 1.00 0.45 0.90 0.8 1.07 0.58 0.98 0.39 1.03 Tutors 0.99 1.00 0.71 1.11 0.46 0.99 0.57 0.89 0.68 1.00 0.8 1.00 0.91 0.99 1.02 Postsecondary Discussions 0.78 1.00 0.86 1.05 0.70 0.98 0.80 0.95 0. 89 0.96 0.75 1.02 0.74 0.85 0.76 1.20 Postsecondary Preparation 1.10 1.00 0.95 1.06 0.95 0.99 0.72 0.94 0.91 0.97 0.80 1.03 0.77 0.91 0.88 1.14

25
Additional copies of this report Go to the Consortium’s website: ccsr.uchicago.edu/AVID ccsr.uchicago.edu/AVID Your user name and password are in your AVID report. Release forms are in your packet.

Similar presentations


 2 years of natural.>")

>")


. Students at-risk for leaving high school before graduation. Lack of attachment to school Special educational needs.>")


