Download presentation
Presentation is loading. Please wait.

1
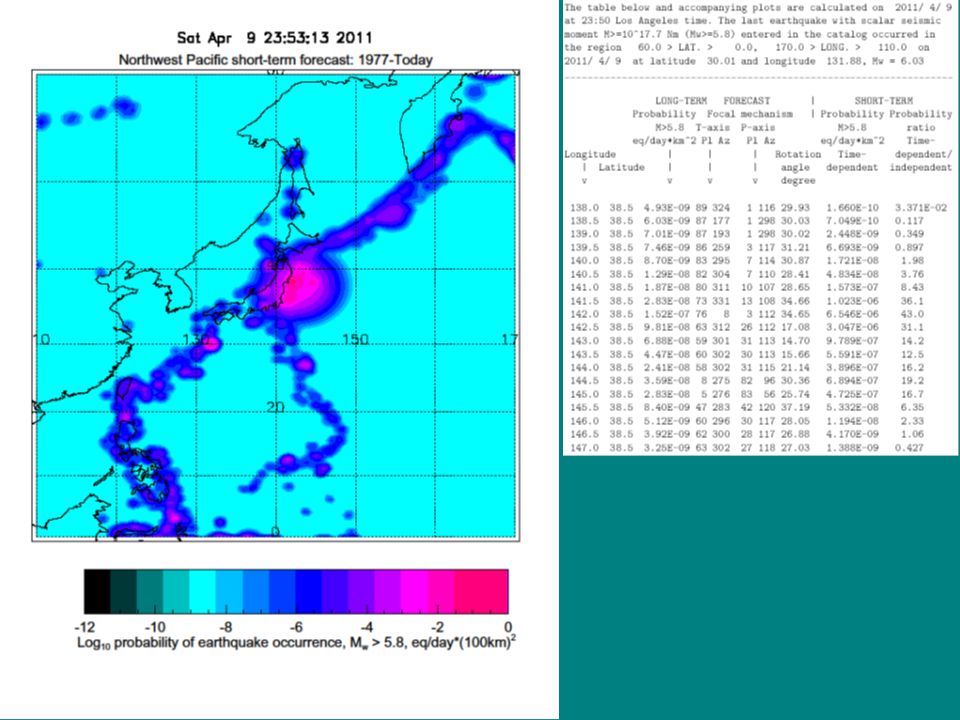
Yan Y. Kagan Dept. Earth and Space Sciences, UCLA, Los Angeles, CA 90095-1567, ykagan@ucla.edu, http://eq.ess.ucla.edu/~kagan.htmlykagan@ucla.edu Forecast application example: Japan, Tohoku earthquake http://moho.ess.ucla.edu/~kagan/Oxnard.ppt

2
Tohoku M9 earthquake and tsunami http://eq.ess.ucla.edu/~kagan/japan_2011_eq_index.html

3
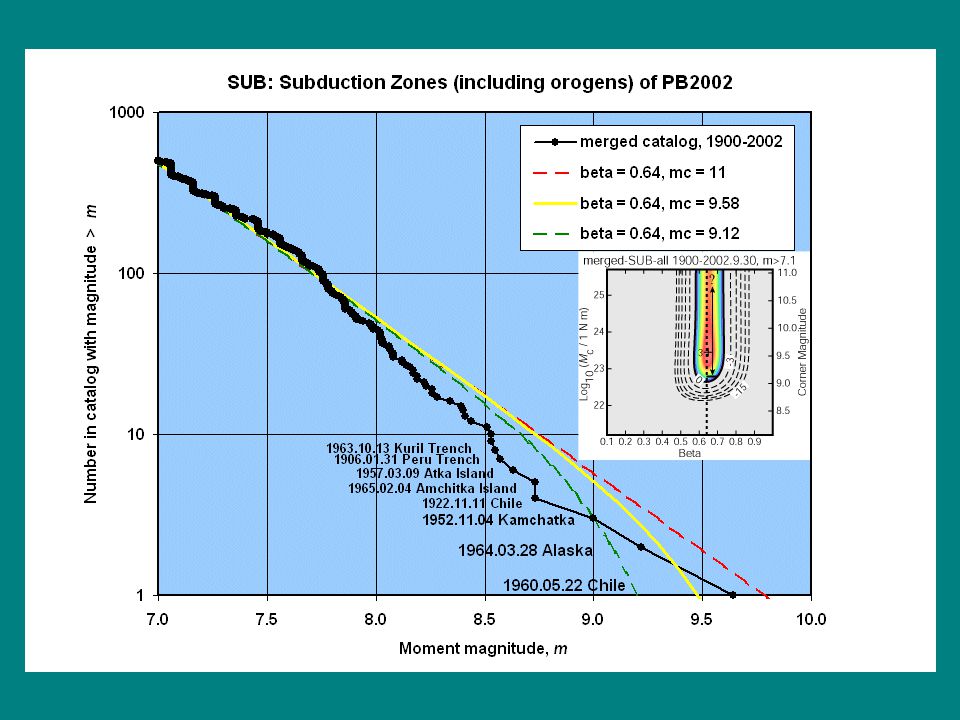
Advantages of this distribution: Simple (only one more parameter than G-R); Has a finite integrated moment (unlike G-R) for < 1; Fits global subcatalogs slightly better than the gamma distribution.
; Has a finite integrated moment (unlike G-R) for < 1; Fits global subcatalogs slightly better than the gamma distribution.")
4
Kagan, Seismic moment-frequency relation for shallow earthquakes: Regional comparison, J. Geophys. Res., 102, 2835-2852 (1997).
..")
8
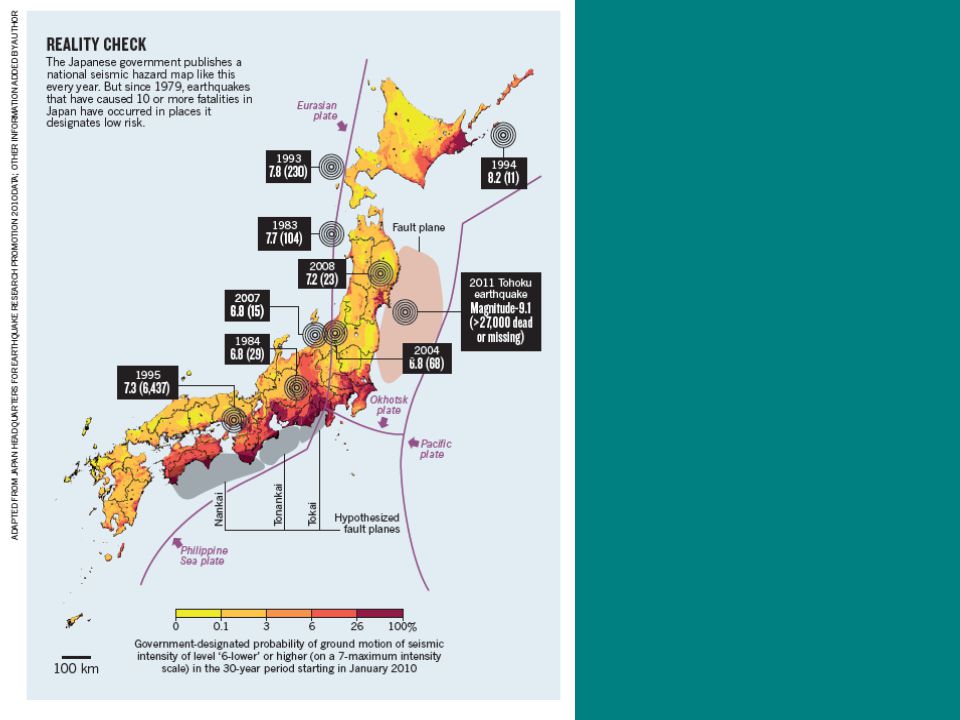
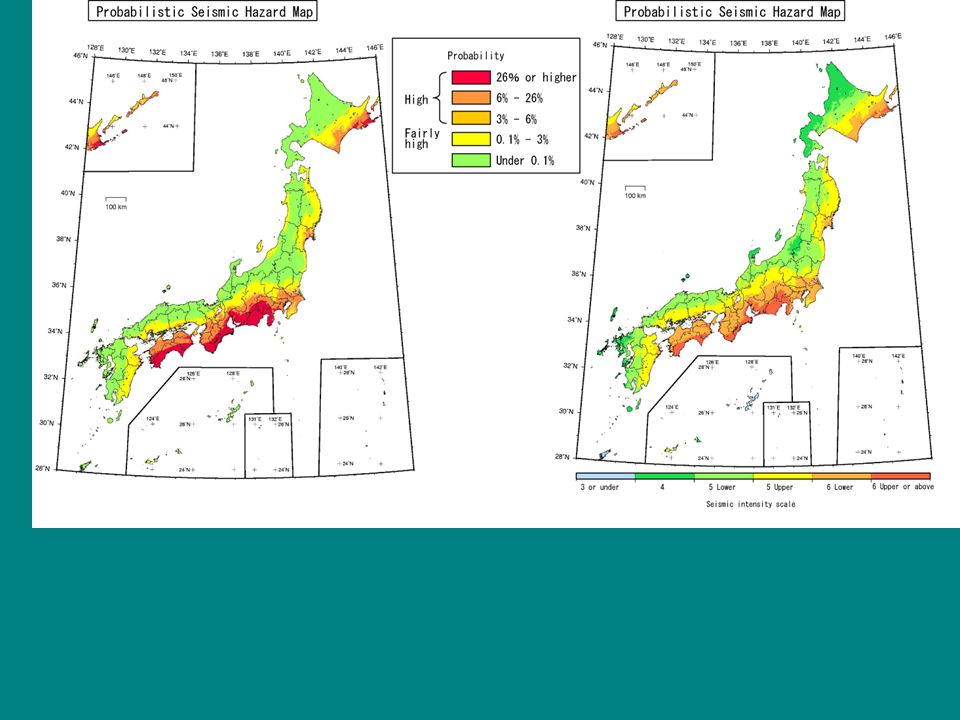
National seismic hazard maps for Japan (2009)
")
14
END Thank you

16
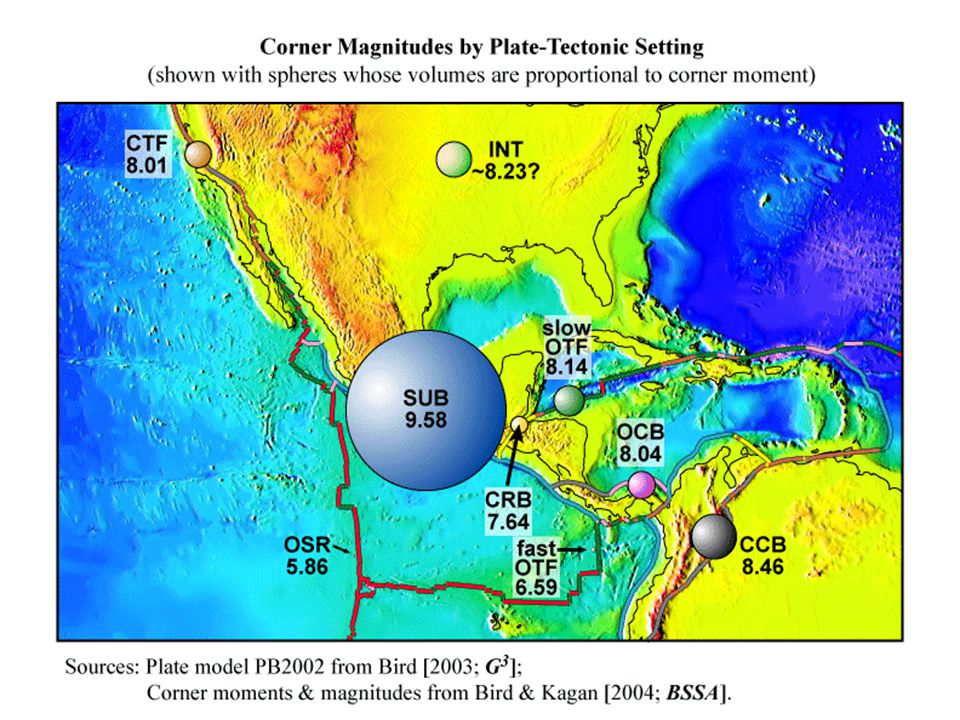
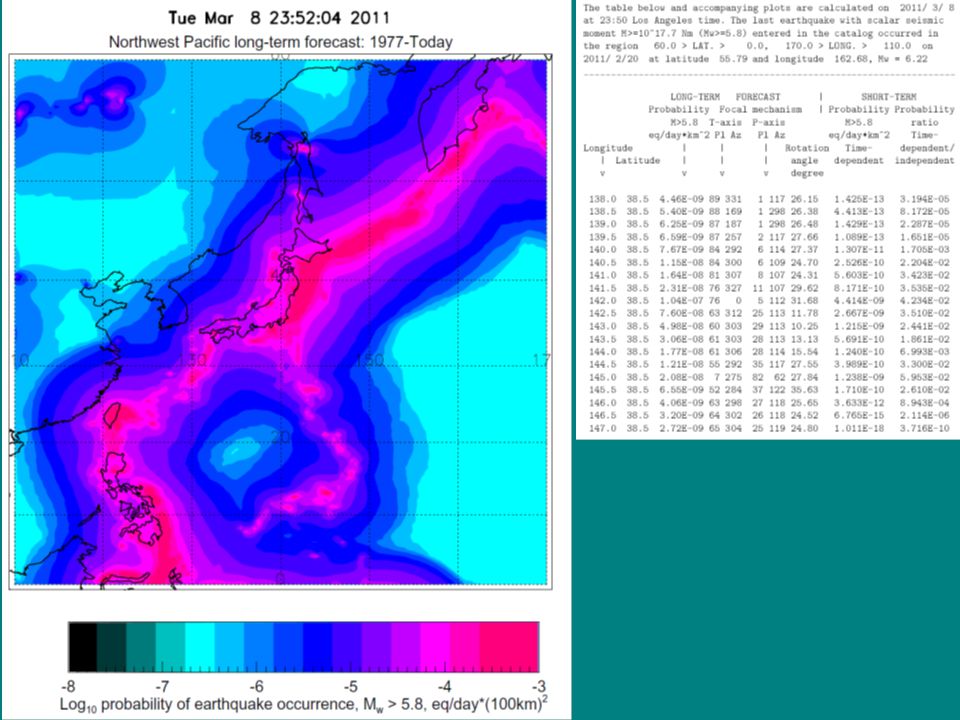
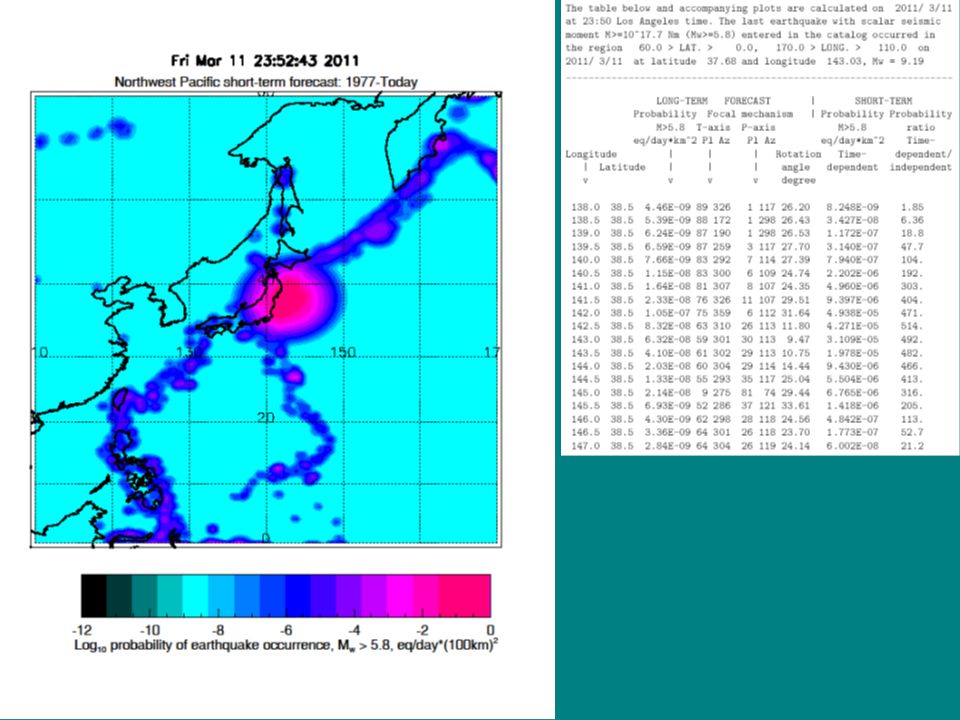
In the GCMT catalog, the number of earthquakes with M>=5.8 in a spherical rectangle 35-40N, 140- 146E, covering the rupture area of the Tohoku event, is 108 for years 1977-2010. If we assume that the corner magnitude is well above M9.0 (like M9.6 for subduction zones, see Bird and Kagan, BSSA, 94(6), 2380-2399, 2004), this would mean that the repeat time for the M9 and larger event in this rectangle is about 370 years.
, , 2004), this would mean that the repeat time for the M9 and larger event in this rectangle is about 370 years..")
17
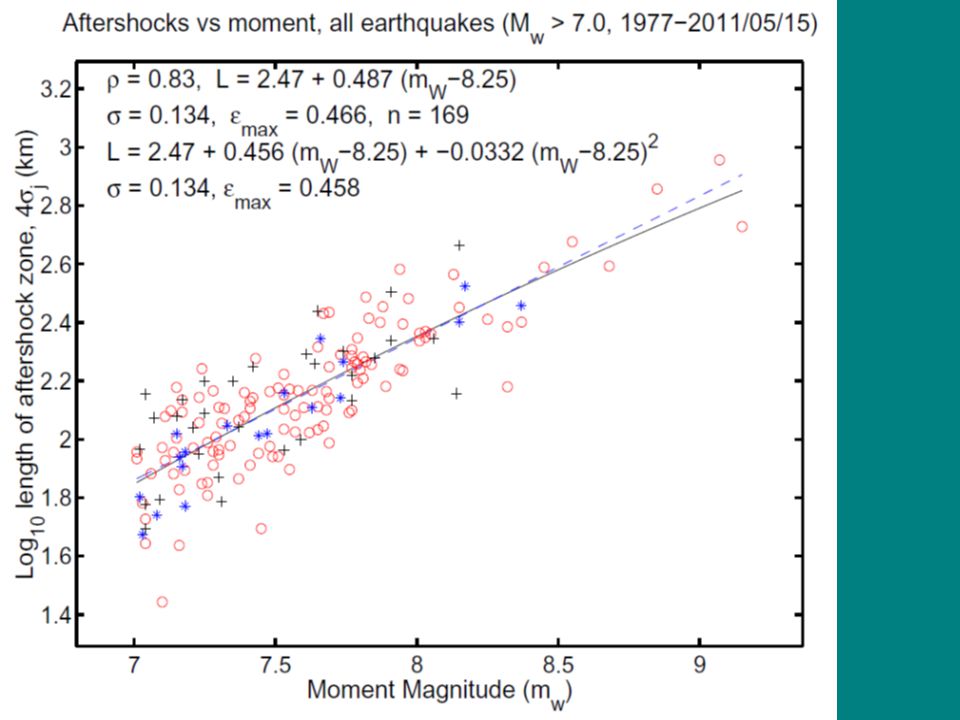
Elementary computation for earthquake rate Plate convergence rate at northern Honshu island is about 9 cm/year (Kanamori, Nature, 2011). If we assume that M9.25 earthquake has an average slip 25 m, this means, that (presuming all slip is by M9.25 quakes) their recurrence time should be about 280 years (McCaffrey, 2008). If we assume that the largest event is only M8.25, then they should repeat every 28 years! Changing the coupling coefficient to 50% would not resolve the paradox of the moment conservation principle: how to explain earthquake rate with the maximum event size less than M8?
 their recurrence time should be about 280 years (McCaffrey, 2008). If we assume that the largest event is only M8.25, then they should repeat every 28 years. Changing the coupling coefficient to 50% would not resolve the paradox of the moment conservation principle: how to explain earthquake rate with the maximum event size less than M8 .")
20
Table of earthquake pairs, M>=7.5

21
Tohoku M9 earthquake and tsunami http://eq.ess.ucla.edu/~kagan/japan_2011_eq_index.html

22
Kagan, JGR, 102, 2835 - 2852 (1997). Plot #12 is Flinn-Engdahl’s #19, Japan-Kamchatka, Mmax = 8.62+/-0.28

Similar presentations


 earthquake near Sendai, east coast of Honshu, Japan Friday, March 11, 2011 at 05:46:23 UTC Japan was struck by a magnitude 8.9 (9.0)>")


 Yan Y. Kagan Department of Earth and Space Sciences, University of.>")


