Download presentation
Presentation is loading. Please wait.

2
Age and Sex of Population Income Education Performance of Criminal Justice System

3
Age and Sex of Population No significant changes over time Increases/Decreases in crime not mirrored by changes in young male population Ratio of males to females similar to rest of California

4
Income Low but not lowest

5
Education Low but not poorest level in Central Valley

6
Violent Offenses Automobile Thefts Gang Activity

7
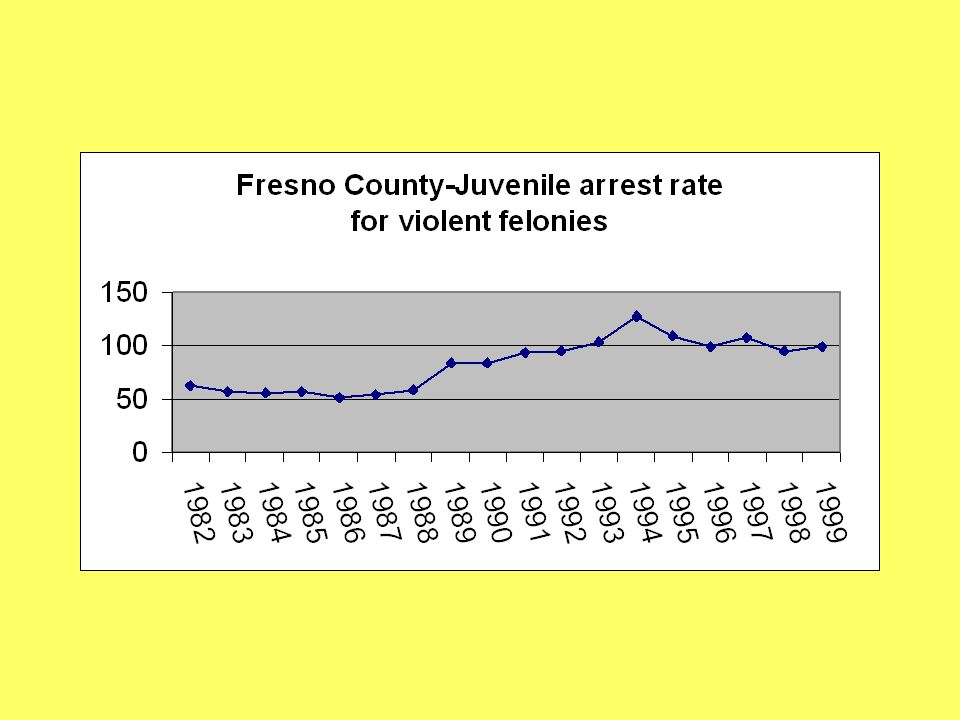
Violent Offenses

12
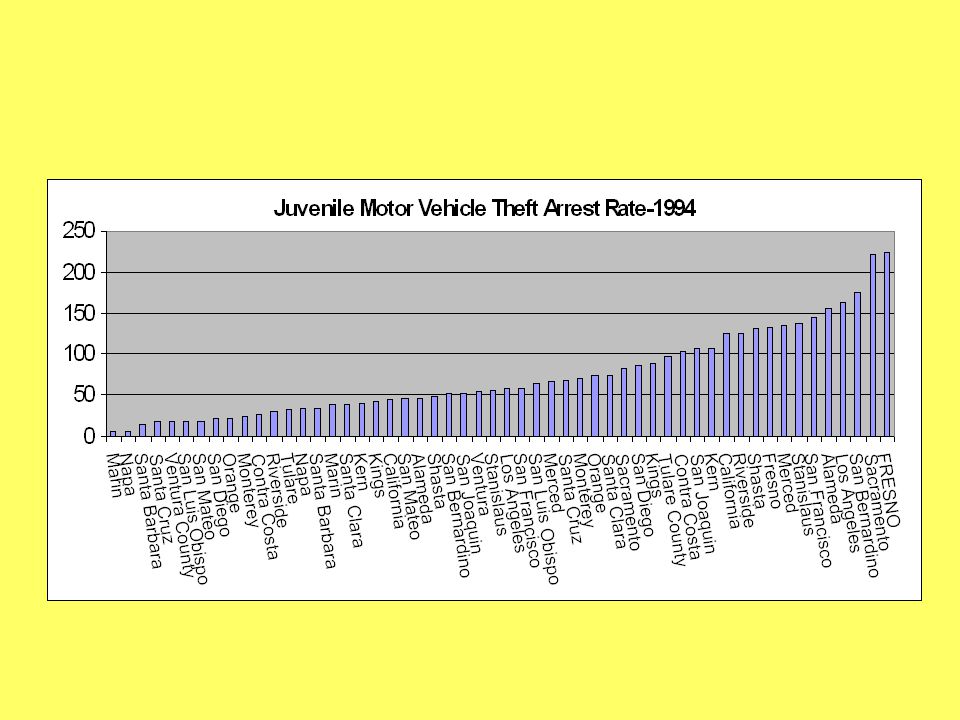
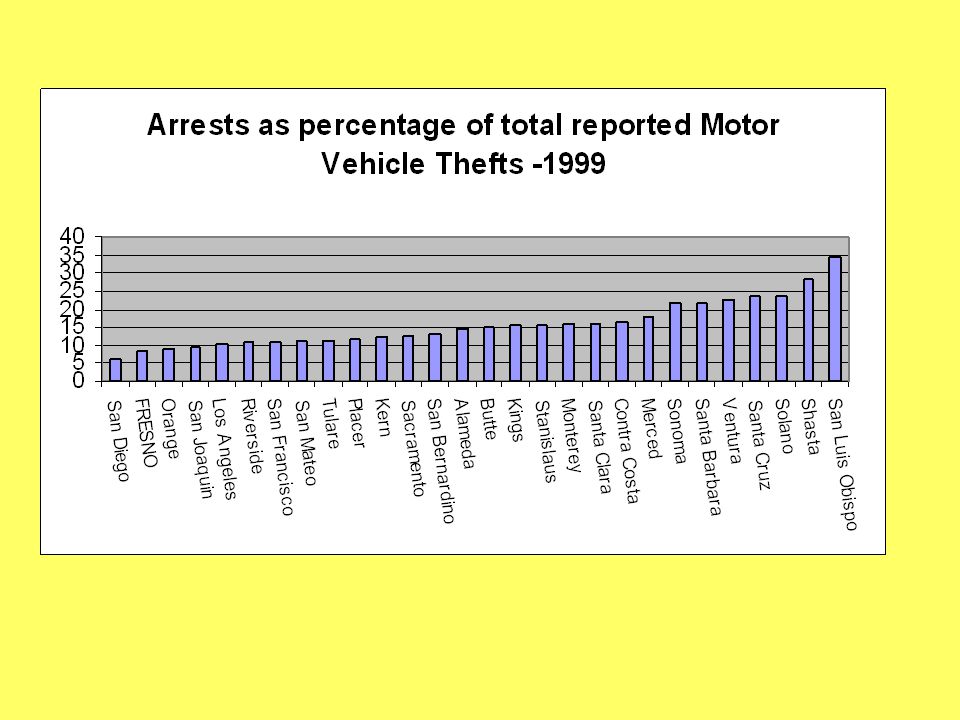
Automobile Thefts

13
Gang Activity

14
Law Enforcement Courts Corrections

22
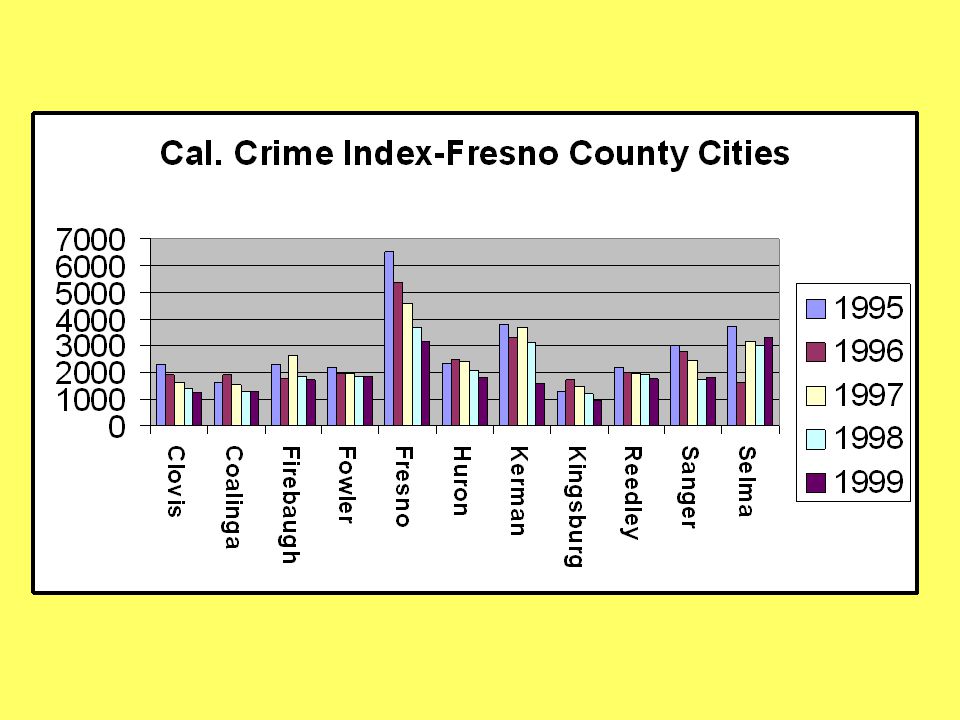
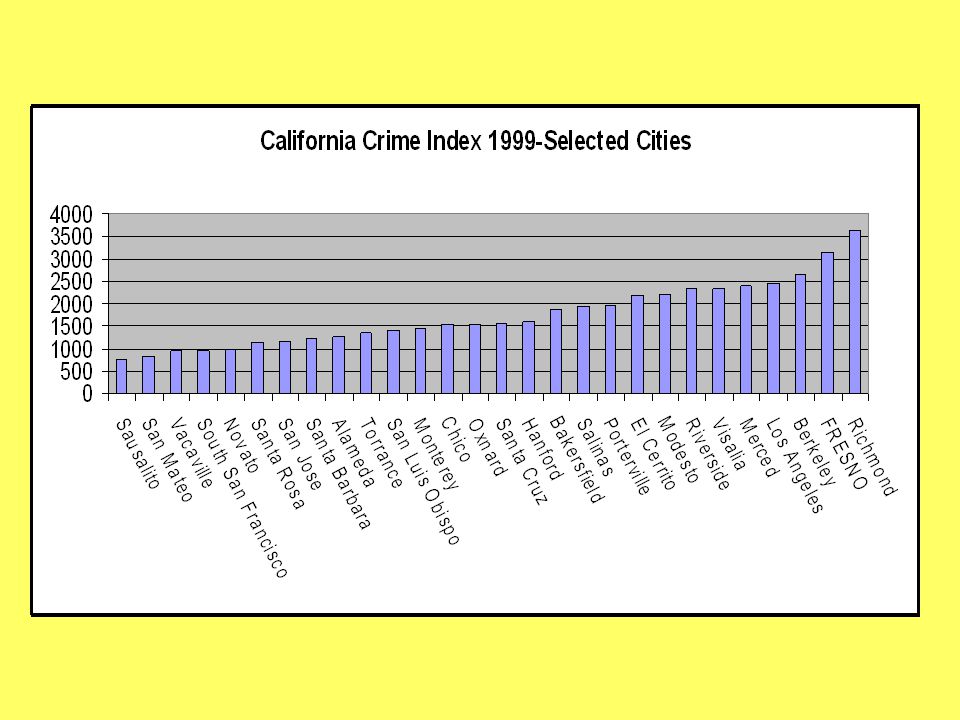
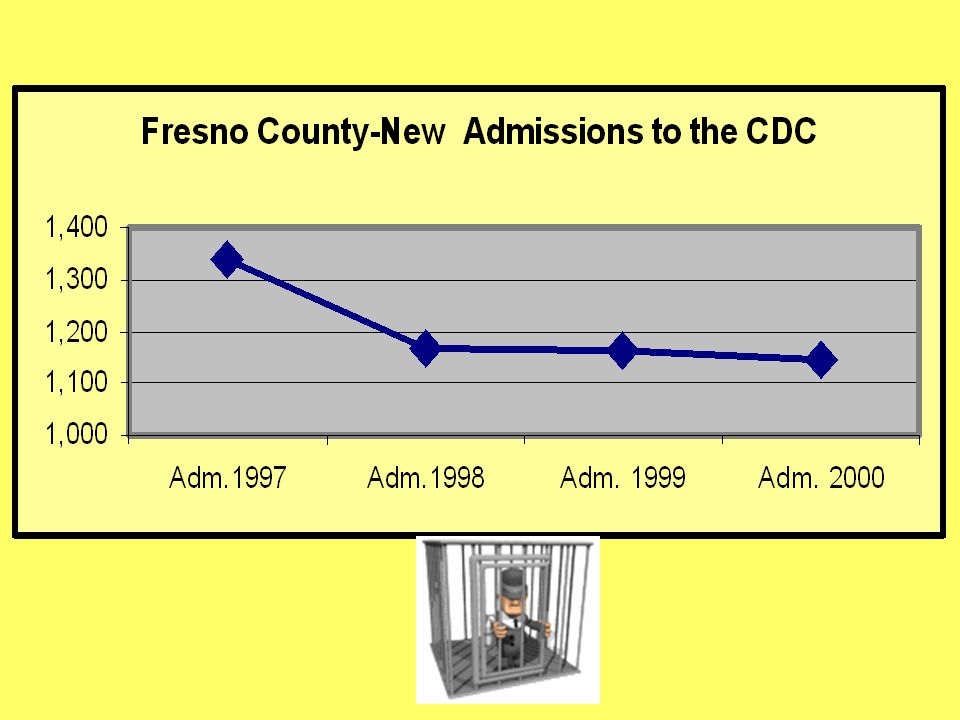
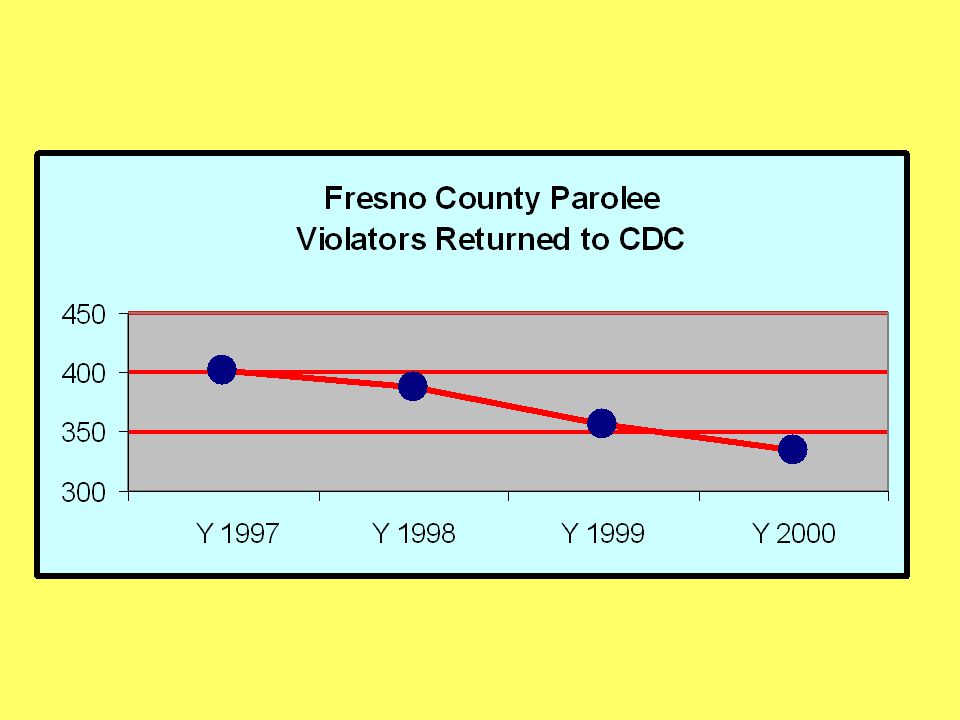
Central Valley counties surrounding Fresno county have similar demographics but a consistently lower California Index Crime rates compared to Fresno County. What is notable about the differences, however, is that the rate of California Index crimes for Fresno County had the steepest decline of any central valley county. A review of crime rates from 1990-1999, shows Fresno County with a 54% decline in Index Crimes from the highest rate in 1992. Much smaller Madera County experienced a decline of 52% in 1999, compared to its highest year of 1995, and in Stanislaus County, the county with the next highest drop in Index Crimes, the 1999 data shows a difference of 34% compared to its highest year of 1993. Fresno County Index Crimes dropped every subsequent year beginning with1992 and ending in 1999. There were no significant demographic changes in Fresno County during the time period when compared to other central valley counties. The disproportionate differences in the drop of crime rates in Fresno County may be associated with criminal justice activity, including personnel increases in the City of Fresno Police Department, the city with the highest crime rates in the county, and the creation of special units to address gang activity, auto theft and related offenses.

28
199019911992199319941995199619971998 Sacramento20.819.318.818.717.920.711.44.616.6 Tulare11.39.97.76.25.94.23.85.25.1 Contra Costa15.414.112.210.59.78.510.399.9 Los Angeles10.810.910.810.711.511.29.39.49.6 San Diego11.410.710.89.410.2109.39.79.8 Monterey15.716.314.312.21512.11110.110.2 Orange11.511108.17.86.98.511.711.4 Kern11.59.810.59.710.710.313.513.414.7 San Joaquin15.915.313.911.713.31817.315.916.2 Stanislaus21.21917.615.816.613.810.716.818.4 Kings1713.716.513.116.719.114.519.224.9 Merced9.49.28.69.911.115.620.322.219.4 San Francisco12.513.116.415.716.522.22528.524.1 FRESNO 23.121.921.519.530.229.525.831.930.1 Case Dismissals

30
19 February 2003- 159,695 of which 18,632 are INS Holds

35
More probation/parole officers Target hardening efforts-reduce opportunities for crime More Creative Approaches to dealing with Motor Vehicle Theft Greater efforts aimed at gangs and weapons related offenses.

36
Reducing FTAs (LAO) Reducing Early Releases from Jail (LAO)
 Reducing Early Releases from Jail (LAO)")
Similar presentations