Download presentation
Presentation is loading. Please wait.

2
Myrtaceae Proteaceae Fabaceae Rutaceae Other Henery & Westoby 2001 seed output (number) per m 2 per yr
 per m 2 per yr")
4
Acmena Syzygium Osbornia Backhousia Eugenia Metrosideros Tristania Darwinia Angophora Corymbia Eucalyptus Melaleuca Syncarpia Lophostemon Xanthostemon Qualea (outgroup)
")
8
rapid height extension allocation to spread rather than height

13
Saverimuttu & Westoby 1996

14
Armstrong & Westoby 93

15
earlier divergence later divergences

17
Ackerly and Donoghue 1996

19
set up a new worksheet rows are divergences (nodes), not species cells are calculated as differences (=(C2-C3) from other worksheet) usually can “fill right” to enter formula for other variables
, not species cells are calculated as differences (=(C2-C3) from other worksheet) usually can fill right to enter formula for other variables")
20
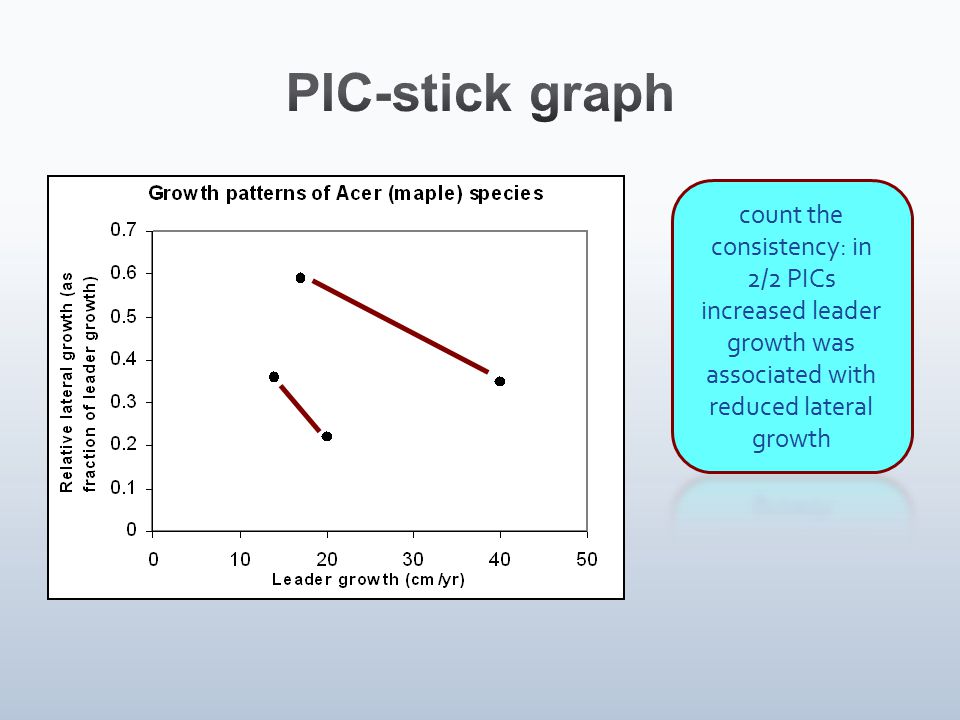
divergence in terminal extension per yr divergence in relative lateral growth +ve -ve

21
divergence in terminal extension per yr divergence in relative lateral growth +ve -ve

22
1. earlier divergence where faster leader growth was positively associated with wider spread 2. earlier divergence could also have been here 3. later divergences where faster leader growth was associated with narrower spread

23
+, + -,- -, + +, - Divgnce in A Divgnce in B

24
Divgnce in A Divgnce in B

25
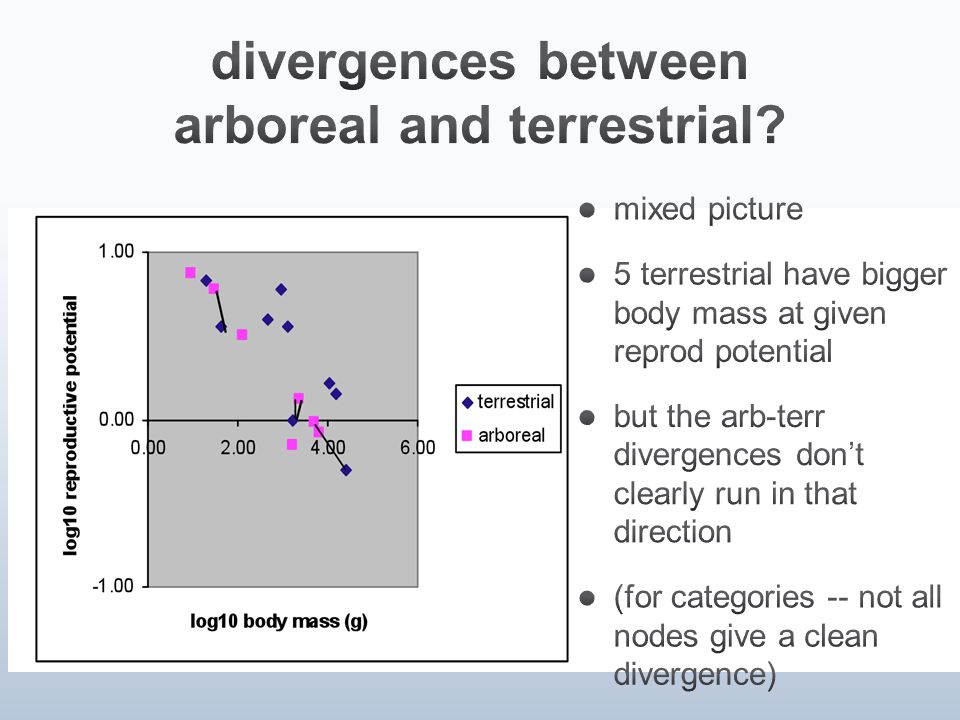
adult female body mass (g) litter size days between litters reproductive potential yr-1 log10 adult female body mass log10 reproductive potential diet (1=mainly foliage, 2= mainly animals, nectar, or fruit) 1=arboreal, 2=terrestrial DasyuridaeAntechinus stuartii206.83656.801.300.8322 DasyuridaeDasyurus viverrinus88063656.002.940.7822 MyrmecobiidaeMyrmecobius fasciatus45943654.002.660.6022 PhascolarctidaePhascolarctos cinereus510013830.953.71-0.0211 VombatidaeVombatus ursinus2600017300.504.41-0.3012 PotoroidaeBettongia penicillata130011023.583.110.5522 MacropodidaeDendrolagus lumholtzii647514350.843.81-0.0811 MacropodidaeMacropus agilis1100012201.664.040.2212 MacropodidaeMacropus robustus1560012561.434.190.1512 PhalangeridaeWyulda squamicaudata167513651.003.220.0012 PhalangeridaeTrichosurus vulpecula230012741.333.360.1211 BurramyidaeBurramys parvus423.63653.601.620.5622 BurramyidaeCercartetus caudatus3031835.981.480.7821 PseudocheiridaePetauroides volans170015210.703.23-0.1511 Petauridae Gymnobelideus leadbeateri1331.61833.192.120.5021 TarsipedidaeTarsipes rostratus92.51227.480.950.8721
 litter size days between litters reproductive potential yr-1 log10 adult female body mass log10 reproductive potential diet (1=mainly foliage, 2= mainly animals, nectar, or fruit) 1=arboreal, 2=terrestrial DasyuridaeAntechinus stuartii DasyuridaeDasyurus viverrinus MyrmecobiidaeMyrmecobius fasciatus PhascolarctidaePhascolarctos cinereus VombatidaeVombatus ursinus PotoroidaeBettongia penicillata MacropodidaeDendrolagus lumholtzii MacropodidaeMacropus agilis MacropodidaeMacropus robustus PhalangeridaeWyulda squamicaudata PhalangeridaeTrichosurus vulpecula BurramyidaeBurramys parvus BurramyidaeCercartetus caudatus PseudocheiridaePetauroides volans Petauridae Gymnobelideus leadbeateri TarsipedidaeTarsipes rostratus")
33
Ackerly 1999 Evol divgnce weaker than cross-spp Evol divgnce similar to cross-spp Evol divgnce stronger than cross-spp Cross- species graphs

34
Ackerly & Reich 1999 +, + -, -

38
Trait A Trait B

40
Ackerly & Donoghue 1996

41
Evol divergence correlation 1.00.0 -0.5 0.0 0.5 1.0 0.5 -0.5 Cross-species correlation Usually, trait-pairs are correlated both as evolutionary divergences and cross-species. But this is worth investigating in each case, because it’s interesting where one but not the other is significant Ackerly 1999

42
Evol divgnce weaker than cross-spp Evol divgnce similar to cross-spp Evol divgnce stronger than cross-spp Cross- species graphs

43
Ackerly 1999 Evol divgnce weaker than cross-spp Evol divgnce similar to cross-spp Evol divgnce stronger than cross-spp signifies the cross-species correlation has been produced by one or a few divergences, deep in the phylogenetic tree

44
Ackerly 1999 Evol divgnce weaker than cross-spp Evol divgnce similar to cross-spp Evol divgnce stronger than cross-spp signifies consistent divergence pattern between closely-related species but tends to be overridden by other large differences when comparing between genera or families

54
? ?

55
? ?

62
data originally from Foster SA, Janson CH (1985) The relationship between seed size and establishment conditions in tropical woody plants. Ecology 66:773-780; phylogenetic reanalysis by Kelly CK, Purvis A (1993) Seed size and establishment conditions in tropical trees. Oecologia 94:356-360
 Seed size and establishment conditions in tropical trees. Oecologia 94:")
65
SpeciesBody mass (g) Pad area (mm2) Clinging ability (newtons) Anolis sagrei4.4211.3 Anolis grahami6.9362.5 Anolis leachi18.1614.9 Hemidactylus frenatus3251 Hemidactylus turcicus2.1220.8 Gehyra oceanica7.9694.7 Gehyra mutilata1.7180.8 Gekko gecko43.422720.1 Lipinia leptosoma1.39.10.2 Prasinohaema virens3.1190.4 Prasinohaema prehensicauda7.1210.2 Prasinohaema flavipes23.9530.8
 Pad area (mm2) Clinging ability (newtons) Anolis sagrei Anolis grahami Anolis leachi Hemidactylus frenatus3251 Hemidactylus turcicus Gehyra oceanica Gehyra mutilata Gekko gecko Lipinia leptosoma Prasinohaema virens Prasinohaema prehensicauda Prasinohaema flavipes")
72
geckos vs skinks anolids vs others

77
amount of divergence is the same, but rate is much slower

78
difference is in time since divergence, not time needed for divergence

81
20 divergences making largest contribution to variation across present day spp NB: tree not time-scaled 20 widest divergences Moles et al (2005) A brief history of seed size
 A brief history of seed size")
82
Arecaceae Zingiberales Commelinales Poales Provisional molec date ~95 Ma (Wikstrom et al 2001)
")
87
value of trait A because extreme species are more likely to be chosen

Similar presentations


 Seed volume (mm3) Dispersal (Unassisted (0), animal (1) Habit (vine=1, other=2) Abrusprecatorius1.4113.111 Acetosasagittata35.06.801.>")
.>")


.>")


 A. Patterns of survival and reproduction B. Age distributions C. Calculating rates of population change a.>")
What makes a species invasive?. An observation: “Tens Rule” From Williamson & Fitter (1996) Ecology 77:1661-1666.>")
 A. Life history traits B. Tradeoffs in resource allocation C. Life history strategies A. Life History.>")
 than large populations.>")


 Bivariate Association for Tabular Data: Basic Concepts.>")

 sigmoid growth curve ( organism and population )>")


