Download presentation
Presentation is loading. Please wait.

1
Modeling approach to regional flux inversions at WLEF Modeling approach to regional flux inversions at WLEF Marek Uliasz Department of Atmospheric Science Colorado State University Who needs data? or

2
CSU RAMS LPD model influence functions for concentration for vertical flux Bayesian inversion modeling framework

3
influence function for concentration measurements C * concentration sample

4
surface fluxes influence function for concentration measurements C * concentration sample

5
surface fluxes initial concentration influence function for concentration measurements C * concentration sample

6
surface fluxes initial concentration inflow fluxes influence function for concentration measurements C * concentration sample

7
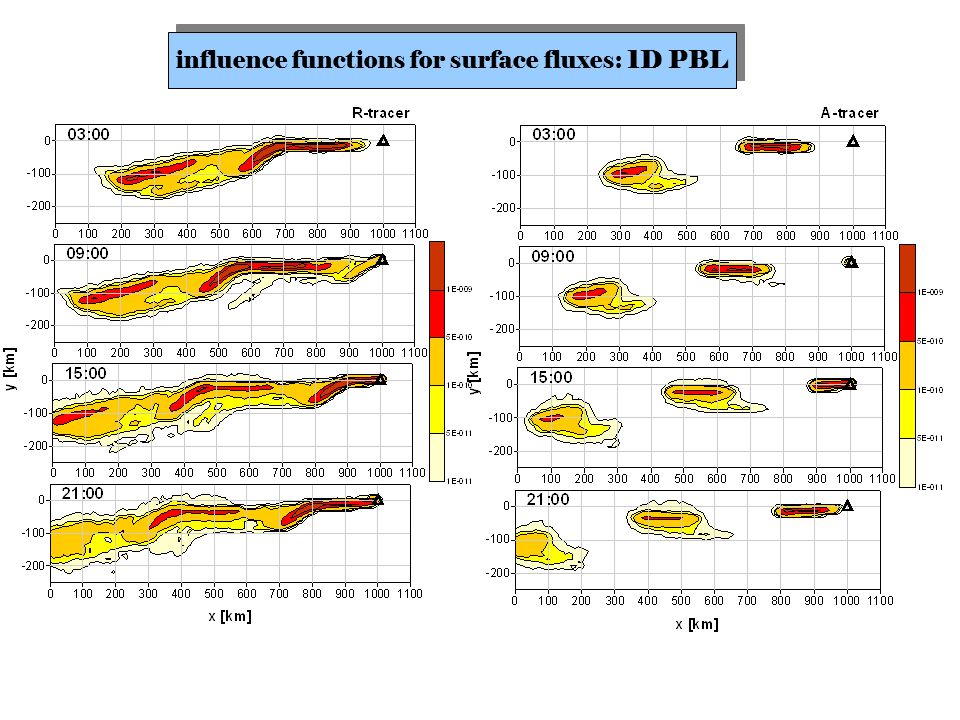
influence functions for surface fluxes: 1D PBL

9
WLEF tower – July 1997 influence function for passive tracer

10
influence functions for inflow fluxes: 1D PBL 30m sample1100m sample

11
NEE constrains used in inversion calculations: NEE=R+A R=R 0 A=A 0 c veg RAD/(RAD+200) R 0,A 0 – unknown parameters to be estimated RAD, c veg – from RAMS
 R 0,A 0 – unknown parameters to be estimated RAD, c veg – from RAMS")
12
CWCW 1000 km x z D q samples DDD q0q0

13
Two-Tower Inversions R is very well estimated A isn’t bad NEE very hard to estimate with unknown inflow Best estimates when towers are spaced optimally w.r.t. travel time (daytime)
.")
14
Climatology of influence functions for August 2000 influence functions derived from RAMS/LPD model simulations passive tracer different configurations of concentration samples - time series from - a single level of WLEF tower - all levels of WLEF tower - WLEF tower + six 76m towers

15
Regional inversions reduction of uncertainty in flux estimation pseudo-data generation and ensemble inversion

16
Configuration of source areas with WLEF tower in the center of polar coordinates Example of estimation of NEE averaged for August 2000 Bayesian inversion technique using influence function derived from CSU RAMS and Lagrangian particle model flux estimation for source areas in polar coordinates within 400 km from WLEF tower (better coverage by atmospheric transport) NEE decomposed into respiration and assimilation fluxes: R=R 0, A=A 0 f(short wave radiation, vegetation class) inversion calculations for increasing number of concentration data (time series from towers) NEE uncertainty presented in terms of standard deviation derived from posteriori covariance matrix inflow CO 2 flux is assumed to be known from a large scale transport model in further work, concentration data from additional tower will be used to improve the inflow flux given by a large scale model
 NEE decomposed into respiration and assimilation fluxes: R=R 0, A=A 0 f(short wave radiation, vegetation class) inversion calculations for increasing number of concentration data (time series from towers) NEE uncertainty presented in terms of standard deviation derived from posteriori covariance matrix inflow CO 2 flux is assumed to be known from a large scale transport model in further work, concentration data from additional tower will be used to improve the inflow flux given by a large scale model")
18
CSU RAMS LPD model influence functions for concentration for vertical flux Bayesian inversion modeling framework

19
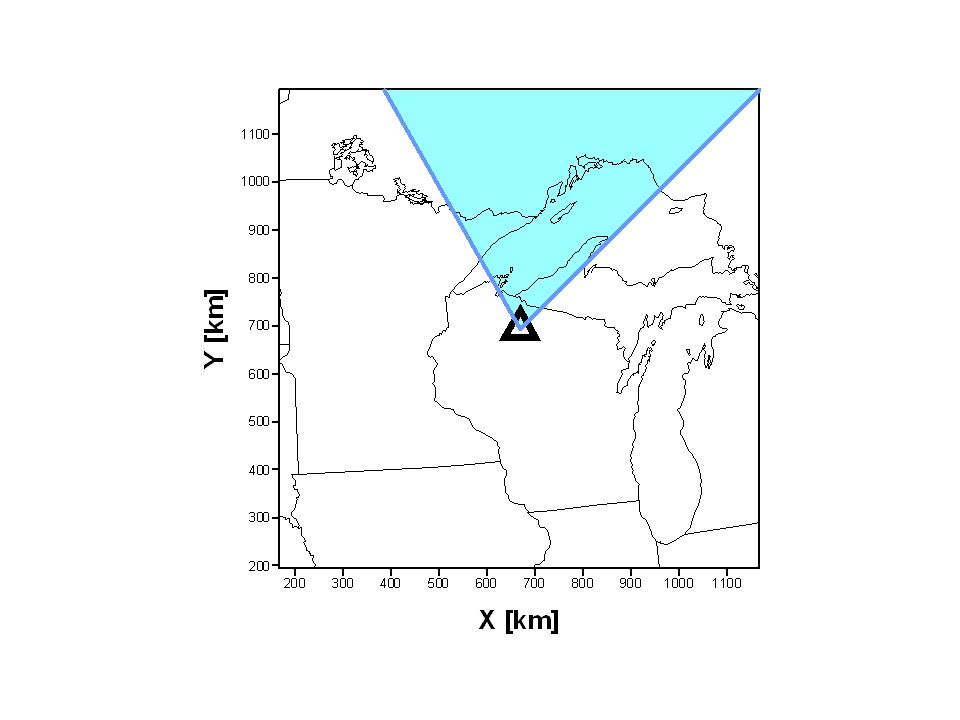
Signature of Lake Superior in WLEF tower CO 2 concentration data Attempt to validate transport modeling Example of using influence function to analyze observational data

20
… following data analysis by Noel R. Urban: 2000 WLEF data: CO 2 concentration lake and land sectors determined by 396m wind direction wind speed < season median daytime only 10:00-17:00 … following data analysis by Noel R. Urban: 2000 WLEF data: CO 2 concentration lake and land sectors determined by 396m wind direction wind speed < season median daytime only 10:00-17:00

24
Repeating analysis for all available CO 2 data 1996-2001

25
Repeating data analysis for August 2000

26
problems: a lot of missing wind data at 396m (only 62% of wind data available during 1996-2001 daytime hours) sectors poorly represent land or water source areas problems: a lot of missing wind data at 396m (only 62% of wind data available during 1996-2001 daytime hours) sectors poorly represent land or water source areas
 sectors poorly represent land or water source areas problems: a lot of missing wind data at 396m (only 62% of wind data available during daytime hours) sectors poorly represent land or water source areas")
27
Modeling approach to data analysis: RAMS simulation: (August 2000, 2 nested grids) LPD model influence functions Modeling approach to data analysis: RAMS simulation: (August 2000, 2 nested grids) LPD model influence functions
 LPD model influence functions Modeling approach to data analysis: RAMS simulation: (August 2000, 2 nested grids) LPD model influence functions")
28
Influence function: August 2000, entire domain

29
Influence function: August 2000, land

30
Influence function: August 2000, water

31
Influence function: August 2000, land

32
what 400m tower sees in “land” and “lake” sectors in August 2000

33
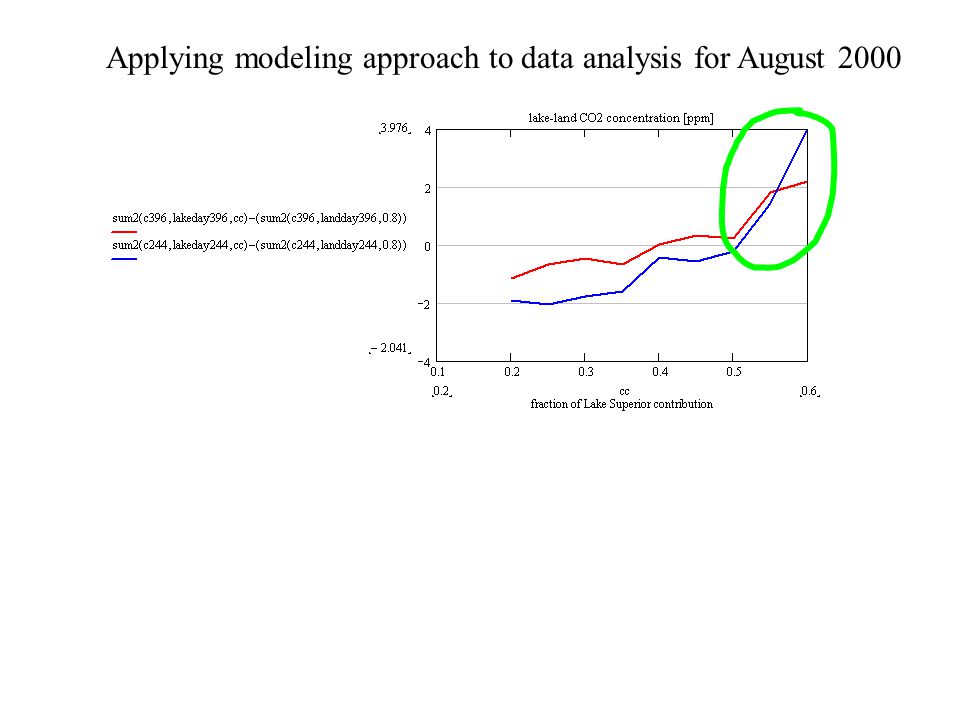
Applying modeling approach to data analysis for August 2000 Relative contribution from Lake Superior and all land areas

34
Applying modeling approach to data analysis for August 2000

37
time series analysis? lake contribution CO 2 concentration

38
RAMS/LPD simulations for WLEF area

39
Summer 2000

40
RAMS/LPD simulations for WLEF area Summer 2000 Summer 2004

41
RAMS/LPD simulations for WLEF area Pseudo-data inversions using the Ring of Towers (Summer 2000) Pseudo-data inversions using the Ring of Towers (Summer 2000) Summer 2000 Summer 2004
 Pseudo-data inversions using the Ring of Towers (Summer 2000) Summer 2000 Summer 2004")
42
RAMS/LPD simulations for WLEF area Pseudo-data inversions using the Ring of Towers (Summer 2000) Pseudo-data inversions using the Ring of Towers (Summer 2000) Summer 2000 Summer 2004 Real data inversions using the Ring of Towers (Summer 2004) Real data inversions using the Ring of Towers (Summer 2004)
 Pseudo-data inversions using the Ring of Towers (Summer 2000) Summer 2000 Summer 2004 Real data inversions using the Ring of Towers (Summer 2004) Real data inversions using the Ring of Towers (Summer 2004)")
43
RAMS/LPD simulations for WLEF area Pseudo-data inversions using the Ring of Towers (Summer 2000) Pseudo-data inversions using the Ring of Towers (Summer 2000) Summer 2000 Summer 2004 Real data inversions using the Ring of Towers (Summer 2004) Real data inversions using the Ring of Towers (Summer 2004) Data analysis using influence functions
 Pseudo-data inversions using the Ring of Towers (Summer 2000) Summer 2000 Summer 2004 Real data inversions using the Ring of Towers (Summer 2004) Real data inversions using the Ring of Towers (Summer 2004) Data analysis using influence functions")
Similar presentations


 Mariusz Pagowski Georg.>")


, 1053, doi:10.1029/2001GB001593,>")


 for the June, July, August and September 2000 Simulation: RAMS v4.3 with two nested grids (Δx=100km and.>")