Download presentation
Presentation is loading. Please wait.

1
From Elevation Data to Watershed Hierarchies Pankaj K. Agarwal Duke University Supported by ARO W911NF-04-1-0278

2
STREAM Project Scalable Techniques for hi-Resolution Elevation data Analysis & Modeling Participants (PIs) Pankaj K. Agarwal Lars Arge Helena Mitasova Students Andrew Danner Thomas Molhave Amber Stillings Ke Yi

3
Massive Data Sets LIDAR –NC Coastline: 200 million points – over 7 GB –Neuse River basin (NC): 500 million points – over 17 GB Output is also large –10ft grid: 3B cells Data too big for RAM –Must reside on disk –Disk is slow Exact computation expensive –Approximation techniques
: 500 million points – over 17 GB Output is also large –10ft grid: 3B cells Data too big for RAM –Must reside on disk –Disk is slow Exact computation expensive –Approximation techniques")
4
Application: Terrain Processing Pipeline

5
Given a point cloud sampled from a bivariate function z=F(x,y) (elevation data) Goal: construct a grid DEM for z DEM Applications –Hydrology –Ecology –Viewsheds … Many algorithms only work on grid data Point Cloud to Grid DEM
 (elevation data) Goal: construct a grid DEM for z DEM Applications –Hydrology –Ecology –Viewsheds … Many algorithms only work on grid data Point Cloud to Grid DEM")
6
Construction of Grid DEM Segment the space into small regions Interpolate within each segment separately – Use any interpolation method –Evaluate at grid cells –Write grid cell values as (i,j,z) as they are computed Sort grid cells by raster order Interpolate Evaluate (i, j, z) Sort
 as they are computed Sort grid cells by raster order Interpolate Evaluate (i, j, z) Sort")
7
Elevation to TIN DEM TIN: Triangulated Irregular Network Constrained Delaunay Triangulation Developed an I/O- efficient algorithm

8
Flow Modeling

9
Coping with Noisy Data Flooding in Sort(N) I/Os Many little bumps (local minima) After noise removal
 I/Os Many little bumps (local minima) After noise removal")
10
Identifying minima likely due to noise Don’t want to remove real features –Topological persistence [ELZ 02] –Computed in Sort(N) I/Os Coping with Noisy Data
![Identifying minima likely due to noise Don’t want to remove real features –Topological persistence [ELZ 02] –Computed in Sort(N) I/Os Coping with Noisy Data](http://images.slideplayer.com/16/5205761/slides/slide_10.jpg "Identifying minima likely due to noise Don’t want to remove real features –Topological persistence [ELZ 02] –Computed in Sort(N) I/Os Coping with Noisy Data")
11
Topological Persistence [Edelsbrunner et al. 02]
![Topological Persistence [Edelsbrunner et al. 02]](http://images.slideplayer.com/16/5205761/slides/slide_11.jpg "Topological Persistence [Edelsbrunner et al. 02]")
13
The Union-Find Problem A universe of N elements: x 1, x 2, …, x N Initially N singleton sets: {x 1 }, {x 2 }, …, {x N } Each set has a representative Maintain the partition under –Union( x i, x j ) : Joins the sets containing x i and x j –Find( x i ) : Returns the representative of the set containing x i Batched union-find: entire sequence is known in advance
 : Joins the sets containing x i and x j –Find( x i ) : Returns the representative of the set containing x i Batched union-find: entire sequence is known in advance")
14
Formulated as Batched Union-Find On a terrain represented as a TIN When reach –A minimum or maximum: do nothing –A regular point u: Issue union(u,v) for a lower neighbor v –A saddle u: let v and w be nodes from u ’ s two connected pieces in its lower link Issue: find(v), find(w), union(u,v), union(u,w) lower link
 for a lower neighbor v –A saddle u: let v and w be nodes from u ’ s two connected pieces in its lower link Issue: find(v), find(w), union(u,v), union(u,w) lower link")
15
Simple and Good, as long as … The entire data structure fits in memory

16
Experimental Results On the entire data set: EM takes 5 hours, IM fails

17
From Elevation to River Networks Where does water go? From higher elevation to lower elevation Single flow directions forms a tree Sea 80 90 100 95 85 110

18
Drainage Area How much area is upstream of each node? Each node has initial drainage area (1) Drainage area of internal nodes depends on drainage area of children 1 1 1 1 1 1 1 1 1 1 3 3 2 2 2 3 2 5 7 17 25 14 11 9 7
 Drainage area of internal nodes depends on drainage area of children")
19
Hierarchical Watershed Decomposition

20
Watershed Hierarchies Decompose a river network into a hierarchy of hydrological units All water in HU flows to a common outlet Hierarchy provides tunable level of detail Method used: Pfafstetter [VV99] Want a solution scalable to large modern hi-res terrains
![Watershed Hierarchies Decompose a river network into a hierarchy of hydrological units All water in HU flows to a common outlet Hierarchy provides tunable level of detail Method used: Pfafstetter [VV99] Want a solution scalable to large modern hi-res terrains](http://images.slideplayer.com/16/5205761/slides/slide_20.jpg "Watershed Hierarchies Decompose a river network into a hierarchy of hydrological units All water in HU flows to a common outlet Hierarchy provides tunable level of detail Method used: Pfafstetter [VV99] Want a solution scalable to large modern hi-res terrains")
21
Pfafstetter Find main river Find four largest tributaries Label basins/interbasins Recurse until single path 1 1 1 1 1 1 1 1 1 1 2 2 2 3 2 7 17 25 14 11 9 7 3 3 5 8 6 4 2 7 5 3 1 9

22
2 26 25 24 23 21 22 27 7 71 75 73 74 72 Recurse

23
Example Watershed Boundaries 1 2 3 4 5 6 7 8 9 91 92 93 94 95 96 97 98 99 991 992 993 994 995 996 997 998 999

24
Example Watershed Boundaries 1 2 3 4 5 6 7 8 9 91 92 93 94 95 96 97 98 99

25
A Complete Pipeline

26
Implementation TPIE: C++ primitives for I/O-efficient algorithms GRASS: Open Source GIS Interpolation: Regularized spline with tension (in GRASS) Data: –North Carolina LIDAR Neuse river basin: 400 million points (NC Floodmaps) Outer banks coastal data : 128 million points (NOAA CSC) –USGS 30m NED
 Data: –North Carolina LIDAR Neuse river basin: 400 million points (NC Floodmaps) Outer banks coastal data : 128 million points (NOAA CSC) –USGS 30m NED")
27
Grid Construction Results Resolution (ft)402010 Grid cells x10 6 2218853542 Points x10 6 205340415 Total time12h32m14h46m26h52m Time spent(%) Build quad tree8.97.15.7 Find neighbors31.632.429.1 Interpolate58.858.559.3 Write output0.725.9 Neuse Point Thinning Adjusted interpolation parameters
 Grid cells x Points x Total time12h32m14h46m26h52m Time spent(%) Build quad tree Find neighbors Interpolate Write output Neuse Point Thinning Adjusted interpolation parameters")
28
Sample Watershed Results size (MB)1507135819 size (mln cells)30.8147396.5 total time10m29s58m10s187m43s Time spent… % importing data8716 sorting by flow161513 building river list313529 sorting river list192019 computing labels766 sort by grid order141312 exporting data545
 size (mln cells) total time10m29s58m10s187m43s Time spent… % importing data8716 sorting by flow building river list sorting river list computing labels766 sort by grid order exporting data545")
29
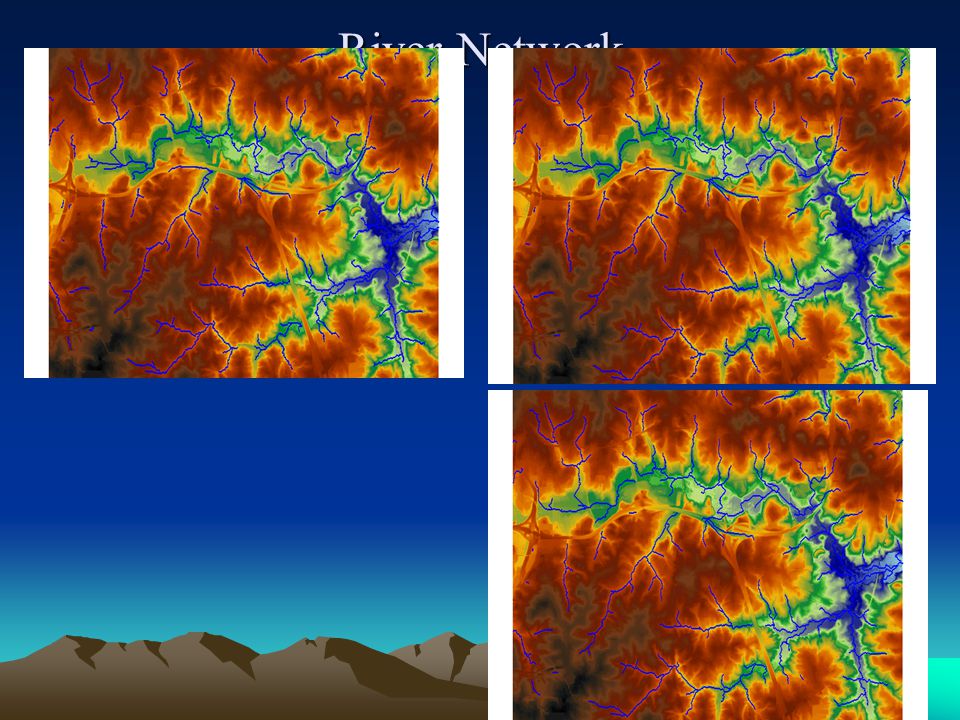
River Network: Grid DEM

30
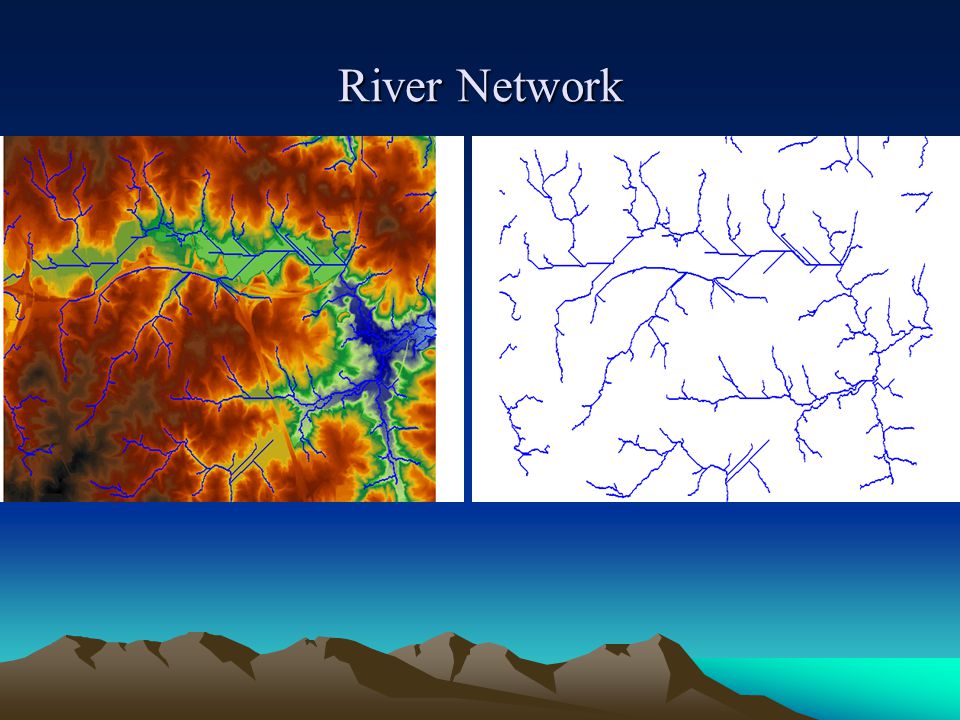
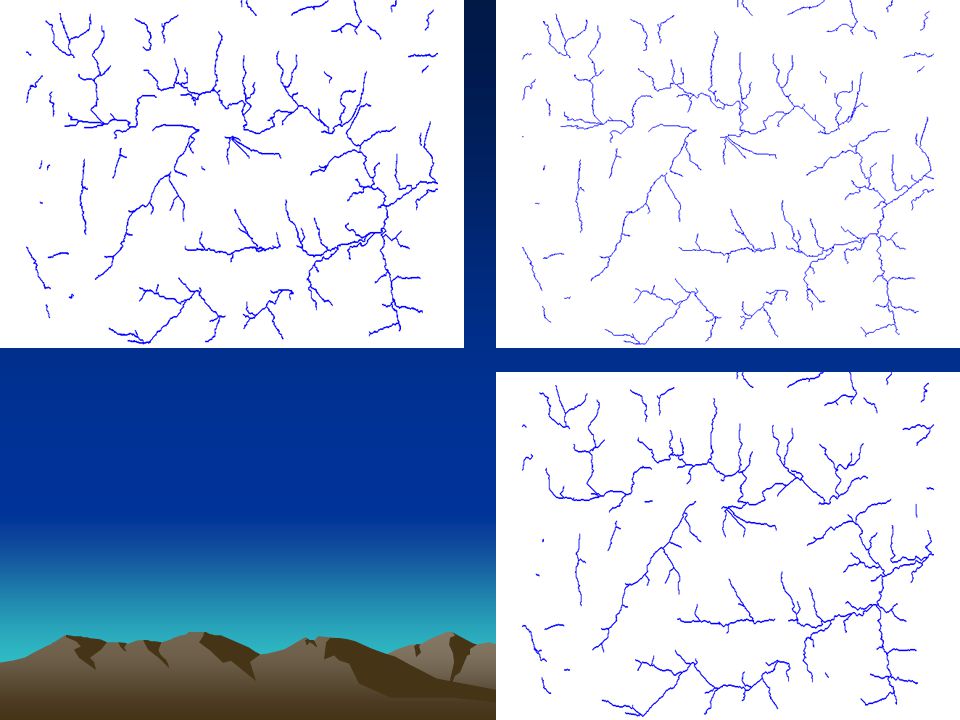
River Network

34
River Network: TIN DEM

35
Carving

36
Carving

37
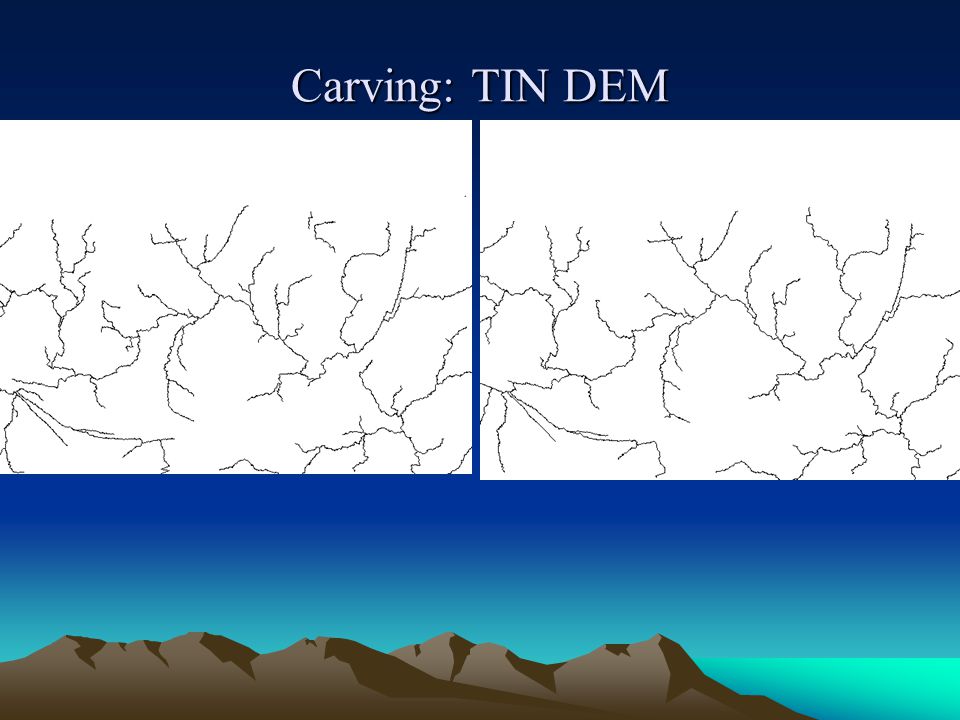
Carving: TIN DEM

39
River Network: TIN DEM

40
Future Directions – Grid Construction Interpolate leaves in parallel Test other interpolation methods Test with more data sources Finding the “ideal” resolution

41
Future Directions – Noise Removal Bridge detection/removal Other flow routing methods Flow routing on flat surfaces Comparing flow networks

42
Flow Routing and Bridges

43
Future Directions – Watershed Hierarchies Comparison of hierarchies at different resolutions Terrain simplification Support for upstream downstream basin queries Point and click watershed extraction

44
Thanks!

Similar presentations


 be a point. We want to estimate an elevation at a point q: 1. should.>")


 Datasets Lars Arge A A R H U S U N I V E R S I T E T Department of Computer Science.>")


. The.>")

 Pankaj K. Agarwal Workshop on Algorithms for Modern Massive Data Sets.>")


