Download presentation
Presentation is loading. Please wait.

1
Multinational R&D in China: An analysis based a survey in Beijing Prof. XUE, Lan and Dr. LIANG Zheng School of Public Policy and Management ( SPPM ) China Institute for S&T Policy(CISTP), Tsinghua University Global R&D in China-An International Forum Nanjing, China May 28-29
 China Institute for S&T Policy(CISTP), Tsinghua University Global R&D in China-An International Forum Nanjing, China May")
2
Outline Background Research design Initial Findings-nationwide Initial Findings-Beijing Implications

3
Background-Issues The trend of R&D globalization and MNC R&D Centers in China: Our study in 1999 found over 30 MNC R&D centers by major MNCs; Ministry of Commerce’s data for 2001 was less than 200; Very recently, government revealed that there are over 700 MNC R&D centers in China.

4
Debates and concerns (Policy level): In developing countries such as China, there is a debate about the impact of MNC R&D activities: spill-over vs. suck-in effects; In developed countries such as the US, there is also some concern: First manufacturing. Now R&D, Are they going too far?

5
Questions and puzzles (management level): What are the rationales (supply-factors vs. demand-factors)? What do they do (original vs. adaptive)? What are the impacts (remember Xerox’s PARC)?
. What do they do (original vs. adaptive). What are the impacts (remember Xerox’s PARC) .")
6
Background-objectives A follow up study of our 1999 study when we surveyed over 30 major MNC R&D centers around China (Xue etc.2000,2001,2002); Aimed at improving our understanding of MNCs R&D activities in China with a special focus on MNC’s R&D centers in Beijing. Supported by Ministry of S&T, and Municipal government of Beijing.

7
Research methods The sample: 335 MNCs in China out of 483 eligible companies from Business Week Global 1000; Research methods: Phone interviews with 289 of these companies; Questionnaires sent to 78 MNC directors in Beijing, with 36 responses; In depth interviews were conducted with 8 directors of these R&D centers.

8
Initial Findings Out of the 289 companies we phoned, 117 companies have set up R&D facilities in China; 215 R&D centers were set up by them; 107 are autonomous R&D labs; 59 are R&D units in the local subsidiaries; 49 joint centers (with universities and so on)
")
9
Initial Findings: industrial distribution (2004):
:")
10
Industry Name Total R&D centersAutonomous R&D Labs R&D Units NumberPercentNumberPercentNumberPercent Software3717.2%2624.3%46.8% Telecommunications3516.3%2018.7%58.5% Semiconductors198.8%1514.0% 0.0% Industrial Equipments and Components 3014.0%54.7%1627.1% Automobiles177.9%76.5%58.5% Commodity Chemicals104.7%76.5%11.7% Biotechnology &Drugs188.4%65.6%915.3% Household Electronics136.0%65.6%35.1% Other IT Products146.5%54.7%813.6% Chemicals94.2%43.7%35.1% Food and Beverages73.3%32.8%46.8% Industrial Conglomerates20.9%21.9% 0.0% Others41.9%10.9%11.7% Total215100%107100%59100% Table 1 The industrial distribution of the R&D centers settled by Business1000 MNCs in China ( 2004 )
")
11
Initial Findings-country distribution (2004)
")
12
Parent Countries Total R&D CentersAutonomous R&D Labs R&D Units NumberPercentNumberPercentNumberPercent North America 1 10347.9%5248.6%2644.1% Japan4721.9%2321.5%1220.3% Korea2411.2%98.4%813.6% Europe : 4018.6%2220.6%1322.0% UK, France& German2411.2%1110.3%1220.3% North Europe 2 83.7%65.6% 0.0% Other European Counties 3 83.7%54.7%11.7% Other Countries10.5%10.9% 0.0% Total215100%107100%59100% Table 2 The country distribution of the R&D centers settled by Business1000 MNCs in China ( 2004 )
")
13
Initial Findings-location choice (2004):
:")
14
Table 3 The regional distribution of the R&D centers settled by Business1000 MNCs in China ( 2004 ) Regions Total R&D CentersAutonomous R&D Labs R&D Units NumberPercentNumberPercentNumberPercent Beijing8238.1%5147.7%1423.7% Shanghai6027.9%3532.7%1423.7% Tianjin94.2%21.9%610.2% Guangdong2310.7%87.5%711.9% Jiangsu188.4%54.7%915.3% Other regions2310.7%65.6%915.3% Total215100%107100%59100%
 Regions Total R&D CentersAutonomous R&D Labs R&D Units NumberPercentNumberPercentNumberPercent Beijing8238.1%5147.7%1423.7% Shanghai6027.9%3532.7%1423.7% Tianjin94.2%21.9%610.2% Guangdong2310.7%87.5%711.9% Jiangsu188.4%54.7%915.3% Other regions2310.7%65.6%915.3% Total215100%107100%59100%")
15
The case of Beijing

16
Positioning of the R&D Centers

17
What attracts these R&D centers to China?

18
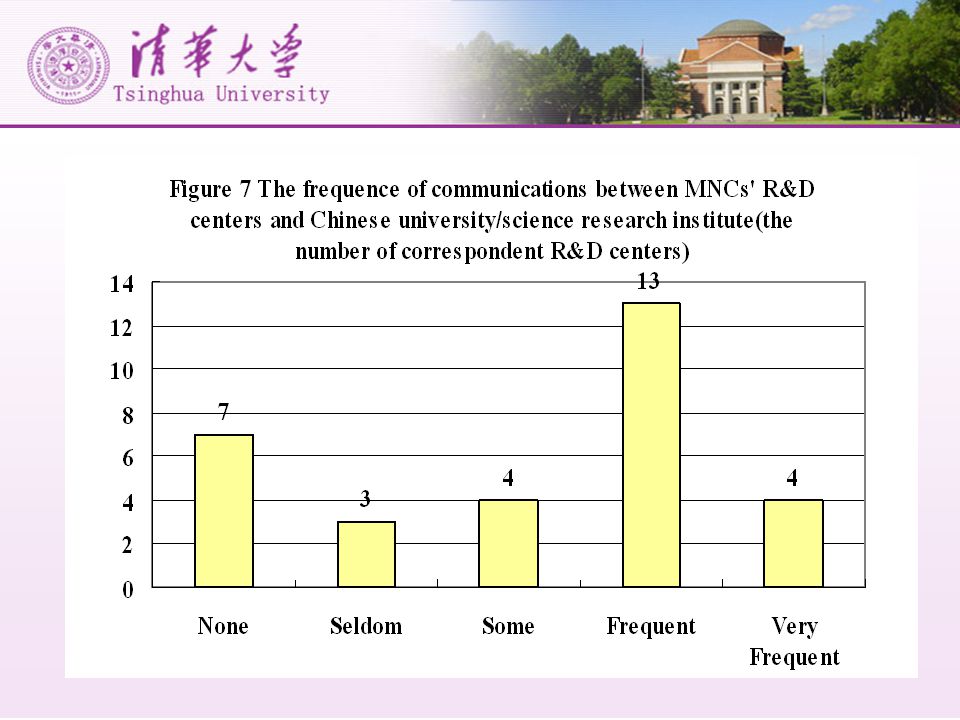
Sources of Knowledge SourcesNumber of SamplesMean R&D Headquarter303.7667 Literature302.1667 Brother R&D Centers302.1667 Chinese Uni. Or Inst.301.9333 Colleague R&D Centers301.2000 Local Brother Factories301.1667 Table 4 The sources of knowledge of MNCs’ R&D Centers in Beijing

21
Discussion Providing high quality S&T human resources and market opportunities are more important in attracting MNC R&D centers than preferential policies; A high percentage of these R&D centers behave more like enclaves in China, interacting mostly within the company’s own network; the linkages with local companies are very weak. There is a need to get MNC R&D centers to be more involved in local debates and discussions, which would be helpful for both domestic and multinational companies.

22
Thank you!

Similar presentations


 Global R&D in China, May 28-29,2005.>")


