Download presentation
Presentation is loading. Please wait.

1
Feb 28, 2010 NEMO data meta-analysis: Application of NEMO analysis workflow to consortium datasets (redux) http://nemo.nic.uoregon.edu
")
2
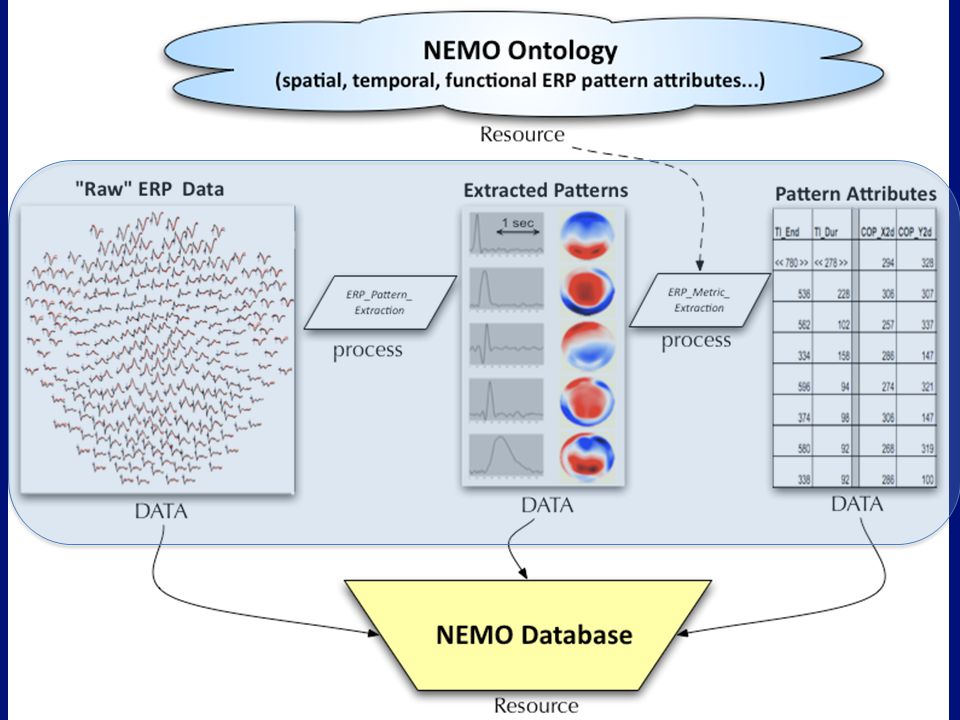
Overview of NEMO Project Aims Design and test procedures for automated & robust ERP pattern analysis and classification Capture rules, concepts in a formal ERP ontology Develop ontology-based tools for ERP data markup Apply ERP analysis tools to consortium datasets Perform meta-analyses of consortium data Build data storage & management system

3
The three pillars of NEMO ERP Ontologies ERP Data ERP Database & portal Focus of this All-Hands Meeting Focus of this All-Hands Meeting

5
TODA Y TUTORIAL #2: Decomposition with PCA TUTORIAL #3: Segmentation with Microstates TUTORIAL #1: Viewing ERP Data in EEGLAB

6
TOMORROW TUTORIAL #4: Extracting ontology-based attributes And exporting to text or RDF

7
1.Collect ERP data sets with compatible functional attributes 2.Decompose / segment the ERP data into discrete spatio- temporal patterns for analysis & labeling 3.Mark-up patterns within each dataset: labeling of spatial & temporal characteristics (functional labels assigned in step 1) 4.Cluster patterns within data sets 5.Link labeled clusters across data sets 6.Label linked clusters (i.e., establish mappings across patterns from different dataset) Overview Steps in Meta-analysis
 4.Cluster patterns within data sets 5.Link labeled clusters across data sets 6.Label linked clusters (i.e., establish mappings across patterns from different dataset) Overview Steps in Meta-analysis")
8
1.Collect ERP data sets with compatible functional attributes 2.Decompose / segment the ERP data into discrete spatio- temporal patterns for analysis & labeling 3.Mark-up patterns within each dataset: labeling of spatial & temporal characteristics (functional labels assigned in step 1) 4.Cluster patterns within data sets 5.Link labeled clusters across data sets 6.Label linked clusters (i.e., establish mappings across patterns from different dataset) Focus of 1 st Annual All-Hands Meeting
 4.Cluster patterns within data sets 5.Link labeled clusters across data sets 6.Label linked clusters (i.e., establish mappings across patterns from different dataset) Focus of 1 st Annual All-Hands Meeting")
9
1.Collect ERP data sets with compatible functional attributes 2.Decompose / segment the ERP data into discrete spatio- temporal patterns for analysis & labeling 3.Mark-up patterns within each dataset: labeling of spatial & temporal characteristics (functional labels assigned in step 1) 4.Cluster patterns within data sets 5.Link labeled clusters across data sets 6.Label linked clusters (i.e., establish mappings across patterns from different dataset) Overview Steps in Meta-analysis
 4.Cluster patterns within data sets 5.Link labeled clusters across data sets 6.Label linked clusters (i.e., establish mappings across patterns from different dataset) Overview Steps in Meta-analysis")
10
Combining Top-down and Bottom- up Methods for ERP Pattern Classification Gwen Frishkoff University of Pittsburgh Robert Frank, Haishan Liu, & Dejing Dou University of Oregon

11
Human Brain Mapping Current Challenges – Tracking what we know Ontologies – Integrating knowledge to achieve high-level understanding of brain–functional mappings Meta-analyses Important Considerations – Stay true to data (bottom-up) – Achieve high-level understanding (top-down) “Understanding without data is empty. Data without understanding are blind”

12
ERP Patterns 1,000 ms TIME (in 10s of ms) SPACE (Scalp Topography)
 SPACE (Scalp Topography)")
13
Superposition of ERP Patterns

14
What do we know? Observed Pattern = “P100” iff Event type is visual stimulus AND Peak latency is between 70 and 160 ms AND Scalp region of interest (ROI) is occipital AND Polarity over ROI is positive (>0) FUNCTION TIME SPACE ?
 is occipital AND Polarity over ROI is positive (>0) FUNCTION TIME SPACE .")
15
Why does it matter? Robust pattern rules would provide a good foundation for– Development of ERP ontologies Labeling of ERP data based on pattern rules Cross-experiment, cross-lab meta-analyses

16
TOP-DOWN

17
BOTTOM-UP

18
Top-down vs. Bottom-up Top-DownBottom-Up PROS Familiar Science-driven (integrative) Formalized Data-driven (robust) CONS Informal Paradigm- affirming? Unfamiliar Study-specific results?
 Formalized Data-driven (robust) CONS Informal Paradigm- affirming. Unfamiliar Study-specific results .")
19
Combining Top-Down & Bottom-Up

20
A Case Study 1.Simulated ERP datasets 2.PCA & ICA methods for spatial & temporal pattern analysis 3.Spatial & temporal metrics for labeling of discrete patterns 4.Revision of pattern rules based on mining of labeled data

21
Simulated ERPs (n=80) P100 N100 N3 MFN P300 + NOISE
 P100 N100 N3 MFN P300 + NOISE")
22
BOTTOM-UP

23
Pattern Analysis with PCA & ICA

24
ERP pattern analysis Temporal PCA (tPCA) – Gives invariant temporal patterns (new bases) – Spatial variability as input to data mining Spatial ICA (sICA) – Gives invariant spatial patterns (new bases) – Temporal variability as input to data mining Spatial PCA (sPCA) ✔ ✔ Multiple measures used for evaluation (correlation + L1/L2 norms) X
 – Gives invariant temporal patterns (new bases) – Spatial variability as input to data mining Spatial ICA (sICA) – Gives invariant spatial patterns (new bases) – Temporal variability as input to data mining Spatial PCA (sPCA) ✔ ✔ Multiple measures used for evaluation (correlation + L1/L2 norms) X")
25
BOTTOM-UP

26
Measure Generation A B T1 T2 S1 S2 Vector attributes = Input to Data mining (clustering & classification) CoP CoN ROI± Centroids Input to data mining: 32 attribute vectors, defined over 80 “individual” ERPs (observations)
 CoP CoN ROI± Centroids Input to data mining: 32 attribute vectors, defined over 80 individual ERPs (observations)")
27
BOTTOM-UP

28
Data mining Vectors of spatial & temporal attributes as input Clustering observations patterns (E-M accuracy >97%) Attribute selection (“Information gain”) Figure 3. Info gain results for spatial ICA. CoP CoN ✔ ± Centroids Peak Latency

29
Revised Rule for the “P100” Pattern = P100v iff Event type is visual stimulus AND Peak latency is between 76 and 155 ms AND Positive centroid is right occipital AND Negative centroid is left frontal SPACE TIME FUNCTION

30
What we’ve learned Bottom-up methods result in validation & refinement of top-down pattern rules Validation of expert selection of temporal concepts (peak latency) Refinement of expert specification of spatial concepts (± centroids) Alternative pattern analysis methods (e.g., tPCA & sICA) provide complementary input to bottom- up (data mining) procedures
 Refinement of expert specification of spatial concepts (± centroids) Alternative pattern analysis methods (e.g., tPCA & sICA) provide complementary input to bottom- up (data mining) procedures")
31
Simulated ERP Patterns “P100”“N100”“N3”“MFN”“P300”

32
Applying NEMO Functional Ontology Angela Laird BrainMap Jessica Turner BIRNlex (now part of Neurolex) CogPO http://brainmap.org/scribe/index.html
 CogPO")
33
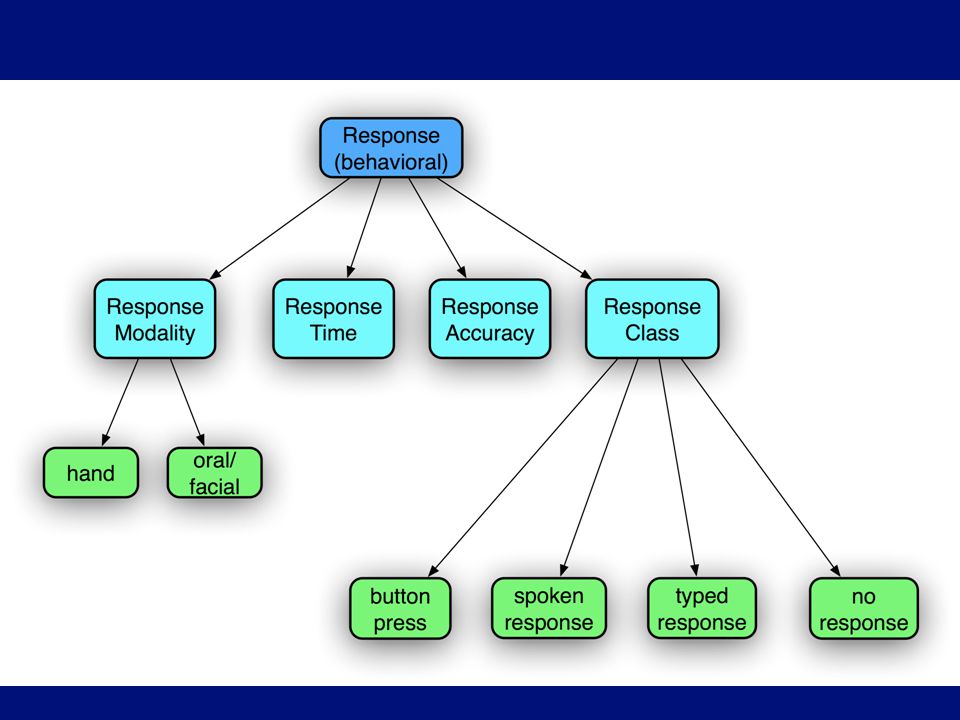
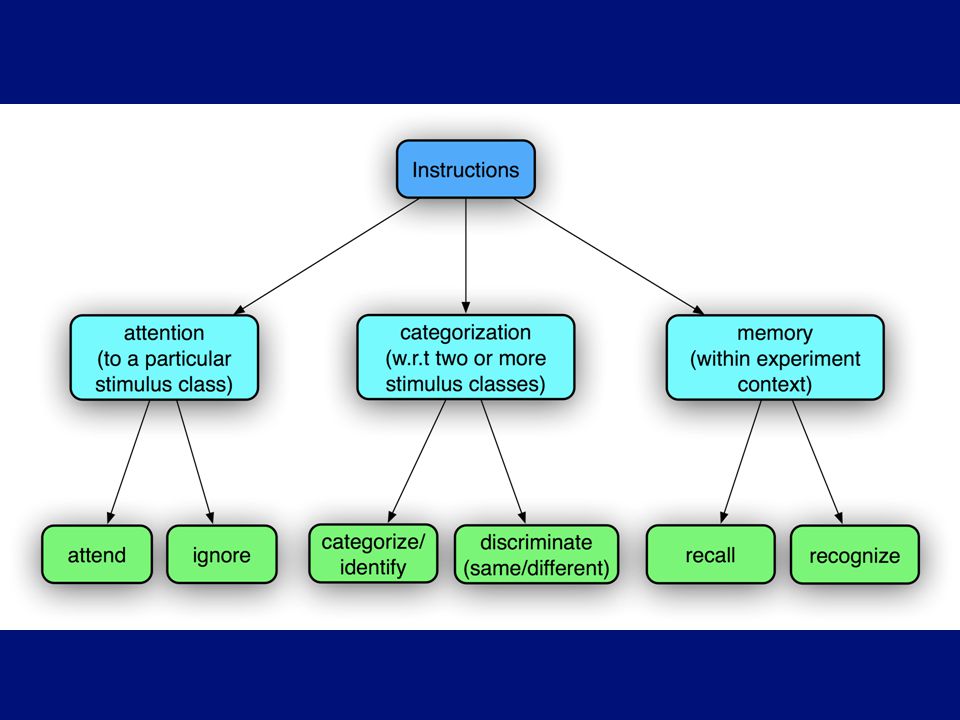
Adoption of BrainMap Classification Schema (modified for NEMO specifics*) Each experiment dataset classified based on: Subject contrasts — for first phase of NEMO, focus on healthy young monolingual adults (no contrasts) Condition contrasts — Which are defined with respect to stimulus, response, and instruction attributes * See NEMO_functional.low for details
 Each experiment dataset classified based on: Subject contrasts — for first phase of NEMO, focus on healthy young monolingual adults (no contrasts) Condition contrasts — Which are defined with respect to stimulus, response, and instruction attributes * See NEMO_functional.low for details")
34
Agreed to identify more auditory ERP data sets Agreed to restructure this hierarchy: primed as a special case of ”activated” (primed = within WM/activation span SOA<10 sec AND prime-targ lag <3 ?

37
Datasets for NEMO Metaanalysis #1

38
Proposed pipeline for first NEMO meta- analysis

39
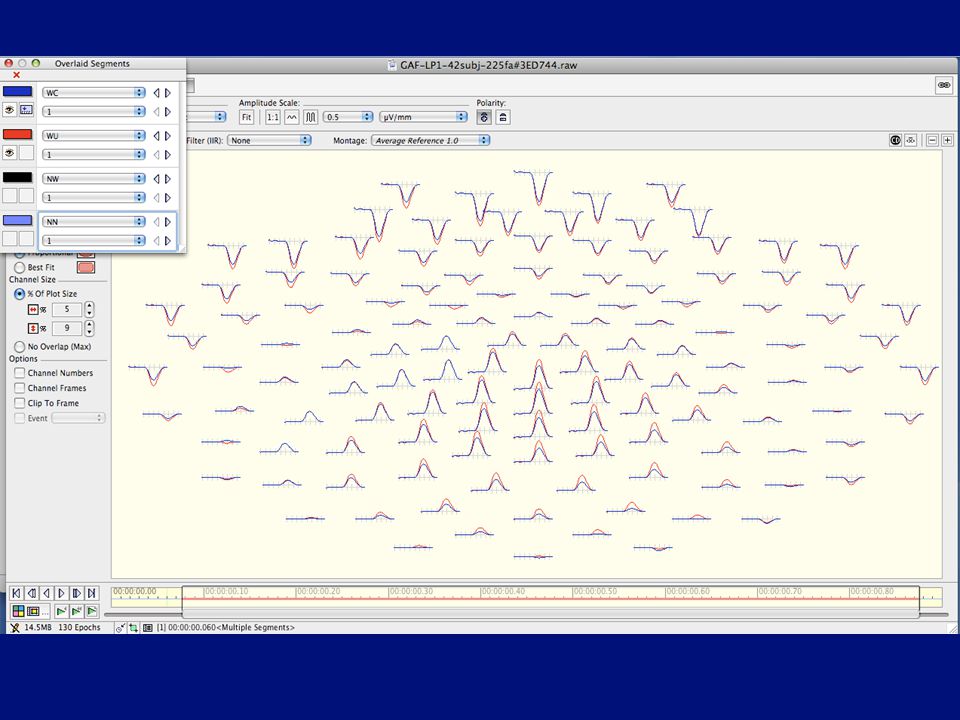
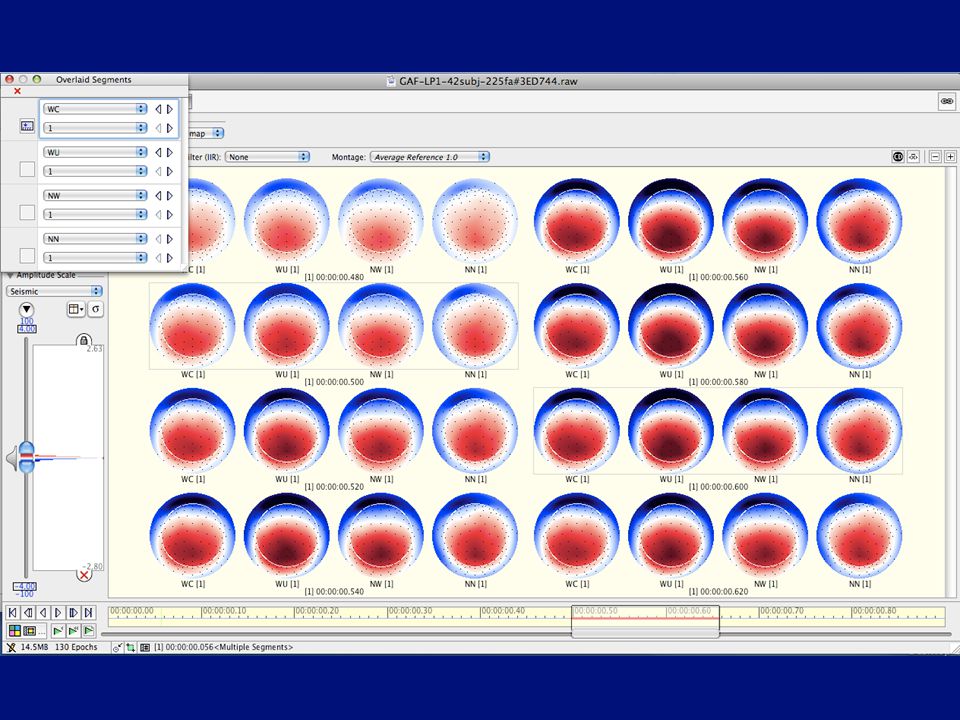
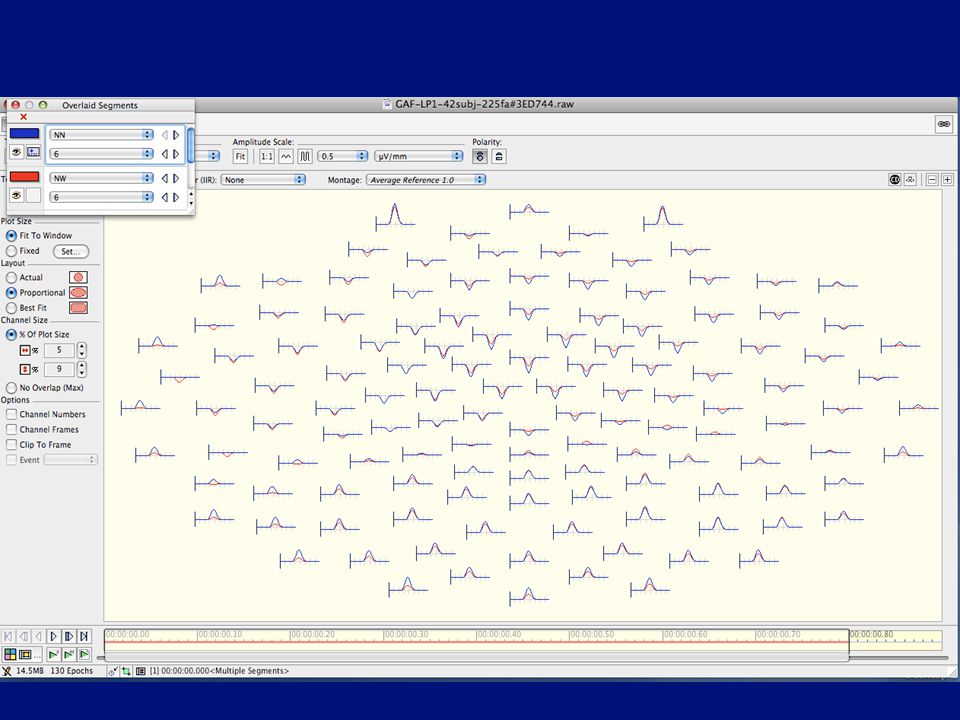
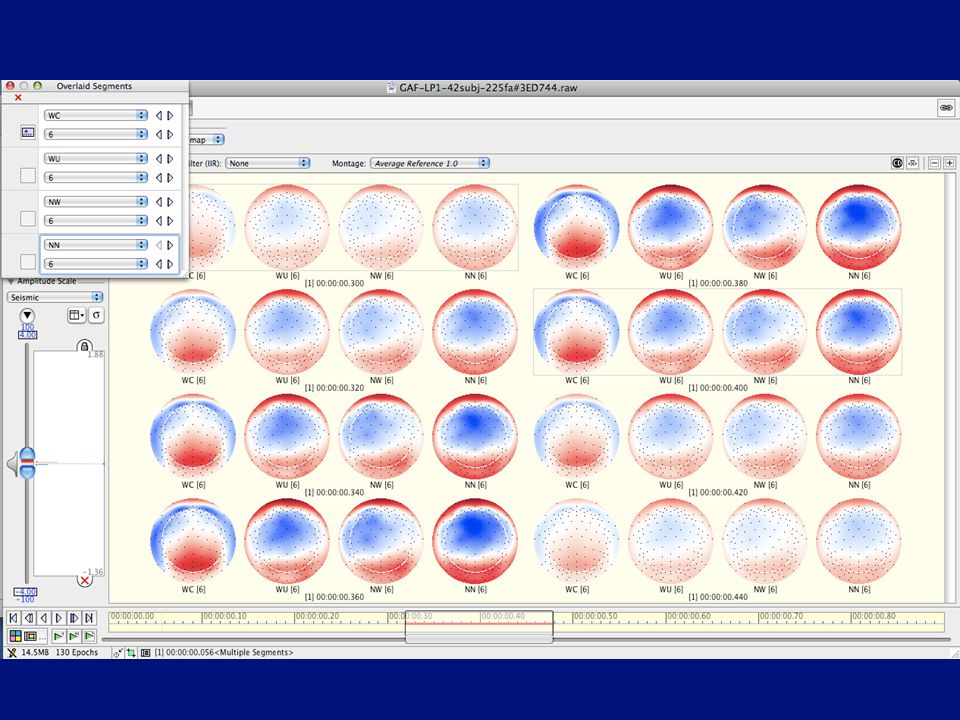
LP1 dataset (semantic contrast)– tPCA results (reconstructed ERP) projected into data space
– tPCA results (reconstructed ERP) projected into data space")
40
LP1 dataset ( Lexicality Contrast )– tPCA results (reconstructed ERP) projected into data space
– tPCA results (reconstructed ERP) projected into data space")
45
Following are some selected factors from LP1 tPCA results to illustrate some possible issues with factor ordering & retention after rotation…

46
LP1 dataset (tPCA Fac 1)– Lexicality Contrast
– Lexicality Contrast")
47
LP1 dataset (tPCA Fac 2)– Lexicality Contrast
– Lexicality Contrast")
48
Some Preliminary Conclusions Factor Retention may still be an issue for us collectively to explore – Unrestricted rotation vs. data reduction prior to rotation – For unrestricted path, what number to retain at end (after rotation)? – Also for unrestricted path, how to order factors at end (after rotation) We agreed to explore these issues, try to decide on final analysis pipeline by some date in near future (TBD…)
. – Also for unrestricted path, how to order factors at end (after rotation) We agreed to explore these issues, try to decide on final analysis pipeline by some date in near future (TBD…).")
Similar presentations


 between ERP patterns derived from: different data decomposition methods (temporal PCA and spatial.>")

 Supervisor: Robert Dale.>")
 a) HARVEST: An Intelligent Visual Analytic Tool for the.>")


>")


