Download presentation
Presentation is loading. Please wait.

1
Sub-mm/mm astrophysics: How to probe molecular gas
Yasuo Fukui Nagoya University Summer School The Gaseous Universe Oxford, July 2010

2
Lecture 3 Giant molecular clouds, GMCs
Sub-mm/mm astrophysics: How to probe molecular gas

3
Giant molecular clouds, GMCs
Size 100 pc Mass Mo Linewidth 5-15 km/s Density cm-3 Temperature K The disk vs. the galactic centre Star formation OB associations, loose clusters less than 10% of H is converted into stars, low SF efficiency

4
Previous observations of extragalactic GMCs;
Poor resolution Only global averaged properties Spiral structures seen in GMCs Global correlation with star formation LIR vs. M(H2)
")
5
Resolved GMCs; galaxies vs. Milky Way; galaxies are too far and the MW is too much contaminated Need spatial resolutions of 40pc or better, as compared with 100pc Local group galaxies offer the laboratory LMC (50kpc) in the south, M33 (700kpc) in the north see review, Fukui and Kawamura, 2010, Ann.Rev.A.A., “Molecular clouds in nearby galaxies”
 in the south, M33 (700kpc) in the north. see review, Fukui and Kawamura, 2010, Ann.Rev.A.A., Molecular clouds in nearby galaxies")
6
Key issues; Physical properties Formation and dissipation of GMCs,
mass spectrum, size, line width, X factor, X = N(H2)/ W(12CO) uniform? star formation Formation and dissipation of GMCs, Timescales of evolution Dynamical state, gravitationally relaxed?
/ W(12CO) uniform star formation. Formation and dissipation of GMCs, Timescales of evolution. Dynamical state, gravitationally relaxed")
7
A survey for GMCs in the LMC;
LMC, Large Magellanic Cloud Irr, 1/10 of the MW in mass no central dense part lower metallicity, active star formation (30Dor) 4kpc x 4kpc Low resolution 120pc observations with 1.2m telescope NANTEN 4m telescope, 40pc resolution for the LMC
 4kpc x 4kpc. Low resolution 120pc observations with 1.2m telescope. NANTEN 4m telescope, 40pc resolution for the LMC.")
8
NANTEN GMC survey in the LMC
Fukui et al. 1999; 2008 30000 points in 12CO J=1-0 273 GMCs discovered first sample of GMCs complete for a single galaxy

9
LMC HI & CO HI by ATCA : Kim et al. (1998), CO by NANTEN: Fukui et al. (2001) Total molecular mass (10% of HI)~ 7×10⁷ M
 Total molecular mass (10% of HI)~ 7×10⁷ M .")
10
M33 Correlation with HI Deul & van der Hulst (1987)
What is the hole to filament ratio? Deul & van der Hulst (1987)
")
11
Mass Distribution Very Similar
Mass normalized by an observed area n(>M’) M^(S+1) LMC 0.08 IC 0.41 M 0.20 M 0.48 Outer 0.06 Blitz et al. 2006
 M^(S+1) LMC IC M M Outer Blitz et al")
12
X-factor

13
LMC CO and H Green contour: GMCs by NANTEN Fukui et al. (2008)
H by Kim et al. (1999)
")
14
3 Types of GMCs in the LMC ~ 7 Myr Type I ~ 10 Myr Type II ~ 5 Myr
O-Starless 44 clouds(32 %) ~ 7 Myr Type I Only HII regions 88 clouds (51 %) Clusters and HII regions 39 clouds (23 %) Only clusters ~ 10 Myr Type II ~ 5 Myr Type III ~ 5 Myr 150 pc
 ~ 7 Myr. Type I. Only HII regions. 88 clouds (51 %) Clusters and HII regions. 39 clouds (23 %) Only clusters. ~ 10 Myr. Type II. ~ 5 Myr. Type III. ~ 5 Myr. 150 pc.")
15
Physical properties among three GMC types
Type I Type II Type III

16
Formation of GMCs HII cooled down to H2? HI becomes denser to H2?
Unlikely if see GMCs and HII regions on the LMC HI becomes denser to H2?

17
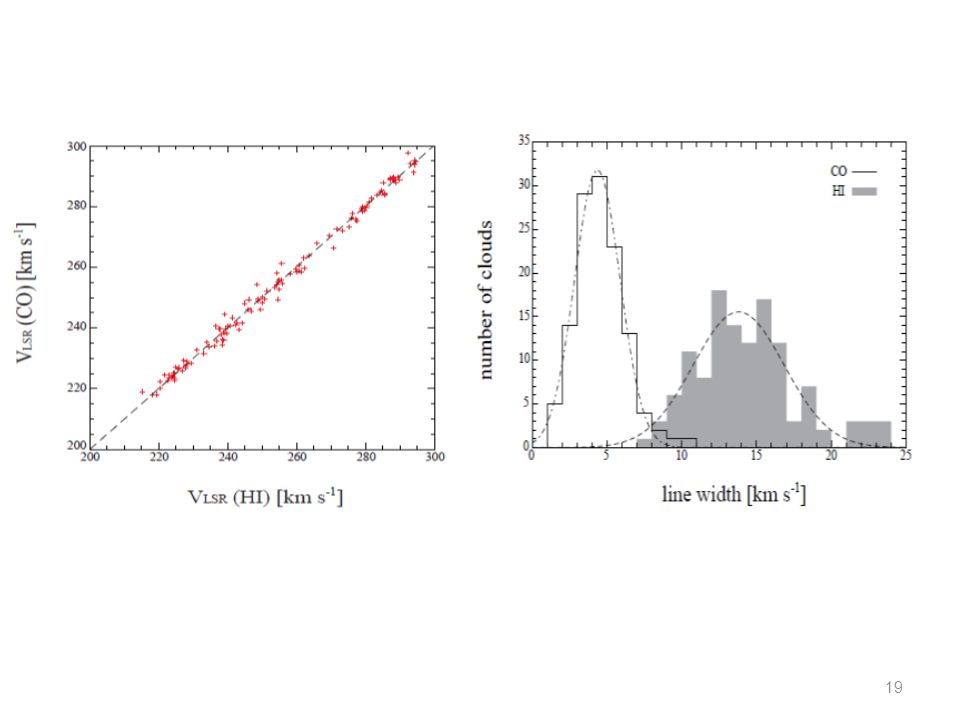
“3-D” comparison of CO and HI in the LMC Fukui et al. 2009
Previous studies: 2D projection and larger spatial averaging, 100pc ~1kpc, e.g., Schmidt law Present study: local property of star forming GMC and HI at ~50pc scales X-Y and Velocity: 3-D datacube of CO NANTEN and HI ATCA (Kim et al.2003) Resolution: 40pc x 1.7 km/s HI CO
 Resolution: 40pc x 1.7 km/s. HI. CO.")
18
3-D analysis HI associated with CO HI all

20
イメージ:HI コントア:12CO (コントアレベル 12Kから3.6Kごと)
Type I Type II Type III イメージ:HI コントア:12CO (コントアレベル 12Kから3.6Kごと)
")
22
HI and GMC relation (3-D)
Log[<Ico> ] [K km/s] 2.0 2.4 2.8 -1 1 Log[<IHI >] [K km/s] + Type I + Type II Type III y x0.8

23
3-D Results of CO-HI correlation
GMCs have “HI envelopes” of pc HI envelope” grows from Type I to Type III GMCs Ico a IHI (HI intensity = Ts x t) By assuming spin temperature Ts = constant, the HI mass increases from Type I to III HI filaments of ~ 500pc, birth site of GMC formed by bubbles/spiral density waves Conversion of HI into H2 on dust grains: timescale ~10^9yrs/n(cm-3)~10Myrs for 100 cm-3
 By assuming spin temperature Ts = constant, the HI mass increases from Type I to III. HI filaments of ~ 500pc, birth site of GMC. formed by bubbles/spiral density waves. Conversion of HI into H2 on dust grains: timescale ~10^9yrs/n(cm-3)~10Myrs for 100 cm-3.")
24
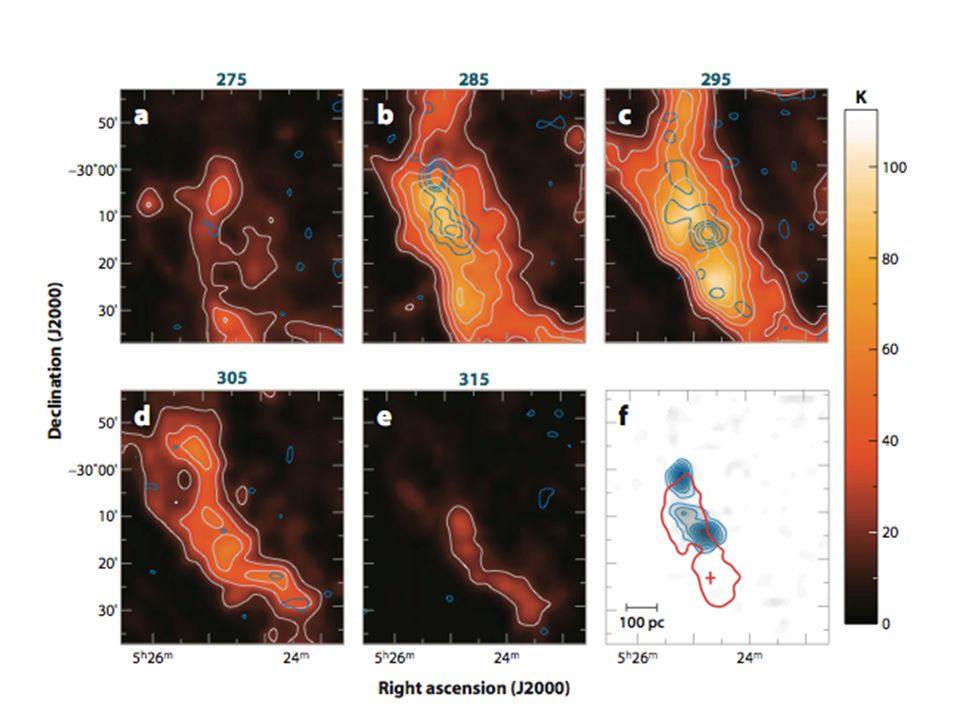
GMC grows by collecting HI
[106 Mo per 10 Myr] Mass flow rate; dM/dt~0.1 solar mass/yr dM/dt=4pR2 n(HI) V R~70pc n(HI)~10 cm-3 V~7 km/s HI CO
 V. R~70pc. n(HI)~10 cm-3. V~7 km/s. HI. CO.")
25
SMC LMC

26
M33 Correlation with HI Deul & van der Hulst (1987)
What is the hole to filament ratio? Deul & van der Hulst (1987)
")
27
LMC HI & CO HI by ATCA : Kim et al. (1998), CO by NANTEN: Fukui et al. (2001) Total molecular mass (10% of HI)~ 7×10⁷ M
 Total molecular mass (10% of HI)~ 7×10⁷ M .")
28
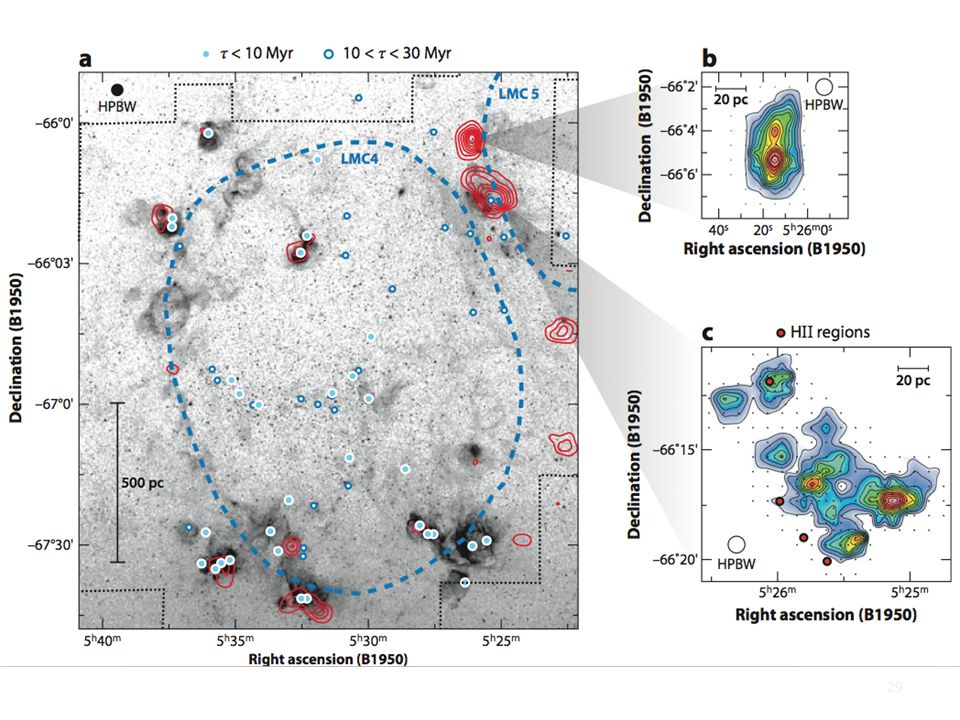
LMC4

30
The Galactic centre 1 GMCs in the disk forms and evolves Under extreme high pressure, the Galactic center, the evolution is significantly different High velocity dispersion, High temperature, Low active star formation in the MW

31
Driven by stellar bar potential (Binney et al. 1991)
The Galactic centre 2 Driven by stellar bar potential (Binney et al. 1991) and/or molecular loops (Fukui et al. 2006) Binney et al. 1991 - Stellar gravitational energy is converted into gas motion by he bar or by the Parker instability
 and/or molecular loops (Fukui et al. 2006) Binney et al Stellar gravitational energy is converted into gas motion by he bar or by the Parker instability.")
32
No reasonable definition of a GMC is possible.
GMCs are far from dynamical equilibrium, different regime from disk Extragalactic GMCs with ALMA will resolve these clouds in galaxies, significantly different size-linewidth relation e.g., M64, NGC253

34
Galactic centre magnetic field

35
Parker instability in the nuclear disk (Machida et al. 2009)
left) Blue surface: volume rendered image of the gas density Curves: Floating magnetic loops. Color depicts vertical velocity from minus to plus: blue – white –red. right) Enlarged figure of the left panel. Curves are same on the left panel.
 Blue surface: volume rendered image of the gas density. Curves: Floating magnetic loops. Color depicts vertical velocity from minus to plus: blue – white –red. right) Enlarged figure of the left panel. Curves are same on the left panel.")
36
Galactic magnetic flotation loops
Solar loops (TRACE:191Å) Discovery in 2006 40yrs since Parker (1966) Tajima and Shibata 1997
 Discovery in yrs since Parker (1966) Tajima and Shibata")
37
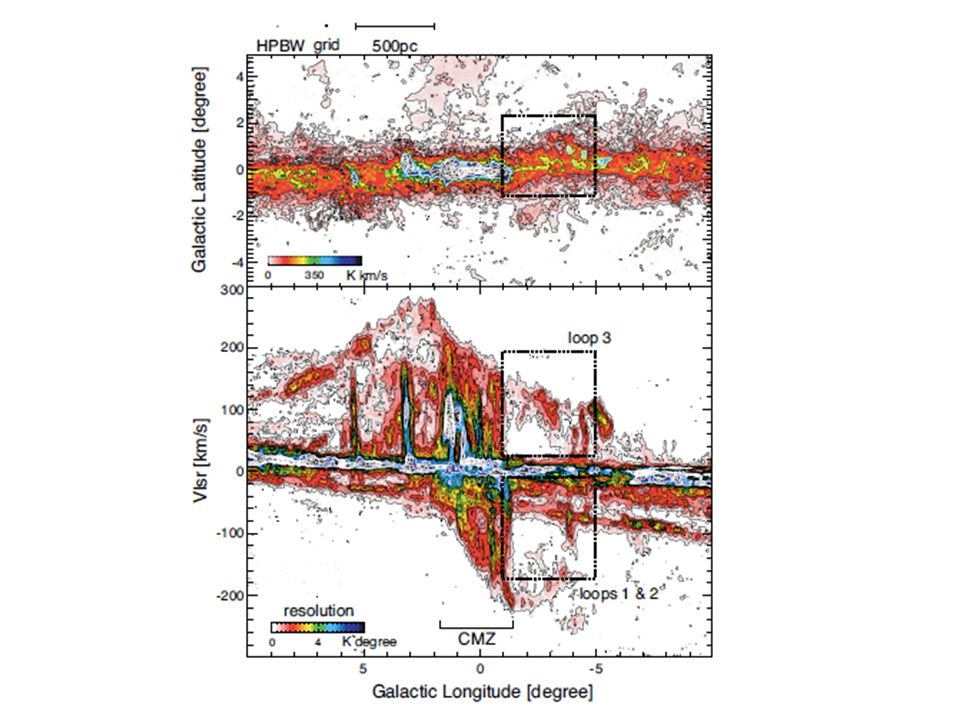
12CO(J=3-2) observations ASTE CO(J=3-2) -180 - -40 km/s
NANTEN CO J= 1-0 Torii et al. 2010b

38
12CO(J=3-2)/12CO(J=1-0) ratio: R3-2/1-0
Color:R3-2/1-0, Contours:ASTE CO(J=3-2) P-V diagram High R3-2/1-0 inside the U shape
 P-V diagram. High R3-2/1-0 inside the U shape.")
39
LVG analysis 12CO(J=1-0, 3-2, 4-3, 7-6), 13CO(J=1-0), C18O(J=1-0)
Broad emission Spectra カラー:R3-2/1-0, コントア:ASTE CO(J=3-2) 空間分布図 A 12CO(J=1-0, 3-2, 4-3, 7-6), 13CO(J=1-0), C18O(J=1-0) Take 10 km/s average intensities [12CO]/[13CO] 〜 (Riquelme 2010) [12CO]/[C18O] 〜 (i.e. Wilson & Matteucci 1992) [12CO]/[H2] = 1×10⁻⁴ dv/dr= 9.0 km/s/pc Chi-square minimization B C
 空間分布図. A. 12CO(J=1-0, 3-2, 4-3, 7-6), 13CO(J=1-0), C18O(J=1-0) Take 10 km/s average intensities. [12CO]/[13CO] 〜 53 (Riquelme 2010) [12CO]/[C18O] 〜 250 (i.e. Wilson & Matteucci 1992) [12CO]/[H2] = 1×10⁻⁴. dv/dr= 9.0 km/s/pc. Chi-square minimization. B. C.")
40
LVG analysis – Results –
Typically T 〜30-50 K, n〜103 /cm3 Broad emission : > 100 K Magnetic reconnection may offers a possible candidate for the hot and broad gas component.

41
Molecular Loops in Galaxies?
・NGC253 Sakamoto et al. (2006) Jy/beam km/s A B Same size and resolution with Sakamoto et al. (2006) Now, we have found several molecular loops magnetically floated by the parker instability in the center of the Milky Way. Of course we have a question on this phenomenon. If the Milky Way is a typical spiral galaxy, the molecular loops should exist in other distant galaxies. Here I present an example of nearby nearly edge-on galaxy, NGC 253. This is a J-Ks image of the NGC 253. Sakamoto et al. (2006) have observed a center of the NGC253 here by 2-1 line of CO and its isotopes. This is an intensity map of the center region of NGC253 in 12CO(J=2-1). We can see a gas condensation similar to the center of the Milky Way like this. This is a smoothed map of the loop 1 and loop2. If the loop 1 and 2 are located in the NGC 253, In the observation of Sakamoto et al. (2006) by using SMA these loops can be seen like this while the transition is different. Sakamoto et al. (2006) argued that here and here there are super bubbles. I call this A and this B.
 Jy/beam km/s. A. B. Same size and. resolution with. Sakamoto et al. (2006) Now, we have found several molecular loops magnetically floated by the parker instability in the center of the Milky Way. Of course we have a question on this phenomenon. If the Milky Way is a typical spiral galaxy, the molecular loops should exist in other distant galaxies. Here I present an example of nearby nearly edge-on galaxy, NGC 253. This is a J-Ks image of the NGC 253. Sakamoto et al. (2006) have observed a center of the NGC253 here by 2-1 line of CO and its isotopes. This is an intensity map of the center region of NGC253 in 12CO(J=2-1). We can see a gas condensation similar to the center of the Milky Way like this. This is a smoothed map of the loop 1 and loop2. If the loop 1 and 2 are located in the NGC 253, In the observation of Sakamoto et al. (2006) by using SMA these loops can be seen like this while the transition is different. Sakamoto et al. (2006) argued that here and here there are super bubbles. I call this A and this B.")
42
ALMA from 2012

Similar presentations


, ν, Ω S Unknowns: V, T K, N X, M H 2, n H 2 –V velocity field –T K kinetic.>")
, Glen Petitpas, Alison Peck, Melanie.>")
 Hidehiro Kaneda (Nagoya Univ.) Takashi Onaka (Tokyo Univ.)>")


>")


 & Neal. J. Evans II (Univ.>")

 & NANTEN team ASTE team Mopra – ATNF team.>")

 M101 銀河 Suzuki et al. (2010b) M101 Stephan’s Quintet.>")