Download presentation
Presentation is loading. Please wait.

1
The Risk of Hypoxia in Narragansett Bay A Synthesis of Available Data

2
Objectives: To assess whether hypoxia poses a risk to aquatic life in Upper Narragansett Bay Obtain an estimate of the spatial extent of this risk Outline some approaches to integration of existing dissolved oxygen datasets with the EPA saltwater DO criteria (2000)
")
3
Available Data “Insomniac” surveys – Prell, Deacutis, Murray (1999- 2003) Nu-shuttle cruises – Berman, Oviatt, Melrose (1998- 2004) Monitoring Buoys – Bergondo, Kester (1999-2004) Ambient Aquatic Life Water Quality Criteria for Dissolved Oxygen (Saltwater): Cape Cod to Cape Hatteras – EPA (2000)
 Nu-shuttle cruises – Berman, Oviatt, Melrose ( ) Monitoring Buoys – Bergondo, Kester ( ) Ambient Aquatic Life Water Quality Criteria for Dissolved Oxygen (Saltwater): Cape Cod to Cape Hatteras – EPA (2000)")
4
Data Types and Limitations SpatialTemporal HorizontalVertical Insomniac Surveys Extensive 75+ stations throughout the upper bay Extensive Roughly 1.5 m depth intervals Limited 2-3 surveys per summer Nu-Shuttle Cruises Limited Only deep channels sampled ExtensiveLimited ~ 1 survey per month Monitoring Buoys Limited 5-10 locations in NB 1999-2003 Limited Surface and bottom instruments Extensive 15 minute sampling interval

5
What do the EPA Criteria Tell Us EPA criteria address both growth and mortality for different life stages: –Larvae – growth and mortality effects are incorporated into a larval recruitment model –Juveniles and Adults are considered together Both persistent and cyclic/episodic hypoxia are accounted for in the criteria

6
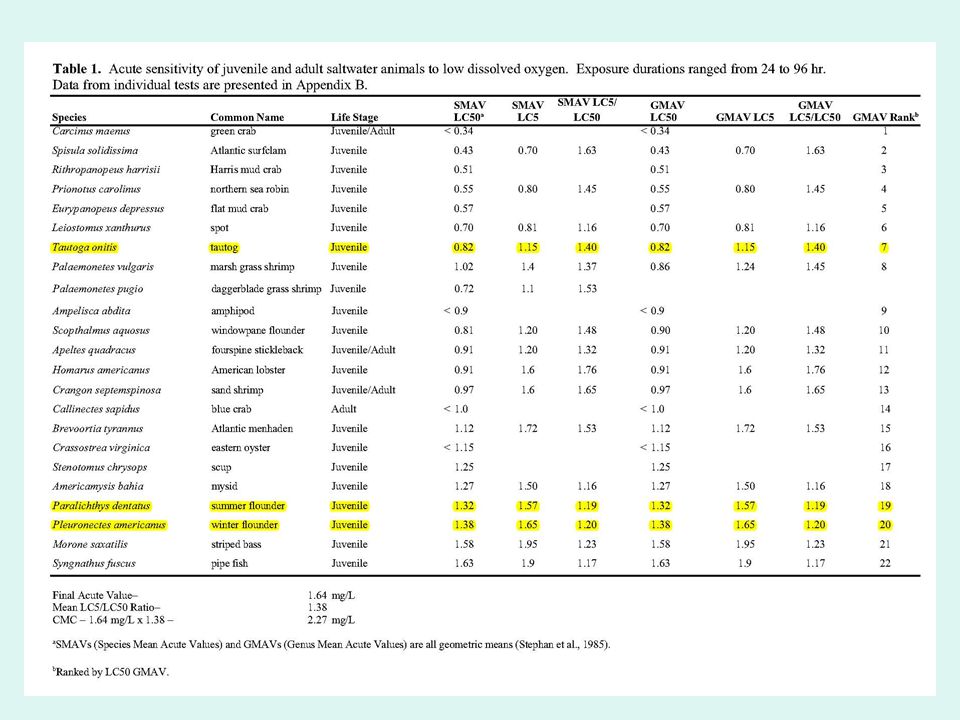
Experimental Mortality Data Plot from the EPA criteria document including protective limits Shows DO concentrations associated with 50% mortality (LC50) for species that commonly inhabit estuaries between Cape Cod and Cape Hatteras 2.9 mg/L - Limit for Protection against Larval Mortality 2.3 mg/L Limit for Protection against Juvenile Mortality Winter flounder Tautog
 for species that commonly inhabit estuaries between Cape Cod and Cape Hatteras 2.9 mg/L - Limit for Protection against Larval Mortality 2.3 mg/L Limit for Protection against Juvenile Mortality Winter flounder Tautog")
9
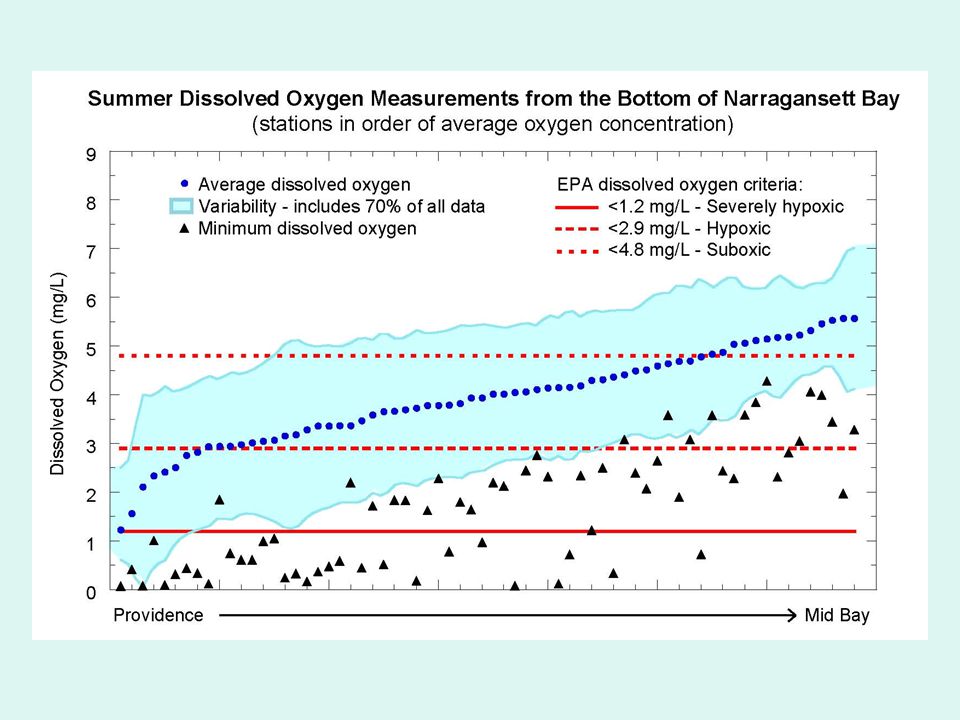
Average bottom DO in most of the Upper Bay is in a range known to cause harm to aquatic life DO divisions based upon larval protection limits

10
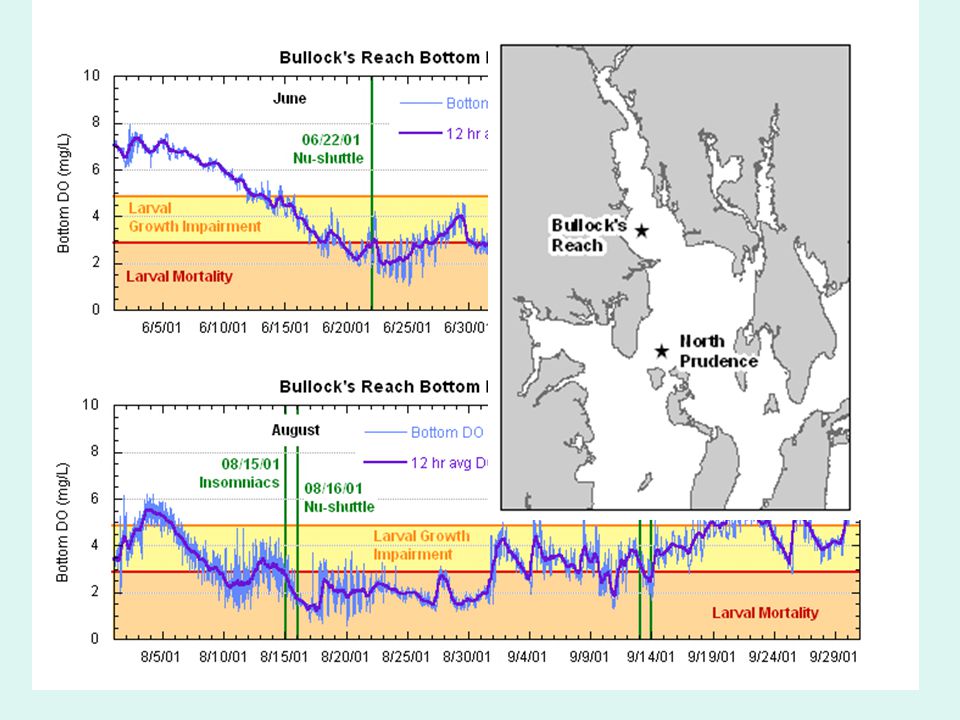
Where the July and August Insomniac surveys fit into the structure of a hypoxic event at the Bullock’s Reach buoy

11
Large regions of the bay show a coherent pattern with DO measured at the Bullock’s Reach Buoy

12
Deep stations are generally well correlated within a given region of the bay

13
Cross section of the shipping channel from the Providence River to the south end of Prudence Island Transects show DO (color contours) and density (σ t ) In this case – the Nu- shuttle cruise occurred 4 days after the Insomniac survey
 and density (σ t ) In this case – the Nu- shuttle cruise occurred 4 days after the Insomniac survey")
14
Conclusions Aquatic life in Upper Narragansett Bay is at risk from hypoxia - both mortality and growth effects The spatial extent of this risk is large – including almost all areas northward from the south tip of Prudence Island Integration of the existing data can provide information about patterns of hypoxia in Upper Narragansett Bay and guide future monitoring efforts

15
Acknowledgements Many thanks for the free exchange of data and ideas: Deanna BergondoMark Berman Dana Kester Chris Melrose Chris Deacutis Heather Stoffel Warren PrellHeidi Travers David MurrayRobin Weber Don PryorCatherine Walker Candace OviattPeter August

16
Additional Material

17
Comparison of Insomniac Summer Averages and Summer Averages from Monitoring Buoys The Insomniacs data and Buoy data are completely independent, yet they give a very similar summer average at the Bullock’s Reach and North Prudence Buoy sites Bullock’s DO (mg/L) N. Prudence DO (mg/L) Avg. from Nearby stations 3.363.67 1999-4.51 20013.283.70 20023.454.20 20033.203.00 Avg. from Buoy Data 3.313.85
 Avg. from Nearby stations Avg. from Buoy Data")
18
Larval Time-to-death Curves from the EPA criteria These time-to-death curves are based upon studies done on larvae Mortality after 24 hours does not increase significantly at a given DO concentration

20
Absolute Minimum DO measured at each station in any “Insomniac” Survey. Note that areas in red are below 1.2 mg/L (from the EPA VPDO criteria Implementation Guidance document)
.")
21
Large regions of the bay show a coherent pattern with DO measured at the Bullock’s Reach Buoy

22
Deep stations in different regions of the bay are generally very well correlated

23
GSO dock does not show on this slide Roger Williams is a future location

Similar presentations


: 1.>")


 CHRP October 8, 2009.>")