Download presentation
Presentation is loading. Please wait.

1
Business Across Borders Objectives of this session –Define “international.” –Introduce the key international business (IB) transactions and entities. –Analyze the factors that make international business more costly than domestic business and—potentially—more rewarding: The six forms of separation.

2
Transactions Current Account –Goods –Services –Income payments Financial Account –Portfolio Investment –Direct Investment Foreign exchange transactions underlie these transactions

3
Goods transactions The transfer of ownership of a tangible and moveable object. Trade is usually accompanied by the transfer of “title of ownership.” Identifying the “nationality” of a good can be tricky because portions of goods are produced in different countries.

4
Services transactions Def.: Actions performed by a provider that benefit a consumer. Balance of payments transactions are based on the residence test. They include: –a lawyer resident in Canada giving legal advice via phone, email, fax to a client in the United States –Chinese accountants travelling to Canada to learn about international business from an American who is resident in Canada WTO covers other modes of service provision as well: –“Commercial presence” covers services provided by foreign branches and subsidiaries

5
Service categories used by WTO (1) business (including professional and computer) (2) communication (3) construction and related engineering (4) distribution (5) educational (6) environmental (7) financial (insurance and banking) (8) health-related and social services (9) tourism and travel-related (10) recreational, cultural, and sporting (11) transport (12) other
 business (including professional and computer) (2) communication (3) construction and related engineering (4) distribution (5) educational (6) environmental (7) financial (insurance and banking) (8) health-related and social services (9) tourism and travel-related (10) recreational, cultural, and sporting (11) transport (12) other")
6
Income payments Primarily payments to foreign investors –Dividends –Interest payments

7
Financial account The financial account records changes in foreign ownership of assets Direct investment occurs when ownership involves “an effective voice in management.” –The International Monetary Fund recommends 10% equity as the critical share necessary for “an effect voice” Portfolio investments are “passive” Multinational enterprises (MNEs) are defined as companies with direct investment
 are defined as companies with direct investment")
8
Canada’s IB transactions in 2008, $Cdn Transaction+ Money in (Bn$)- Money out (Bn$) Goods (exports+)489.9443.0 Services (exports+)70.593.0 Income (receipts+)71.786.9 Portfolio (inward+)29.0-13.6 Direct (inward+)47.783.9
- Money out (Bn$) Goods (exports+) Services (exports+) Income (receipts+) Portfolio (inward+) Direct (inward+)")
9
China’s IB transactions in 2008, $US Transaction+ Money in (Bn$)- Money out (Bn$) Goods (exports+)1434.61073.9 Services (exports+)147.1158.9 Income (receipts+)91.660.2 Portfolio (inward+)67.725.0 Direct (inward+)163.168.7
- Money out (Bn$) Goods (exports+) Services (exports+) Income (receipts+) Portfolio (inward+) Direct (inward+)")
10
Test your knowledge of international trade What is the ratio of world exports (goods and services) to world GDP in 2007? (10%, 30%, 50%) What is the ratio of world service exports to world goods trade in 2007? (10%, 23%, 53%) Name 3 of the top 5 exporting countries in the world Name 3 of the top 5 countries with the highest exports to GDP ratios What are Canada’s leading imports, exports? What is the U.S. share of 2007 Canadian exports (50%, 65%, 80%)? What are China’s leading imports, exports? What country receives the most Chinese exports? What country does China import most from?
 What is the ratio of world service exports to world goods trade in (10%, 23%, 53%) Name 3 of the top 5 exporting countries in the world Name 3 of the top 5 countries with the highest exports to GDP ratios What are Canada’s leading imports, exports. What is the U.S. share of 2007 Canadian exports (50%, 65%, 80%). What are China’s leading imports, exports. What country receives the most Chinese exports. What country does China import most from .")
12
Top Goods Exporters, 2008, US$ bill. CountryExports Germany1498.2 China1434.6 United States1295.4 Japan746.5 France601.8 Italy546.9 Netherlands534.1 Russian Federation471.6 Canada462.7 Korea, Rep.433.5 Belgium373.0 Hong Kong, China365.2

13
Top Goods Importers, 2008, US$ bill. CountryImports United States2166.0 Germany1206.2 China1133.0 Japan762.0 France707.7 United Kingdom631.9 Netherlands573.9 Italy556.3 Belgium469.9 Korea, Rep.435.3 Canada418.3 Spain402.3

14
Goods Trade Balances, 2008, US$ bill. CountryBalance China295.4 Germany259.0 Saudi Arabia217.1 Russian Federation179.8 Norway78.9 United Arab Emirates72.7 Turkey-70.0 France-99.0 India-112.5 Spain-134.2 United Kingdom-173.9 United States-865.5

16
China’s Exaggerated Trade Surplus with the U.S. China (assembly) USA Korea Parts $100 Final goods $110 China registers a $110 export to USA but there is only $10 of Chinese value added!
 USA Korea Parts $100 Final goods $110 China registers a $110 export to USA but there is only $10 of Chinese value added!.")
17
Top Service Exporters, 2008, US$ bill. CountryExports United States540.4 Germany246.7 France161.7 Japan148.8 China147.1 Spain143.6 Italy123.5 Netherlands104.5 Ireland99.3 Hong Kong, China92.5 Belgium88.6 Switzerland76.9

18
Top Service Importers, 2008, US$ bill. CountryImports United States404.7 Germany285.0 Japan169.5 China158.9 France140.7 Italy134.4 Ireland106.2 Spain104.4 Korea, Rep.92.7 Netherlands91.6 Canada87.7 Belgium82.2

19
Service Trade Balances, 2008, US$ bill. CountryBalance United States135.7 Hong Kong, China46.6 Switzerland40.1 Spain39.2 Luxembourg28.6 Greece25.6 Brazil-16.7 Korea, Rep.-16.7 Japan-20.8 Canada-21.3 Russian Federation-25.0 Germany-38.2

20
Rank Country AmountAmount (top to bottom) #1 Singapore173.56 #11 Belgium84.42 #22 Thailand66.26 #23 Netherlands65.06 #55 Sweden46.45 #65 Canada43.81 #70 Indonesia41.08 #84 Russia36.81 #85 New Zealand36.74 #102 Spain29.92 #105 Poland29.12 #110 France27.91 #113 Mexico27.61 #115 United Kingdom27.12 #119 China25.83 #126 Australia22.85 #149 India13.65 #150 Brazil13.36 #158 United States11.24 #159 Japan10.44 Exports of Goods and Services as % of GDP
 #1 Singapore #11 Belgium84.42 #22 Thailand66.26 #23 Netherlands65.06 #55 Sweden46.45 #65 Canada43.81 #70 Indonesia41.08 #84 Russia36.81 #85 New Zealand36.74 #102 Spain29.92 #105 Poland29.12 #110 France27.91 #113 Mexico27.61 #115 United Kingdom27.12 #119 China25.83 #126 Australia22.85 #149 India13.65 #150 Brazil13.36 #158 United States11.24 #159 Japan10.44 Exports of Goods and Services as % of GDP")
21
Canadian Trade ($cdn billion) 20042005200620072008 Exports429.0450.2454.0463.1489.9 Agricultural and fishing products30.730.131.234.440.9 Energy products68.186.986.891.3125.8 Forestry products39.436.433.429.325.7 Industrial goods and materials78.084.294.2104.8111.5 Machinery and equipment91.193.093.393.493.0 Automotive products90.488.082.377.361.1 2004 2005 2006 2007 2008 Imports363.2387.8404.3415.2443.0 Agricultural and fishing products21.422.023.525.528.5 Energy products24.833.734.736.753.1 Forestry products3.23.1 3.02.9 Industrial goods and materials73.578.583.985.191.6 Machinery and equipment104.1110.9114.7116.7122.6 Automotive products77.478.479.879.972.0
 Exports Agricultural and fishing products Energy products Forestry products Industrial goods and materials Machinery and equipment Automotive products Imports Agricultural and fishing products Energy products Forestry products Industrial goods and materials Machinery and equipment Automotive products")
22
Canada Exports (billion $US) 20032004200520062007 U.S. 326.7348.1365.8359.3356.0 UK 6.17.78.310.112.8 China 4.86.87.17.79.3 Japan 8.28.69.29.49.2 Mexico 2.23.13.44.45.0 Netherlands 1.61.92.23.14.0 Total381.1412.3436.3440.3450.4 Canada Imports (billion $US) 20032004200520062007 U.S. 203.8209.0215.2217.6220.5 China 18.624.129.534.538.3 Mexico 12.213.414.616.017.2 Japan 13.813.514.815.315.5 Germany 8.69.410.311.111.5 UK 9.29.710.410.911.5 Total 336.1355.9380.9396.6406.7
 U.S China Mexico Japan Germany UK Total")
23
Chinese trade, 2006, $billion China’s exports United States305.8 Hong Kong153.7 Japan118.4 Germany54.5 Korea, Rep.44.1 Netherlands39.0 China’s imports Japan115.8 Korea, Rep.89.8 United States59.3 Germany37.9 Malaysia23.6 Australia19.2

24
Six Forms of Separation Political separation Physical separation Relational separation Environmental separation Developmental separation Cultural separation

25
Political Separation

26
Political Borders Impede Movement of goods: Customs Movement of people: Immigration Movement of money: Currency exchange Movement of capital: Regulation, Taxation

27
Political separation and standards Societies must adopt standards to ensure compatibility –currency –language –voltage –paper size These standards may vary across political boundaries

28
Different Keyboard Standards France’s AZERTY QWERTY

29
What share of the world drives on the left? 1/3 of the world’s population drives on the left! (so their cars should have steering wheels on the right)
.")
30
Standard changes are rare, but there are strong pressures to conform to practices of neighboring countries. BC (1922), New Brunswick (1922), Nova Scotia (1923), PEI (1924), and Newfoundland (1947) switched. Sweden switched twice! (in 1736 to the left and 1967 back to the right)
, New Brunswick (1922), Nova Scotia (1923), PEI (1924), and Newfoundland (1947) switched. Sweden switched twice. (in 1736 to the left and 1967 back to the right).")
31
AC Power Plugs U.K., Hong Kong, parts of Africa Europe, parts of Middle East Australia, China

32
“Metrication” everywhere (except US, Liberia, and Burma)
")
33
Paper sizes 210mm X 297mm (rest of world) 216mm X 279mm (US + Canada)
 216mm X 279mm (US + Canada)")
34
English is the 3 rd or 4 th most common native language. It is spoken/understood to some extent by 1/4 to 1/3 of the world English is an official language in 52 countries

35
Physical Separation Natural barriers to movement of goods, people, and information. –Oceans –Mountains –Distance: costs associated with transport (goods, people) and communication (information) costs Costs include shipping costs as well as time costs (inventory holding costs, costs of delay getting goods to customers)
 and communication (information) costs Costs include shipping costs as well as time costs (inventory holding costs, costs of delay getting goods to customers).")
36
Physical Separation

37
Relational Separation

38
Relationships, Trust, & Trade Ingredients for a profitable transaction –Matchmaking: profitable match between buyer and seller –Seller fulfills promise: must deliver good/service on time and in proper quantity and quality –Buyer fulfills promise: must pay seller For domestic transactions –How do sellers match to buyers? –What ensures buyer and seller fulfill promises? What difficulties exist when transaction is international?

39
Environmental Separation

41
Environmental Separation: Why? Foreign countries are far away (physical separation) Far away countries tend to be different –Temperature (distance to equator, coast, altitude) –Precipitation –Soil types and underground mineral reserves –Population density
 Far away countries tend to be different –Temperature (distance to equator, coast, altitude) –Precipitation –Soil types and underground mineral reserves –Population density.")
42
Environmental Separation: So What? Differences create opportunities (counter- seasonal fruit exports from Chile, Saudi oil) Differences change consumer demands –Trucks in mountainous countries must have thicker axels, more likely to prefer diesel engines. –Trucks in dense countries must have a tight turning radius.
 Differences change consumer demands –Trucks in mountainous countries must have thicker axels, more likely to prefer diesel engines. –Trucks in dense countries must have a tight turning radius..")
43
Developmental Separation

44
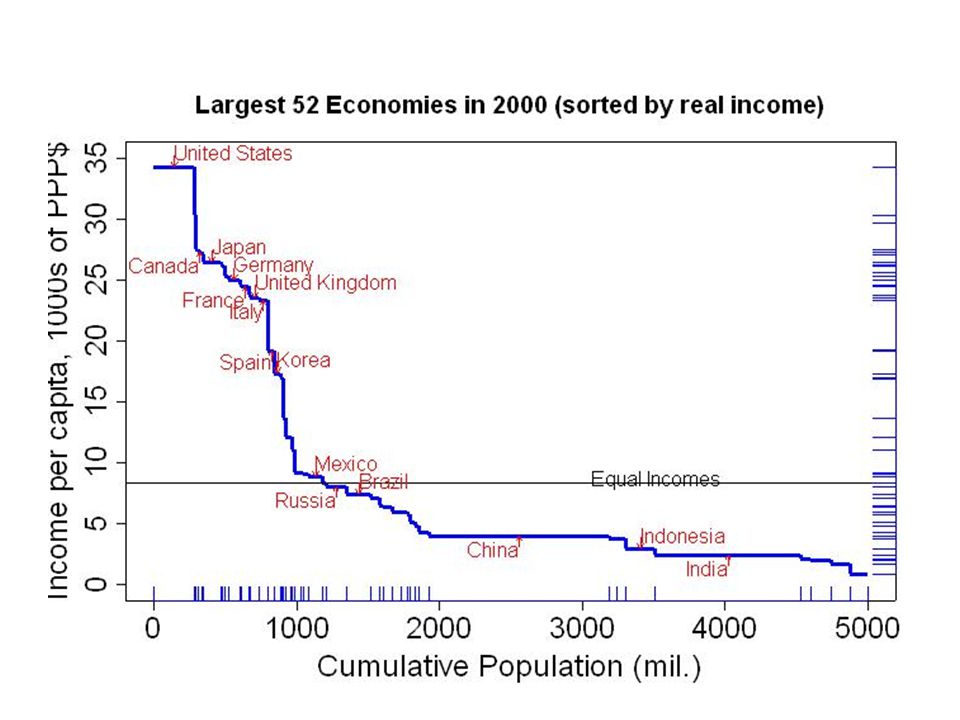
Developmental Separation: How to Measure it? Multiple indexes: Life expectancy, poverty, … –Canada: 79.2 years, 0% live on <$1/day –China: 70.2 years, 16% live on <$1/day –Indonesia: 66.2 years, 7.2% live on <$1/day –Nigeria: 51.8 years, 70% live on <$1/day Economists focus on real income per person (also known as per capita GDP)
.")
45
PPP

46
Developmental Separation

48
Developmental Separation: So What? Income differences affect how much consumers can purchase and also the attributes of goods that they demand. Incomes differences may reflect differences in skill levels. Poor countries may not be cheap countries if production requires high skills

49
Cultural Separation

50
Globalization International trade and investment has been growing over time. Of course, world output (GDP) has grown over time as well. Globalization occurs when international transactions increase more rapidly than GDP
 has grown over time as well. Globalization occurs when international transactions increase more rapidly than GDP.")
52
Growth of trade and GDP (1975=100)
")
53
Globalization of firms Foreign sales: many multinationals sell the majority of their products abroad. Often they employ more workers abroad than at home. Multinational vertical networks: multinationals have divided the product into (vertical) stages and dispersed these stages across the globe.
 stages and dispersed these stages across the globe..")
54
Article-One World Reasons for globalization (1) Falling transportation and communication costs (2) Reductions in trade barriers Historical perspective: Some countries were as “globalized” in 1914 as they are today. Labour is still somewhat immobile across countries.

Similar presentations


 2013 summary report Model developed by the Economist Intelligence Unit (EIU)>")


>")


