Download presentation
Presentation is loading. Please wait.

14
Data Transformation Data conversion Changing the original form of the data to a new format More appropriate data analysis New variables

15
Data Transformation Summative Score = VAR1 + VAR2 + VAR 3

21
Descriptive Analysis The transformation of raw data into a form that will make them easy to understand and interpret; rearranging, ordering, and manipulating data to generate descriptive information

22
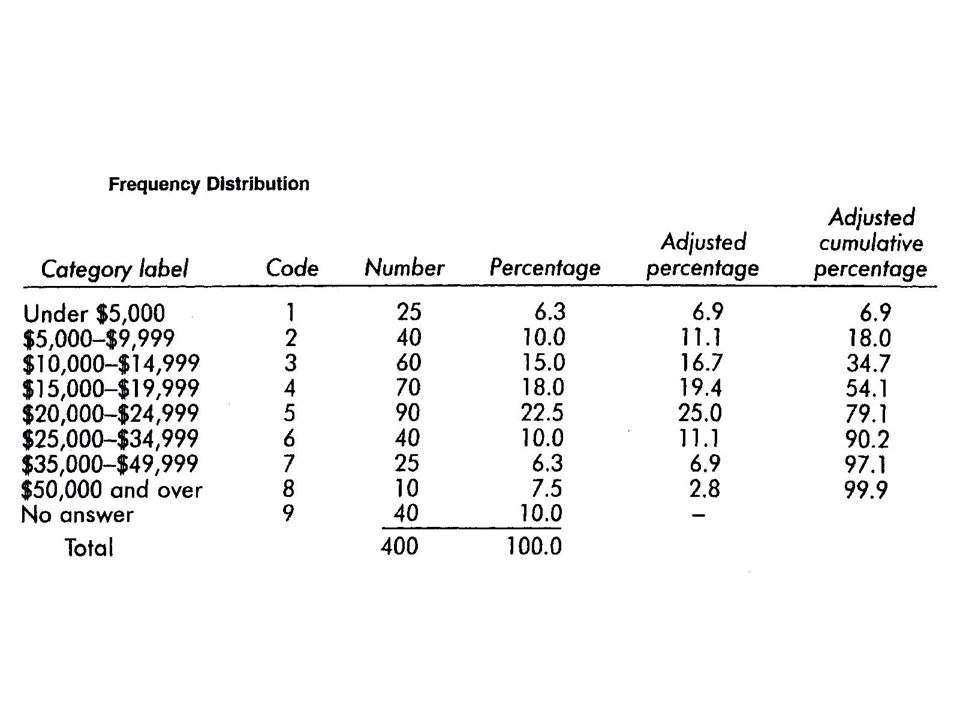
Tabulation Tabulation - Orderly arrangement of data in a table or other summary format Frequency table Percentages

23
Frequency Table The arrangement of statistical data in a row-and-column format that exhibits the count of responses or observations for each category assigned to a variable

24
Measure of CentralMeasure of Type of ScaleTendencyDispersion NominalModeNone OrdinalMedianPercentile Interval or ratioMeanStandard deviation Central Tendency

25
Base The number of respondents or observations (in a row or column) used as a basis for computing percentages
 used as a basis for computing percentages")
26
Index Numbers Score or observation recalibrated to indicate how it relates to a base number CPI - Consumer Price Index

27
Measures of Central Tendency Mean - arithmetic average –µ, Population;, sample Median - midpoint of the distribution Mode - the value that occurs most often

28
Population Mean

29
Sample Mean

30
Measures of Dispersion or Spread Range Mean absolute deviation Variance Standard deviation

31
The Range as a Measure of Spread The range is the distance between the smallest and the largest value in the set. Range = largest value – smallest value

32
Deviation Scores The differences between each observation value and the mean:

33
150 160 170 180 190 200210 5432154321 Low Dispersion Value on Variable Frequency Low Dispersion Verses High Dispersion

34
150 160 170 180 190 200210 5432154321 Frequency High dispersion Value on Variable Low Dispersion Verses High Dispersion

35
Average Deviation

36
Mean Squared Deviation

37
The Variance

38
Variance

39
The variance is given in squared units The standard deviation is the square root of variance:

40
Sample Standard Deviation

41
The Normal Distribution Normal curve Bell shaped Almost all of its values are within plus or minus 3 standard deviations I.Q. is an example

42
2.14% 13.59% 34.13% 13.59% 2.14% Normal Distribution

43
85115 100 14570 Normal Curve: IQ Example

44
Standardized Normal Distribution Symetrical about its mean Mean identifies highest point Infinite number of cases - a continuous distribution Area under curve has a probability density = 1.0 Mean of zero, standard deviation of 1

45
Standard Normal Curve The curve is bell-shaped or symmetrical About 68% of the observations will fall within 1 standard deviation of the mean About 95% of the observations will fall within approximately 2 (1.96) standard deviations of the mean Almost all of the observations will fall within 3 standard deviations of the mean
 standard deviations of the mean Almost all of the observations will fall within 3 standard deviations of the mean")
46
0 1 -2 2 z A Standardized Normal Curve

47
The Standardized Normal is the Distribution of Z –z+z

48
Standardized Scores

49
Standardized Values Used to compare an individual value to the population mean in units of the standard deviation

50
Linear Transformation of Any Normal Variable into a Standardized Normal Variable -2 -1 0 1 2 Sometimes the scale is stretched Sometimes the scale is shrunk X

Similar presentations


 Statistics Percentages (frequencies) Ratios and Rates Measures of Central Tendency Measures of Variability Descriptive statistics.>")


>")


