Download presentation
Presentation is loading. Please wait.

1
Traffic Studies TS4273 TRAFFIC ENGINEERING

2
Reasons To Collect Data 1.Managing the physical system (replaced, repaired, anticipated schedule) 2.Investigating trends over time (forecast future transportation needs) 3.Understanding the needs & choice of the public & industry (nature of travel demand)
 2.Investigating trends over time (forecast future transportation needs) 3.Understanding the needs & choice of the public & industry (nature of travel demand)")
3
Reasons To Collect Data [cont’d] 4.Calibrating basic relationships or parameters (perception-reaction time, discharge headways at a signalized intersection, headway & spacing relationship) 5.Assessing the effectiveness of improvements (before & after study)
![Reasons To Collect Data [cont’d] 4.Calibrating basic relationships or parameters (perception-reaction time, discharge headways at a signalized intersection, headway & spacing relationship) 5.Assessing the effectiveness of improvements (before & after study)](http://images.slideplayer.com/16/5184570/slides/slide_3.jpg "Reasons To Collect Data [cont’d] 4.Calibrating basic relationships or parameters (perception-reaction time, discharge headways at a signalized intersection, headway & spacing relationship) 5.Assessing the effectiveness of improvements (before & after study)")
4
6.Assessing potential impacts (traffic impact assessment) 7.Evaluating facility or system performance (periodically studies to determine quantity and quality of accessibility and/or mobility service to the public) Reasons To Collect Data [cont’d]
![6.Assessing potential impacts (traffic impact assessment) 7.Evaluating facility or system performance (periodically studies to determine quantity and quality of accessibility and/or mobility service to the public) Reasons To Collect Data [cont’d]](http://images.slideplayer.com/16/5184570/slides/slide_4.jpg "6.Assessing potential impacts (traffic impact assessment) 7.Evaluating facility or system performance (periodically studies to determine quantity and quality of accessibility and/or mobility service to the public) Reasons To Collect Data [cont’d]")
5
Type Of Studies 1.Volume Studies (the most basic traffic studies) 2.Speed Studies (safety concern) 3.Travel-time Studies (measure quality of service) 4.Delay Studies (parts of travel time that user find particularly annoying)
 2.Speed Studies (safety concern) 3.Travel-time Studies (measure quality of service) 4.Delay Studies (parts of travel time that user find particularly annoying)")
6
Type Of Studies 5.Density Studies (rarely direct measured) 6.Accident Studies (accident characteristics, causal factor, specific location) 7.Parking Studies (inventories or parking supply, parking accumulations 8.Good Movement & Transit Studies (truck loading facilities & transit systems)
 6.Accident Studies (accident characteristics, causal factor, specific location) 7.Parking Studies (inventories or parking supply, parking accumulations 8.Good Movement & Transit Studies (truck loading facilities & transit systems)")
7
Type Of Studies 9.Pedestrian Studies (crosswalks at signalized/un-signalized locations) 10.Calibration Studies 11.Observance Studies (effectiveness of various traffic controls)
 10.Calibration Studies 11.Observance Studies (effectiveness of various traffic controls)")
8
VOLUME, DEMAND AND CAPACITY Volume Volume, number of vehicles (persons) passing a point during a specified time period which is usually one hour. Demand Demand, number of vehicles (persons) that desire to travel past a point during a specified period also usually one hour.
 that desire to travel past a point during a specified period also usually one hour..")
9
VOLUME, DEMAND AND CAPACITY Capacity Capacity, maximum rate at which vehicle can traverse a point or short segment during a specified time period Theoretically, actual volume can never be observed at levels higher than the true capacity of the section.

10
VOLUME, DEMAND AND CAPACITY

11
Spot Speed Studies Typical purposes of speed studies –Speed trends over time –Traffic control planning –Before-and-after studies –Crash analyses –Geometric design –Research studies

12
Study Locations Consistent with study purpose Not where vehicles are accelerating or decelerating Data collectors must not influence vehicle speeds Factors that influence speeds –Physical conditions –Environment –Heavy traffic –Enforcement activity

13
Selecting the Sample Random but representative At least 100 vehicles per lane Free-flowing vehicles only Common sampling errors –Always selecting platoon leader –Too many trucks –High proportion of speeders –Other events

14
Collection Of Spot Speeds Usually cannot collect all vehicles Random sample Systematic Errors and Solutions –Error – looking for “fastest” vehicle Solution – Sample every nth vehicle –Error – too many heavy vehicle measurements Solution – same as above – sample every n th vehicle –Error – Inclusion of vehicle following platoon leader Solution – Don’t include vehicles following too closely (200’ if < 40 mph, and 350’ otherwise)
")
15
Spot Speed Studies Speed characteristics from a spot speed study may be used to: –Establish parameters for traffic operation and control, such as speed zones, speed limit (85 th percentile speed is commonly used as the speed limit on a road), and passing restriction. –Evaluate the effectiveness of traffic control devices, such as variable message signs at work zones. –Monitor the effect of speed enforcement programs such as the use of drone radar and the use of differential speed limits for passenger cars and trucks.

16
Spot Speed Studies Speed characteristics from a spot speed study may be used to: –Evaluate and or determine the adequacy of highway geometric characteristics such as radii of horizontal curves and lengths of vertical curves. –Evaluate the effect of speed on highway safety through the analysis of crash data for different speed characteristics. –Determine speed trends. –Determine whether complaints about speeding are valid.

17
Methods of Conducting Spot Speed Studies Road Detectors –Pneumatic road tubes

18
Methods of Conducting Spot Speed Studies Road Detectors –Inductive loop

19
Road Tubes for Collection of Spot Speed Recorder

20
Radar Gun Spot Speed Study

21
Bias in Radar Measurements Vehicle Radar beam True Speeds (mph) Angle30 5070 ( o ) Measured Speeds (mph) 0305070 529.949.869.7 1029.549.268.9 2028.246.765.8 4521.235.449.5
 Angle ( o ) Measured Speeds (mph)")
22
Cosine Correction Minimize cosine error by keeping angle <7 o on freeways, <9 o on urban streets

23
Methods of Conducting Spot Speed Studies Doppler-Principle Meters

24
Methods of Conducting Spot Speed Studies Electronic-Principle Detectors

25
Volume Studies Traffic volume studies are conducted to collect data on the number of vehicles and/or pedestrians that pass a point on a highway facility during a specified time period. This time period varies from as little as 15 min to as much as a year, depending on the anticipated use of the data. The data collected may also be put into subclasses which may include directional movement, occupancy rate, vehicle classification, and pedestrian age.

26
Volume Studies Traffic volume studies are usually conducted when certain volume characteristics are needed, some of which follow: Average Annual Daily Traffic (AADT) Average Daily Traffic (ADT) Peak Hour Volume (PHV) Vehicle Classification (VC) Vehicle Miles of Travel (VMT)
 Average Daily Traffic (ADT) Peak Hour Volume (PHV) Vehicle Classification (VC) Vehicle Miles of Travel (VMT)")
27
Methods of Conducting Volume Counts Manual Method

28
Hand-held Traffic Data Collectors http://www.jamartech.com/TMBs.html

29
Methods of Conducting Volume Counts Automatic Method

30
Methods of Conducting Volume Counts Automatic Method

31
Type of Volume Counts Cordon Counts When information is required on vehicle accumulation within an area, such as the central business district (CBD) of a city, particularly during a specific time, a cordon count is undertaken. The area for which the data are required is cordoned off by an imaginary closed loop; the area enclosed within this loop is defined as the cordon area.

32
Cordon Counts

33
Type of Volume Counts Screen Line Counts In screen line counts, the study area is divided into large sections by running imaginary lines, known as screen lines, across it. In some cases, natural and man-made barriers, such as rivers or railway tracks, are used as screen lines Traffic counts are then taken at each point where a road crosses the screen line. It is usual for the screen lines to be designed or chosen such that they are not crossed more than once by the same street.

34
Screen Line Counts

35
Cordon and Screenline Counts

36
Type of Volume Counts Intersection Counts Intersection counts are taken to determined vehicle classification through movements and turning movements at intersections. These data are used mainly in determining phase lengths and cycle times for signalized intersections, in the design of channelization at intersections, and in the general design of improvements to intersections.

37
Turning Movement Surveys

38
Dari\Ke1234Oi 1265420100 2524571600 3409070200 4567322700 Dd507891006611600

39
Type of Volume Counts Pedestrian Volume Counts Volume counts of pedestrians are made at locations such as subway stations, mid-blocks, and crosswalks. The counts are usually taken at these locations when the evaluation of existing or proposed pedestrian facilities is to be undertaken. Such facilities may include pedestrian overpass or underpasses.

40
Type of Volume Counts Periodic Volume Counts In order to obtain certain traffic volume data, such as AADT, it is necessary to obtain data continuously. However, it is not feasible to collect continuous data on all roads because of the cost involved.

41
Type of Volume Counts Periodic Volume Counts To make reasonable estimates of annual traffic volume characteristics on an area-wide basis, different types of periodic counts, with count durations ranging from 15 min to continuous, are conducted; the data from these different periodic counts are used to determine values that are the used to estimate annual traffic characteristics. The periodic counts usually conducted are continuous, control, or coverage counts.

42
TYPICAL COUNTING PERIODS 24-hour 1 or more 24-hour periods 16-hour 6 am – 10 pm (90-95% of daily traffic) 12-hour 7 am – 7 pm (about 75% of daily traffic) Peak-periods 7 am – 9 am and 4 pm – 6 pm Weekend 6 pm Friday – 6 am Monday
 12-hour 7 am – 7 pm (about 75% of daily traffic) Peak-periods 7 am – 9 am and 4 pm – 6 pm Weekend 6 pm Friday – 6 am Monday")
43
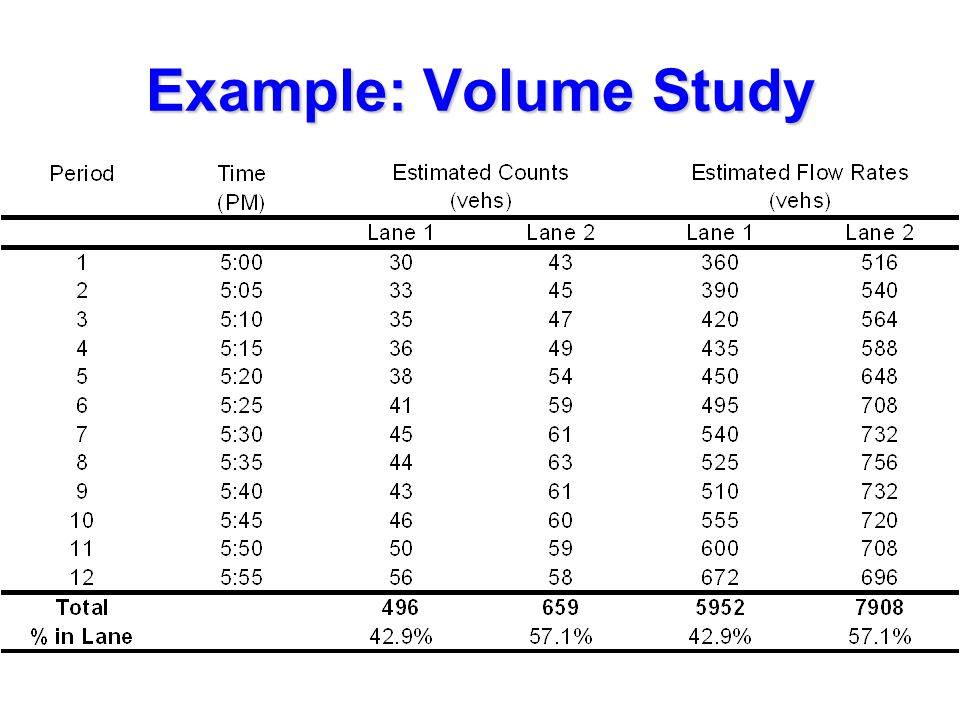
Example: Volume Study

45
Applications of Travel Time and Delay Data The data obtained from travel time and delays studies may be used in any one of the following traffic engineering tasks: –Determination of the efficiency of a route with respect to its ability to carry traffic. –Identification of locations with relatively high delays and the causes for those delays. –Performance of before-and-after studies to evaluate the effectiveness of traffic operation improvements

46
Applications of Travel Time and Delay Data –Determination of relative efficiency of a route by developing sufficiency ratings or congestion indices –Determination of travel times on specific links for use in trip assignment models –Compilation of travel time data that may be used in trend studies to evaluate the changes in efficiency and level of service with time. –Performance of economics studies in the evaluation of traffic operation alternatives that reduce travel times.

47
Benefits of Travel Time & Delay Studies It provides real-time data on the operations of roadways. It can be used to determine capacity deficiencies which can be translated into future capital improvement projects. If data is collected yearly, historical data can be assembled which can help determine deteriorating capacity trends and therefore potential future projects.

48
Benefits of Travel Time & Delay Studies It can be used to compare before and after conditions for completed capacity improvement projects. It provides data to calibrate traffic studies done within the County. It can assist the Traffic Concurrency approval process.

49
Methods for Conducting Travel Time and Delay Studies Methods requiring a test vehicle –Floating-car technique –Average-speed technique –Moving-vehicle technique Methods not requiring a test vehicle –License-plate observations –Interviews

50
Methods for Conducting Travel Time and Delay Studies Methods requiring a test vehicle –Floating-car technique In this method, the test car is driven by an observer along the test section so that the test car “floats” with the traffic. The driver of the test vehicle attempts to pass as many vehicles as those that pass his test vehicle The time taken to traverse the study section is recorded. This is repeated, and the average time is recorded as the travel time.

51
Methods for Conducting Travel Time and Delay Studies Methods requiring a test vehicle –Average-speed technique This technique involves driving the test car along the length of the test section at a speed that, in the opinion of the driver, is the average speed of the traffic stream. The time required to traverse the test section is noted. The test run us repeated for the minimum number of times, and the average time is recorded as the travel time.

52
Methods for Conducting Travel Time and Delay Studies Methods requiring a test vehicle –Moving-vehicle technique In this technique, the observer makes a round trip on a test section like: where it is assumed that the road runs east-west. X X Y Y Westbound Eastbound

53
Methods for Conducting Travel Time and Delay Studies Methods requiring a test vehicle –Moving-vehicle technique The observer starts collecting the relevant data at section X-X, drives the car eastward to section Y-Y, and the turns the vehicle around and drives westward to section X-X again. X X Y Y Westbound Eastbound

54
Methods for Conducting Travel Time and Delay Studies Methods requiring a test vehicle –Moving-vehicle technique The following data are collected as the test vehicle makes the round trip: The time it takes to travel east from X-X to Y-Y (T e ), in minutes. X X Y Y Westbound Eastbound

55
Methods for Conducting Travel Time and Delay Studies Methods requiring a test vehicle –Moving-vehicle technique The time it takes to travel west from Y-Y to X-X (T w ), in minutes. The number of vehicles traveling west in the opposite lane while the test car is traveling east (N e ). X X Y Y Westbound Eastbound
. X X Y Y Westbound Eastbound.")
56
Methods for Conducting Travel Time and Delay Studies Methods requiring a test vehicle –Moving-vehicle technique The number of vehicles that overtake the test car while it is traveling west from Y-Y to X-X, that is, traveling in the westbound direction (O w ). X X Y Y Westbound Eastbound

57
Methods for Conducting Travel Time and Delay Studies Methods requiring a test vehicle –Moving-vehicle technique The number of vehicles that the test car passes while it is traveling west from Y-Y to X-X, that is, traveling in the westbound direction (P w ). X X Y Y Westbound Eastbound

58
Methods for Conducting Travel Time and Delay Studies Methods requiring a test vehicle –Moving-vehicle technique The volume (V w ) in the westbound direction can then be obtained from the expression
 in the westbound direction can then be obtained from the expression")
59
Methods for Conducting Travel Time and Delay Studies Methods requiring a test vehicle –Moving-vehicle technique Similarly, the average travel time in the westbound direction is obtained from:

60
Data from Travel Time Study Using the Moving-Vehicle Technique

62
Volume and Travel Time Study Using the Moving-Vehicle Technique Average number of vehicle traveling eastward when test vehicle is traveling westward (N w ) = 82,25 Average number of vehicles that overtake test vehicle while it is traveling westward (O w ) = 1,25 Average number of vehicles that overtake test vehicle while it is traveling eastward (O e ) = 1,00
 = 82,25 Average number of vehicles that overtake test vehicle while it is traveling westward (O w ) = 1,25 Average number of vehicles that overtake test vehicle while it is traveling eastward (O e ) = 1,00")
63
Volume and Travel Time Study Using the Moving-Vehicle Technique Average number of vehicle the test vehicles passes while traveling westward (P w ) = 0,875 Average number of vehicle the test vehicles passes while traveling eastward (P e ) = 1,5
 = 0,875 Average number of vehicle the test vehicles passes while traveling eastward (P e ) = 1,5")
64
Volume and Travel Time Study Using the Moving-Vehicle Technique Volume in the westbound direction:

65
Volume and Travel Time Study Using the Moving-Vehicle Technique Volume in the eastbound direction:

66
Volume and Travel Time Study Using the Moving-Vehicle Technique Average travel time in the westbound direction: Average travel time in the eastbound direction:

67
Methods for Conducting Travel Time and Delay Studies Methods not requiring a test vehicle –License-plate observations The license-plate method requires that observers be positioned at the beginning and end of the test section. Observers can be also positioned at other location if elapsed times to those locations are required. Each observer records the last three or four digits of the license-plate of each car that passes, together with the time at which the car passes.

68
Methods for Conducting Travel Time and Delay Studies Methods not requiring a test vehicle –Interview The interviewing method is carried out by obtaining information from people who drive on the study site regarding their travel times, their experience of delays, and so forth. This method facilitates the collection of a large amount of data in a relatively short time. However, it requires the cooperation of the people contacted, since the result depends entirely on the information given by them.

69
Origin-Destination Studies Common Application Weaving Freeway (toll plaza) Major activity center
 Major activity center")
70
Origin-Destination Studies Common Method License Plate Post Card Roadside Interview Home Interview

72
Loop Detection Stations: Locations Pink bars designate vehicle detection stations Berkeley Highway Lab (BHL)
")
73
BHL Camera System (1/2) 4.5” Firewire camera Environmental enclosure Video server Fiber optics repeater Berkeley Highway Lab (BHL)
 4.5 Firewire camera Environmental enclosure Video server Fiber optics repeater Berkeley Highway Lab (BHL)")
74
Snapshots from BHL Cameras West Bound (locally South Bound) cameras in sequence, from West-most to closest to PPP East Bound (locally North Bound) cameras in sequence, from closest to PPP to East-most Berkeley Highway Lab (BHL)
 cameras in sequence, from West-most to closest to PPP East Bound (locally North Bound) cameras in sequence, from closest to PPP to East-most Berkeley Highway Lab (BHL)")
75
Current or Recent Projects Wireless sensors evaluation –2 lanes outfitted with Sensys Networks sensors –Evaluation metrics automatically generated by BHL software EVII: Early VII deployment Displaying Travel Times in District 4, pilot period NGSIM micro-traffic simulation project –See next slides VSN240-f Flush Mount Sensor Node AP240-e Access Point

76
Vehicle Tracking Application (1/2)...
...")
77
Vehicle Tracking Application (2/2)
")
78
Travel Time Measurements 1st Street 2nd Street 3rd Street Running Time Travel Time Travel Distance Vehicle Trajectory Running Speed

79
Traffic Studies TS4273 TRAFFIC ENGINEERING

Similar presentations


>")


>")
 Be able to.>")


 – Part II>")
