Download presentation
Presentation is loading. Please wait.

1
1 Heat Release in Combustion 朱 信 Hsin Chu Professor Dept. of Environmental Engineering National Cheng Kung University

2
2 1. Introducton It is important to be able to quantify the thermal changes which take place on the combustion of a fuel-hence we must look at the thermodynamics of the combustion process. It is important to be able to quantify the thermal changes which take place on the combustion of a fuel-hence we must look at the thermodynamics of the combustion process. Next slide (Fig. 3.1) An elementary open system within a boundary containing a working fluid, which is initially a mixture of fuel und air. The mixture could be ignited and burned at constant pressure (as occurs in boilers), or combustion could take place at constant volume. Next slide (Fig. 3.1) An elementary open system within a boundary containing a working fluid, which is initially a mixture of fuel und air. The mixture could be ignited and burned at constant pressure (as occurs in boilers), or combustion could take place at constant volume. Next slide (Fig. 3.1)combustion could take place at constant volume. Next slide (Fig. 3.1)combustion could take place at constant volume.
 An elementary open system within a boundary containing a working fluid, which is initially a mixture of fuel und air. The mixture could be ignited and burned at constant pressure (as occurs in boilers), or combustion could take place at constant volume. Next slide (Fig. 3.1) An elementary open system within a boundary containing a working fluid, which is initially a mixture of fuel und air. The mixture could be ignited and burned at constant pressure (as occurs in boilers), or combustion could take place at constant volume. Next slide (Fig. 3.1)combustion could take place at constant volume. Next slide (Fig. 3.1)combustion could take place at constant volume..")
4
4 2. Constant-pressure Combustion A combustion system must obey the First Law of Thermodynamics, but the application of this law may at first sight appear difficult owing to the change in chemical composition of the “working fluid” from a mixture of fuel and air to the resulting combustion products. A combustion system must obey the First Law of Thermodynamics, but the application of this law may at first sight appear difficult owing to the change in chemical composition of the “working fluid” from a mixture of fuel and air to the resulting combustion products. The application of the First Law to the open system of Fig. 3.1 gives, for each kg of working fluid, the following equation: (U 2 – U 1 ) + (P 2 V 2 – P 1 V 1 ) + g(Z 2 – Z 1 ) + ½(C 2 2 -C 1 2 ) = Q-W (1) The application of the First Law to the open system of Fig. 3.1 gives, for each kg of working fluid, the following equation: (U 2 – U 1 ) + (P 2 V 2 – P 1 V 1 ) + g(Z 2 – Z 1 ) + ½(C 2 2 -C 1 2 ) = Q-W (1)
 + (P 2 V 2 – P 1 V 1 ) + g(Z 2 – Z 1 ) + ½(C 2 2 -C 1 2 ) = Q-W (1) The application of the First Law to the open system of Fig. 3.1 gives, for each kg of working fluid, the following equation: (U 2 – U 1 ) + (P 2 V 2 – P 1 V 1 ) + g(Z 2 – Z 1 ) + ½(C 2 2 -C 1 2 ) = Q-W (1).")
5
5 The terms on the left-hand side are respectively the change in internal energy of the fluid (u), the “flow work” involved in propelling the fluid through the system (pv), the change in potential energy of the fluid (z) and finally its change in kinetic energy (c). The terms on the left-hand side are respectively the change in internal energy of the fluid (u), the “flow work” involved in propelling the fluid through the system (pv), the change in potential energy of the fluid (z) and finally its change in kinetic energy (c). The work done by the system (W), in the case of a boiler, is zero, so the right-hand side of the equation represents the amount of heat transferred into the system (Q). The work done by the system (W), in the case of a boiler, is zero, so the right-hand side of the equation represents the amount of heat transferred into the system (Q).
, the flow work involved in propelling the fluid through the system (pv), the change in potential energy of the fluid (z) and finally its change in kinetic energy (c). The work done by the system (W), in the case of a boiler, is zero, so the right-hand side of the equation represents the amount of heat transferred into the system (Q). The work done by the system (W), in the case of a boiler, is zero, so the right-hand side of the equation represents the amount of heat transferred into the system (Q)..")
6
6 The changes in potential and kinetic energy of the fluid can be considered negligible, so equation (1) simplifies to: (U 2 - U 1 ) + (P 2 V 2 – P 1 V 1 ) = Q The changes in potential and kinetic energy of the fluid can be considered negligible, so equation (1) simplifies to: (U 2 - U 1 ) + (P 2 V 2 – P 1 V 1 ) = Q The enthalpy of the fluid, H, is given by H = U+PV leading to a final form of the steady flow equation: H 2 – H 1 =Q (2) The enthalpy of the fluid, H, is given by H = U+PV leading to a final form of the steady flow equation: H 2 – H 1 =Q (2)
 simplifies to: (U 2 - U 1 ) + (P 2 V 2 – P 1 V 1 ) = Q The changes in potential and kinetic energy of the fluid can be considered negligible, so equation (1) simplifies to: (U 2 - U 1 ) + (P 2 V 2 – P 1 V 1 ) = Q The enthalpy of the fluid, H, is given by H = U+PV leading to a final form of the steady flow equation: H 2 – H 1 =Q (2) The enthalpy of the fluid, H, is given by H = U+PV leading to a final form of the steady flow equation: H 2 – H 1 =Q (2)")
7
7 This simple expression relates the heat transferred across the boundary of the system to the change in enthalpy of the fluid as it enters and leaves the system. This simple expression relates the heat transferred across the boundary of the system to the change in enthalpy of the fluid as it enters and leaves the system. We will see later how it leads to a very convenient method of measuring the efficiency of a boiler. We can approach this problem by considering separately the enthalpies of the reactants and the products. We will see later how it leads to a very convenient method of measuring the efficiency of a boiler. We can approach this problem by considering separately the enthalpies of the reactants and the products.

8
8 3. Enthalpy of a Mixture of Gases A change in the enthalpy of the reactants can be calculated by summing the enthalpy changes of each of the constituent gases. A change in the enthalpy of the reactants can be calculated by summing the enthalpy changes of each of the constituent gases. The change in enthalpy of a gas as a function of temperature is given by △ H = c p ( △ t) Which would at first sight appear to give a straight line relationship between enthalpy change and temperature difference. The change in enthalpy of a gas as a function of temperature is given by △ H = c p ( △ t) Which would at first sight appear to give a straight line relationship between enthalpy change and temperature difference.
 Which would at first sight appear to give a straight line relationship between enthalpy change and temperature difference. The change in enthalpy of a gas as a function of temperature is given by △ H = c p ( △ t) Which would at first sight appear to give a straight line relationship between enthalpy change and temperature difference..")
9
9 The temperature changes which occur in combustion are considerable; nitrogen, for example, could enter the combustion system at ambient temperature (25 ℃ ) and be heated in the flame to around 2,000 ℃. The temperature changes which occur in combustion are considerable; nitrogen, for example, could enter the combustion system at ambient temperature (25 ℃ ) and be heated in the flame to around 2,000 ℃. At the lower temperature nitrogen has a specific heat at constant pressure of 1.04 kJ/kg/K, rising to 1.30 kJ/kg/K at flame temperature. At the lower temperature nitrogen has a specific heat at constant pressure of 1.04 kJ/kg/K, rising to 1.30 kJ/kg/K at flame temperature. All gases have values of c p which increase with temperature, hence a property diagram relating the enthalpy of the reactants H R to their temperature will be curve similar to that in Fig. 3.2 (next slide). All gases have values of c p which increase with temperature, hence a property diagram relating the enthalpy of the reactants H R to their temperature will be curve similar to that in Fig. 3.2 (next slide).Fig. 3.2 (next slide).Fig. 3.2 (next slide).
 and be heated in the flame to around 2,000 ℃. At the lower temperature nitrogen has a specific heat at constant pressure of 1.04 kJ/kg/K, rising to 1.30 kJ/kg/K at flame temperature. At the lower temperature nitrogen has a specific heat at constant pressure of 1.04 kJ/kg/K, rising to 1.30 kJ/kg/K at flame temperature. All gases have values of c p which increase with temperature, hence a property diagram relating the enthalpy of the reactants H R to their temperature will be curve similar to that in Fig. 3.2 (next slide). All gases have values of c p which increase with temperature, hence a property diagram relating the enthalpy of the reactants H R to their temperature will be curve similar to that in Fig. 3.2 (next slide).Fig. 3.2 (next slide).Fig. 3.2 (next slide)..")
11
11 The enthalpy change of the mixture can be obtained by summing the changes of each of its constituents, an equation describing the curve is The enthalpy change of the mixture can be obtained by summing the changes of each of its constituents, an equation describing the curve is For most purposes, an averaged value of C P taken over the temperature interval is adequate, but the variation of specific heat with temperature is not linear and for accurate work tabulated enthalpy values should be used. For most purposes, an averaged value of C P taken over the temperature interval is adequate, but the variation of specific heat with temperature is not linear and for accurate work tabulated enthalpy values should be used.

12
12 4. Enthalpy of Combustion Similarly, the enthalpy-temperature diagram for the products will be: Similarly, the enthalpy-temperature diagram for the products will be: If a quantity of heat has left the system, the enthalpy of the products is less than the enthalpy of the reactants at the same temperature. If a quantity of heat has left the system, the enthalpy of the products is less than the enthalpy of the reactants at the same temperature. We can thus sketch two curves on an enthalpy-temperature diagram, one for the reactants and one for the products, with the curve for the products lying below that for the reactants. (Fig. 3.3, next slide). We can thus sketch two curves on an enthalpy-temperature diagram, one for the reactants and one for the products, with the curve for the products lying below that for the reactants. (Fig. 3.3, next slide).Fig. 3.3, next slideFig. 3.3, next slide
. We can thus sketch two curves on an enthalpy-temperature diagram, one for the reactants and one for the products, with the curve for the products lying below that for the reactants. (Fig. 3.3, next slide).Fig. 3.3, next slideFig. 3.3, next slide.")
13
Enthalpy △ H 25

14
14 At any given temperature, the vertical distance between the two curves in Fig. 3.3 represents the enthalpy released by the combustion process. In general the magnitude of this quantity will depend on the temperature chosen. At any given temperature, the vertical distance between the two curves in Fig. 3.3 represents the enthalpy released by the combustion process. In general the magnitude of this quantity will depend on the temperature chosen. The standard temperature adopted is 25 ℃ and the quantity △ H 25 is the enthalpy of combustion for the fuel in question. The standard temperature adopted is 25 ℃ and the quantity △ H 25 is the enthalpy of combustion for the fuel in question.

15
15 Some examples of enthalpy of combustion for gaseous fuels are given in Table 3.1. Some examples of enthalpy of combustion for gaseous fuels are given in Table 3.1. Table 3.1 Standard enthalpies of combustion Fuel △ H 25 (kJ/kmol) Hydrogen (H 2 ) Methane (CH 4 ) Propane (C 3 H 8 ) Acetylene (C 2 H 2 ) -241,800-802,300-2,045,400-1,256,400
 Hydrogen (H 2 ) Methane (CH 4 ) Propane (C 3 H 8 ) Acetylene (C 2 H 2 ) -241, ,300-2,045,400-1,256,400.")
16
16 The combustion of all the above fuels will produce water in the flue gases, which can be considered as existing in either the liquid or vapor phases. The combustion of all the above fuels will produce water in the flue gases, which can be considered as existing in either the liquid or vapor phases. All the figures quoted for the enthalpy of combustion given above are for water in the vapor phase. All the figures quoted for the enthalpy of combustion given above are for water in the vapor phase. Should the enthalpy of combustion be required with water in the liquid phase, then the latent heat of evaporation for the water vapor produced in the combustion products (H fg ) must be accounted for: ( △ H 25 ) f = ( △ H 25 ) g – n × H fg where n represents the number of kmoles of water produced per kmole of fuel. Should the enthalpy of combustion be required with water in the liquid phase, then the latent heat of evaporation for the water vapor produced in the combustion products (H fg ) must be accounted for: ( △ H 25 ) f = ( △ H 25 ) g – n × H fg where n represents the number of kmoles of water produced per kmole of fuel.
 must be accounted for: ( △ H 25 ) f = ( △ H 25 ) g – n × H fg where n represents the number of kmoles of water produced per kmole of fuel. Should the enthalpy of combustion be required with water in the liquid phase, then the latent heat of evaporation for the water vapor produced in the combustion products (H fg ) must be accounted for: ( △ H 25 ) f = ( △ H 25 ) g – n × H fg where n represents the number of kmoles of water produced per kmole of fuel..")
17
17 The latent heat at 25 ℃ has a value of 44,000 kJ/kmol of water produced. The latent heat at 25 ℃ has a value of 44,000 kJ/kmol of water produced. Example 1: the value of △ H 25 for methane is -802,300 kJ/kmol with water in the vapor phase. Calculate △ H 25 for the case when all the water vapor is condensed. Example 1: the value of △ H 25 for methane is -802,300 kJ/kmol with water in the vapor phase. Calculate △ H 25 for the case when all the water vapor is condensed. Solution: the relevant stoichiometric combustion equation for methane is: CH 4 + 2 O 2 → CO 2 + 2 H 2 O i.e. 2 kmoles of water vapor are produced for each kmole of fuel burnt. ( △ H 25 ) f = ( △ H 25 ) g – 2 × H fg = -802,300 – 2 × 44,000 = -890,300 kJ/kmol Solution: the relevant stoichiometric combustion equation for methane is: CH 4 + 2 O 2 → CO 2 + 2 H 2 O i.e. 2 kmoles of water vapor are produced for each kmole of fuel burnt. ( △ H 25 ) f = ( △ H 25 ) g – 2 × H fg = -802,300 – 2 × 44,000 = -890,300 kJ/kmol
 f = ( △ H 25 ) g – 2 × H fg = -802,300 – 2 × 44,000 = -890,300 kJ/kmol Solution: the relevant stoichiometric combustion equation for methane is: CH O 2 → CO H 2 O i.e. 2 kmoles of water vapor are produced for each kmole of fuel burnt. ( △ H 25 ) f = ( △ H 25 ) g – 2 × H fg = -802,300 – 2 × 44,000 = -890,300 kJ/kmol.")
18
18 5. Constant-volume Combustion The heat released when a solid or liquid fuel is burnt is measured by burning a sample of the fuel at constant volume, hence it is important to look at the thermodynamics of this process as well as that of combustion at constant pressure. The heat released when a solid or liquid fuel is burnt is measured by burning a sample of the fuel at constant volume, hence it is important to look at the thermodynamics of this process as well as that of combustion at constant pressure. Internal combustion engine (vehicles) is a constant-volume combustion system. Internal combustion engine (vehicles) is a constant-volume combustion system.
 is a constant-volume combustion system. Internal combustion engine (vehicles) is a constant-volume combustion system..")
19
19 6. Internal Energy of Combustion The combustion of a mixture of fuel and air at constant volume is most easily envisaged as taking place inside a rigid closed container. The combustion of a mixture of fuel and air at constant volume is most easily envisaged as taking place inside a rigid closed container. The First Law energy equation for a closed system is: (U 2 – U 1 ) = Q –W (3) The First Law energy equation for a closed system is: (U 2 – U 1 ) = Q –W (3) As the system boundary is fixed, no work can cross it, hence equation (3) becomes: (U 2 – U 1 ) = Q As the system boundary is fixed, no work can cross it, hence equation (3) becomes: (U 2 – U 1 ) = Q
 = Q –W (3) The First Law energy equation for a closed system is: (U 2 – U 1 ) = Q –W (3) As the system boundary is fixed, no work can cross it, hence equation (3) becomes: (U 2 – U 1 ) = Q As the system boundary is fixed, no work can cross it, hence equation (3) becomes: (U 2 – U 1 ) = Q.")
20
20 The change in internal energy can be related to temperature rise by: △ U = c V ( △ t) The change in internal energy can be related to temperature rise by: △ U = c V ( △ t) Thus we can plot an internal energy-temperature diagram for the reactants and products of combustion in the same way as an enthalpy-temperature plot was made in section 3. (Fig. 3.4, next slide) Thus we can plot an internal energy-temperature diagram for the reactants and products of combustion in the same way as an enthalpy-temperature plot was made in section 3. (Fig. 3.4, next slide)Fig. 3.4, next slideFig. 3.4, next slide
 Thus we can plot an internal energy-temperature diagram for the reactants and products of combustion in the same way as an enthalpy-temperature plot was made in section 3. (Fig. 3.4, next slide)Fig. 3.4, next slideFig. 3.4, next slide.")
21
internal energy △ U 25

22
22 The curves of Fig. 3.4 are described by: The curves of Fig. 3.4 are described by: Once again, at any given temperature the internal energy of the products must be less than that of the reactants (since heat has left the system). Once again, at any given temperature the internal energy of the products must be less than that of the reactants (since heat has left the system). The difference between the two curves at the reference temperature of 25 ℃ is referred to as the internal energy of combustion for that fuel. The difference between the two curves at the reference temperature of 25 ℃ is referred to as the internal energy of combustion for that fuel.
. Once again, at any given temperature the internal energy of the products must be less than that of the reactants (since heat has left the system). The difference between the two curves at the reference temperature of 25 ℃ is referred to as the internal energy of combustion for that fuel. The difference between the two curves at the reference temperature of 25 ℃ is referred to as the internal energy of combustion for that fuel..")
23
23 Each fuel will have two values for internal energy of combustion: one for water in the vapor phase and one for water in the liquid phase. Each fuel will have two values for internal energy of combustion: one for water in the vapor phase and one for water in the liquid phase. The two values will differ by the internal energy of evaporation (U fg ) of water at 25 ℃, which is 37,602 kJ/kmol. The two values will differ by the internal energy of evaporation (U fg ) of water at 25 ℃, which is 37,602 kJ/kmol.
 of water at 25 ℃, which is 37,602 kJ/kmol. The two values will differ by the internal energy of evaporation (U fg ) of water at 25 ℃, which is 37,602 kJ/kmol..")
24
24 7. Relationship between △ H 25 and △ U 25 These two quantities are associated with fuel types, because calorific measurements are usually performed at constant pressure for a gaseous fuel, and at constant volume for liquid and solid fuels. These two quantities are associated with fuel types, because calorific measurements are usually performed at constant pressure for a gaseous fuel, and at constant volume for liquid and solid fuels. As all types of fuels are burned at constant pressure in heating plants, the question naturally arises as to the nature and magnitude of the difference between the two values. As all types of fuels are burned at constant pressure in heating plants, the question naturally arises as to the nature and magnitude of the difference between the two values.

25
25 We get We get The (PV) terms for solids and liquids are very small, so for any reactant or product in the gas phase: PV = nRT hence: △ H 25 = △ U 25 + RT (n P - n R ) where n P and n R represent the total number of kmoles of combustion products and reactants in the gas phase, respectively. The (PV) terms for solids and liquids are very small, so for any reactant or product in the gas phase: PV = nRT hence: △ H 25 = △ U 25 + RT (n P - n R ) where n P and n R represent the total number of kmoles of combustion products and reactants in the gas phase, respectively.
 terms for solids and liquids are very small, so for any reactant or product in the gas phase: PV = nRT hence: △ H 25 = △ U 25 + RT (n P - n R ) where n P and n R represent the total number of kmoles of combustion products and reactants in the gas phase, respectively..")
26
26 If n P = n R, then △ H 25 and △ U 25 will have the same value. If n P = n R, then △ H 25 and △ U 25 will have the same value. Example 2: △ H 25 for propane (C 3 H 8 ) is -2,045,400 kJ/kmol with water in the vapor phase. Calculate the corresponding internal energy of combustion. Example 2: △ H 25 for propane (C 3 H 8 ) is -2,045,400 kJ/kmol with water in the vapor phase. Calculate the corresponding internal energy of combustion. Solution: We can write the stoichiometric equation for propane ignoring the presence of nitrogen and any excess oxygen as they will appear in both the reactants and the products: C 3 H 8 + 5 O 2 → 3 CO 2 + 4 H 2 O So n P – n R = 7 – 6 = 1 Solution: We can write the stoichiometric equation for propane ignoring the presence of nitrogen and any excess oxygen as they will appear in both the reactants and the products: C 3 H 8 + 5 O 2 → 3 CO 2 + 4 H 2 O So n P – n R = 7 – 6 = 1
 is -2,045,400 kJ/kmol with water in the vapor phase. Calculate the corresponding internal energy of combustion. Example 2: △ H 25 for propane (C 3 H 8 ) is -2,045,400 kJ/kmol with water in the vapor phase. Calculate the corresponding internal energy of combustion. Solution: We can write the stoichiometric equation for propane ignoring the presence of nitrogen and any excess oxygen as they will appear in both the reactants and the products: C 3 H O 2 → 3 CO H 2 O So n P – n R = 7 – 6 = 1 Solution: We can write the stoichiometric equation for propane ignoring the presence of nitrogen and any excess oxygen as they will appear in both the reactants and the products: C 3 H O 2 → 3 CO H 2 O So n P – n R = 7 – 6 = 1.")
27
27 △ H 25 = △ U 25 + RT (n P - n R ) -2,045,400 = △ U 25 + (8.314 × 298 × 1) △ U 25 = -2,047,878 kJ/kmol △ H 25 = △ U 25 + RT (n P - n R ) -2,045,400 = △ U 25 + (8.314 × 298 × 1) △ U 25 = -2,047,878 kJ/kmol In conclusion, there is normally little numerical difference between the enthalpy and internal energy of combustion of a fuel. However, the phase of any water produced by combustion is highly significant. In conclusion, there is normally little numerical difference between the enthalpy and internal energy of combustion of a fuel. However, the phase of any water produced by combustion is highly significant.

28
28 8. Calorific Values The terms “enthalpy of combustion” and “internal energy of combustion” have precise thermodynamic definitions. The terms “enthalpy of combustion” and “internal energy of combustion” have precise thermodynamic definitions. However, in more practical situations engineers generally use calorific values as a measure of the heat released when unit quantity of a fuel is burned. However, in more practical situations engineers generally use calorific values as a measure of the heat released when unit quantity of a fuel is burned. The calorific value for a liquid fuel measured at constant volume differs from its internal energy of combustion. Such discrepancies are small. The calorific value for a liquid fuel measured at constant volume differs from its internal energy of combustion. Such discrepancies are small.

29
29 The calorific value of a fuel is normally expressed as kJ (or MJ) per m 3 (gaseous fuels) or kJ (MJ) per kg which is applicable to all types of fuel. The calorific value of a fuel is normally expressed as kJ (or MJ) per m 3 (gaseous fuels) or kJ (MJ) per kg which is applicable to all types of fuel. If the calorific value includes the latent heat of condensation of the water produced it is usually referred to as the “gross calorific value”, where as if the water is in the vapor phase, the term “net calorific value” is used. If the calorific value includes the latent heat of condensation of the water produced it is usually referred to as the “gross calorific value”, where as if the water is in the vapor phase, the term “net calorific value” is used. The expressions “higher calorific value” and “lower calorific value” are also in use. The expressions “higher calorific value” and “lower calorific value” are also in use.
 per m 3 (gaseous fuels) or kJ (MJ) per kg which is applicable to all types of fuel. If the calorific value includes the latent heat of condensation of the water produced it is usually referred to as the gross calorific value , where as if the water is in the vapor phase, the term net calorific value is used. If the calorific value includes the latent heat of condensation of the water produced it is usually referred to as the gross calorific value , where as if the water is in the vapor phase, the term net calorific value is used. The expressions higher calorific value and lower calorific value are also in use. The expressions higher calorific value and lower calorific value are also in use..")
30
30 A fuel can have four calorific values: (1)gross calorific value at constant volume; (2)gross calorific value at constant pressure; (3)net calorific value at constant volume; (4)net calorific value at constant pressure. A fuel can have four calorific values: (1)gross calorific value at constant volume; (2)gross calorific value at constant pressure; (3)net calorific value at constant volume; (4)net calorific value at constant pressure. The numerical values of (1) and (3) correspond closely to the two values of △ U 25 while the values of (2) and (4) are close to the two values for △ H 25. The numerical values of (1) and (3) correspond closely to the two values of △ U 25 while the values of (2) and (4) are close to the two values for △ H 25.
gross calorific value at constant volume; (2)gross calorific value at constant pressure; (3)net calorific value at constant volume; (4)net calorific value at constant pressure. The numerical values of (1) and (3) correspond closely to the two values of △ U 25 while the values of (2) and (4) are close to the two values for △ H 25. The numerical values of (1) and (3) correspond closely to the two values of △ U 25 while the values of (2) and (4) are close to the two values for △ H 25..")
31
31 The value for h fg for water at 25 ℃ is 2,442 kJ/kg. The value for h fg for water at 25 ℃ is 2,442 kJ/kg. Example 3: A liquid fuel consists of 86% carbon and 14% hydrogen (by mass). Its gross calorific value is 43.5 MJ/kg. calculate the net calorific value. Example 3: A liquid fuel consists of 86% carbon and 14% hydrogen (by mass). Its gross calorific value is 43.5 MJ/kg. calculate the net calorific value. Solution: H 2 + ½ O 2 → H 2 O hence 2 kg hydrogen produce 18 kg water vapor. The mass of water vapor produced by the combustion of 1 kg fuel is thus 0.14 × 9 = 1.26 kg the net calorific value of the fuel is then 43.5 – 1.26 × 2.442 = 40.42 MJ/kg Solution: H 2 + ½ O 2 → H 2 O hence 2 kg hydrogen produce 18 kg water vapor. The mass of water vapor produced by the combustion of 1 kg fuel is thus 0.14 × 9 = 1.26 kg the net calorific value of the fuel is then 43.5 – 1.26 × 2.442 = 40.42 MJ/kg
. Its gross calorific value is 43.5 MJ/kg. calculate the net calorific value. Example 3: A liquid fuel consists of 86% carbon and 14% hydrogen (by mass). Its gross calorific value is 43.5 MJ/kg. calculate the net calorific value. Solution: H 2 + ½ O 2 → H 2 O hence 2 kg hydrogen produce 18 kg water vapor. The mass of water vapor produced by the combustion of 1 kg fuel is thus 0.14 × 9 = 1.26 kg the net calorific value of the fuel is then 43.5 – 1.26 × = MJ/kg Solution: H 2 + ½ O 2 → H 2 O hence 2 kg hydrogen produce 18 kg water vapor. The mass of water vapor produced by the combustion of 1 kg fuel is thus 0.14 × 9 = 1.26 kg the net calorific value of the fuel is then 43.5 – 1.26 × = MJ/kg.")
32
32 On a per kilogram basis, hydrogen has a much higher calorific value than carbon. Carbon has a calorific value of 32.8 MJ/kg whereas molecular hydrogen has a net calorific value of 120.9 MJ/kg. On a per kilogram basis, hydrogen has a much higher calorific value than carbon. Carbon has a calorific value of 32.8 MJ/kg whereas molecular hydrogen has a net calorific value of 120.9 MJ/kg. The calorific value of a hydrocarbon fuel cannot be predicted with any degree of accuracy from these figures, but there is an implicit suggestion that the calorific value of a fuel may be roughly related to the relative quantities of carbon and hydrogen from which it is made up. The calorific value of a hydrocarbon fuel cannot be predicted with any degree of accuracy from these figures, but there is an implicit suggestion that the calorific value of a fuel may be roughly related to the relative quantities of carbon and hydrogen from which it is made up. The broad trend is illustrated in Fig. 3.5 (next slide). The C:H ratio range runs from anthracite and bituminous coal (the highest C:H ratio) to natural gas (the lowest). The broad trend is illustrated in Fig. 3.5 (next slide). The C:H ratio range runs from anthracite and bituminous coal (the highest C:H ratio) to natural gas (the lowest).next slidethe lowestnext slidethe lowest
. The C:H ratio range runs from anthracite and bituminous coal (the highest C:H ratio) to natural gas (the lowest). The broad trend is illustrated in Fig. 3.5 (next slide). The C:H ratio range runs from anthracite and bituminous coal (the highest C:H ratio) to natural gas (the lowest).next slidethe lowestnext slidethe lowest.")
34
34 A much more consistent trend is exhibited by the liquid and gaseous fuels, which have a much higher proportion of hydrogen than do coals. A much more consistent trend is exhibited by the liquid and gaseous fuels, which have a much higher proportion of hydrogen than do coals. Fig. 3.6 (next slide) show the gross calorific values of these fuels as a function of their C:H ratio. Residual fuel oils (H, M, and Z) Distillate oil (G and K) Propane (P) Natural gas (N) Fig. 3.6 (next slide) show the gross calorific values of these fuels as a function of their C:H ratio. Residual fuel oils (H, M, and Z) Distillate oil (G and K) Propane (P) Natural gas (N)next slide Natural gas (N)next slide Natural gas (N)
 show the gross calorific values of these fuels as a function of their C:H ratio. Residual fuel oils (H, M, and Z) Distillate oil (G and K) Propane (P) Natural gas (N) Fig. 3.6 (next slide) show the gross calorific values of these fuels as a function of their C:H ratio. Residual fuel oils (H, M, and Z) Distillate oil (G and K) Propane (P) Natural gas (N)next slide Natural gas (N)next slide Natural gas (N).")
36
36 It is possible to obtain a rough estimate of the calorific value of a solid or liquid fuel from its ultimate analysis and the calorific values of its combustible constituents. It is possible to obtain a rough estimate of the calorific value of a solid or liquid fuel from its ultimate analysis and the calorific values of its combustible constituents. For this purpose, the relevant gross calorific values are: carbon33.9 MJ/kg hydrogen144.4 MJ/kg sulfur9.4 MJ/kg For this purpose, the relevant gross calorific values are: carbon33.9 MJ/kg hydrogen144.4 MJ/kg sulfur9.4 MJ/kg The estimated calorific value is given by where C, H, O and S are the masses of these elements present in 1 kg of fuel. It assumes that the oxygen in the fuel is already bound to the hydrogen present. The estimated calorific value is given by where C, H, O and S are the masses of these elements present in 1 kg of fuel. It assumes that the oxygen in the fuel is already bound to the hydrogen present.

37
37 The calorific value of a gaseous fuel is measured in a device known as the Boys’ calorimeter. The operation of this device is outlined diagrammatically in Fig. 3.7 (next slide). It is basically a counterflow heat exchanger. The calorific value of a gaseous fuel is measured in a device known as the Boys’ calorimeter. The operation of this device is outlined diagrammatically in Fig. 3.7 (next slide). It is basically a counterflow heat exchanger.next slide It is basically a counterflow heat exchanger.next slide It is basically a counterflow heat exchanger.
. It is basically a counterflow heat exchanger. The calorific value of a gaseous fuel is measured in a device known as the Boys’ calorimeter. The operation of this device is outlined diagrammatically in Fig. 3.7 (next slide). It is basically a counterflow heat exchanger.next slide It is basically a counterflow heat exchanger.next slide It is basically a counterflow heat exchanger..")
39
39 When Steady-State conditions are obtained, the heat released by burning the fuel is calculated from the temperature rise of the cooling water and its mass flow rate. When Steady-State conditions are obtained, the heat released by burning the fuel is calculated from the temperature rise of the cooling water and its mass flow rate. The apparatus is designed so that the average of the starting and finishing gas temperatures is close to the reference value of 25 ℃. The apparatus is designed so that the average of the starting and finishing gas temperatures is close to the reference value of 25 ℃.

40
40 This temperature is well below the dew point of the combustion products, so the value measured is the gross calorific value of the fuel. This temperature is well below the dew point of the combustion products, so the value measured is the gross calorific value of the fuel. Not all the water vapor generated in the combustion of the fuel may condense out in the calorimeter, but this can be corrected for by supplying the calorimeter with near-saturated air. Not all the water vapor generated in the combustion of the fuel may condense out in the calorimeter, but this can be corrected for by supplying the calorimeter with near-saturated air.

41
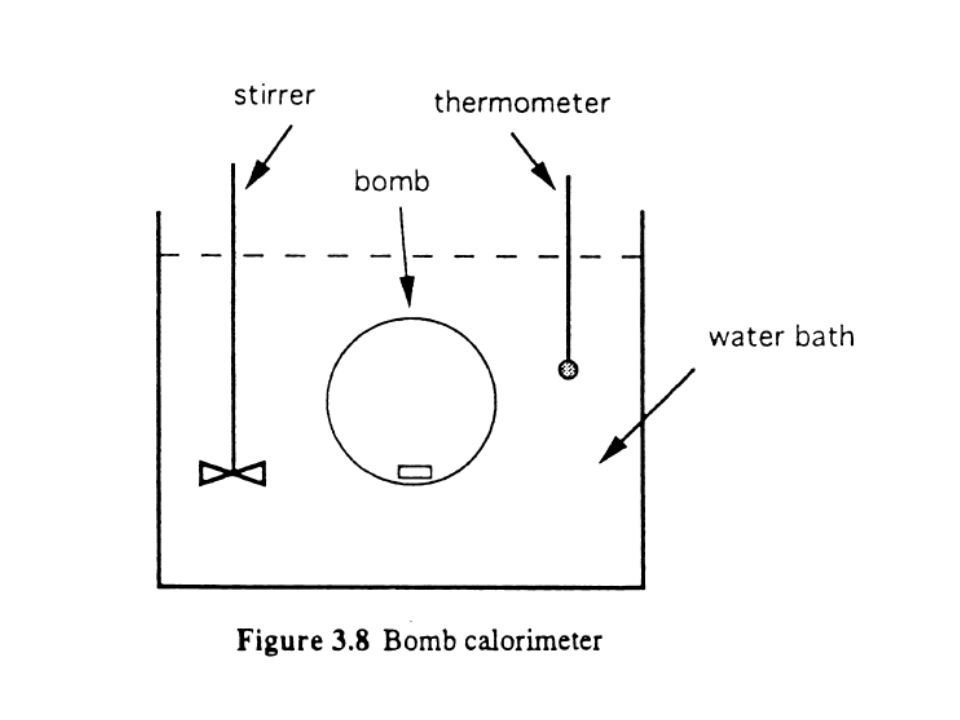
41 The calorific value of a liquid or solid fuel is measured in the bomb calorimeter (Fig. 3.8, next slide). The calorific value of a liquid or solid fuel is measured in the bomb calorimeter (Fig. 3.8, next slide).Fig. 3.8, next slideFig. 3.8, next slide This device consists of a spherical vessel containing a small sample of the fuel in an atmosphere of pressurized oxygen. The bomb is immersed in an isolated water bath which acts as the calorimeter for the heat released when combustion is initiated. This device consists of a spherical vessel containing a small sample of the fuel in an atmosphere of pressurized oxygen. The bomb is immersed in an isolated water bath which acts as the calorimeter for the heat released when combustion is initiated.is initiatedis initiated
. The calorific value of a liquid or solid fuel is measured in the bomb calorimeter (Fig. 3.8, next slide).Fig. 3.8, next slideFig. 3.8, next slide This device consists of a spherical vessel containing a small sample of the fuel in an atmosphere of pressurized oxygen. The bomb is immersed in an isolated water bath which acts as the calorimeter for the heat released when combustion is initiated. This device consists of a spherical vessel containing a small sample of the fuel in an atmosphere of pressurized oxygen. The bomb is immersed in an isolated water bath which acts as the calorimeter for the heat released when combustion is initiated.is initiatedis initiated.")
43
43 The temperature change in the water is measured by a sensitive thermometer, and knowing the thermal capacity of the apparatus the heat released can be determined. The temperature change in the water is measured by a sensitive thermometer, and knowing the thermal capacity of the apparatus the heat released can be determined. Once again, the temperature rise is arranged to take place from just below, to just above the reference temperature of 25 ℃ with a maximum rise of about 4 ℃. Once again, the temperature rise is arranged to take place from just below, to just above the reference temperature of 25 ℃ with a maximum rise of about 4 ℃.

44
44 In practice, the thermal capacity of the apparatus is evaluated experimentally by burning a known quantity of a reference fuel, typically benzoic acid, in the device. In practice, the thermal capacity of the apparatus is evaluated experimentally by burning a known quantity of a reference fuel, typically benzoic acid, in the device. A quantity of water is introduced into the bomb to ensure saturation, hence the condensation of all the water produced by combustion of the fuel. A quantity of water is introduced into the bomb to ensure saturation, hence the condensation of all the water produced by combustion of the fuel.

Similar presentations


>")


.>")


 + 6O 2 (g) --> 6CO 2 (g) + 6H 2 O(l) + 2803 kJ 2C 57 H 110 O 6 + 163O 2 (g) --> 114 CO 2 (g) + 110 H 2 O(l) + 75,520 kJ The.>")

