Download presentation
Presentation is loading. Please wait.

1
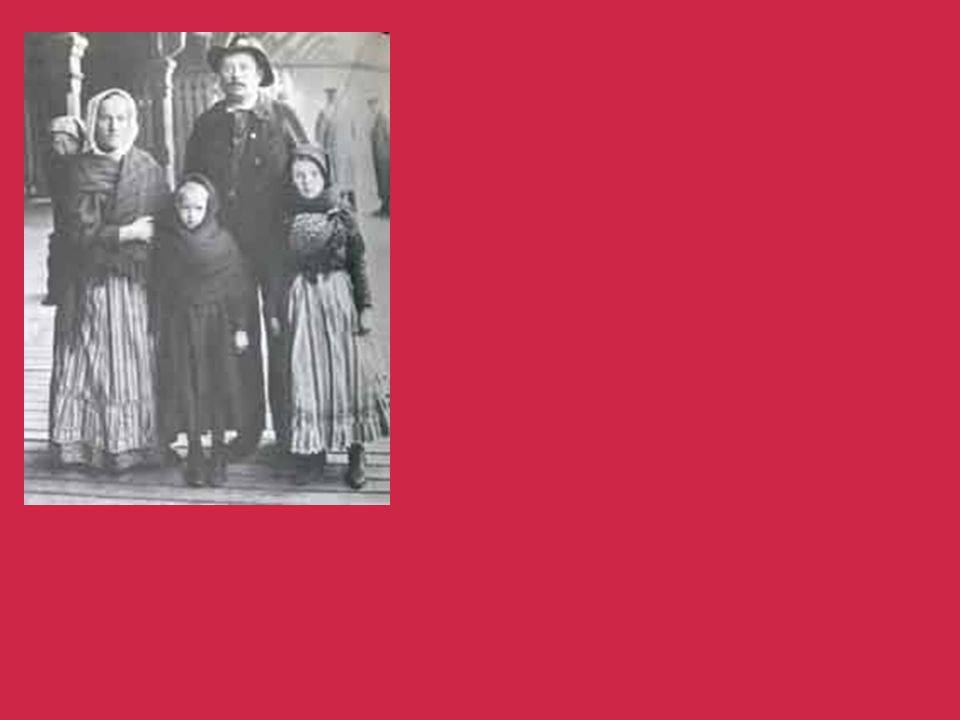
Immigrants and Workers

10
Industrialization

13
1890 No place with less than 2 people per square mile

14
1920 More people lived in cities than countryside

17
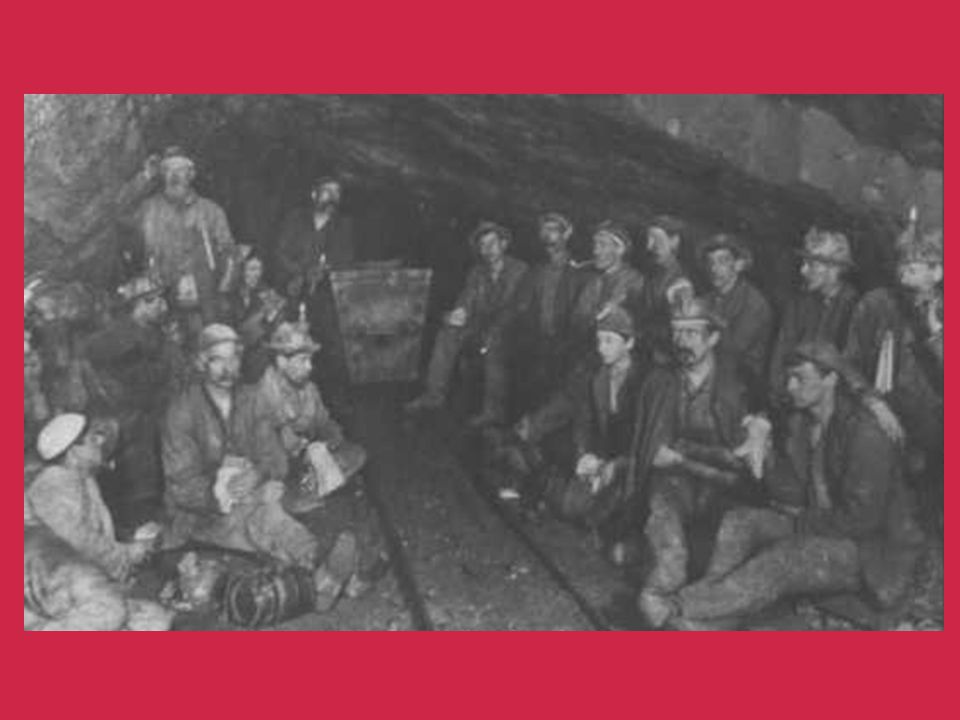
Steel mills Rail yards Textile mills Clothing factories Mines Farms

18
Diversity

19
Religious Cultural National

20
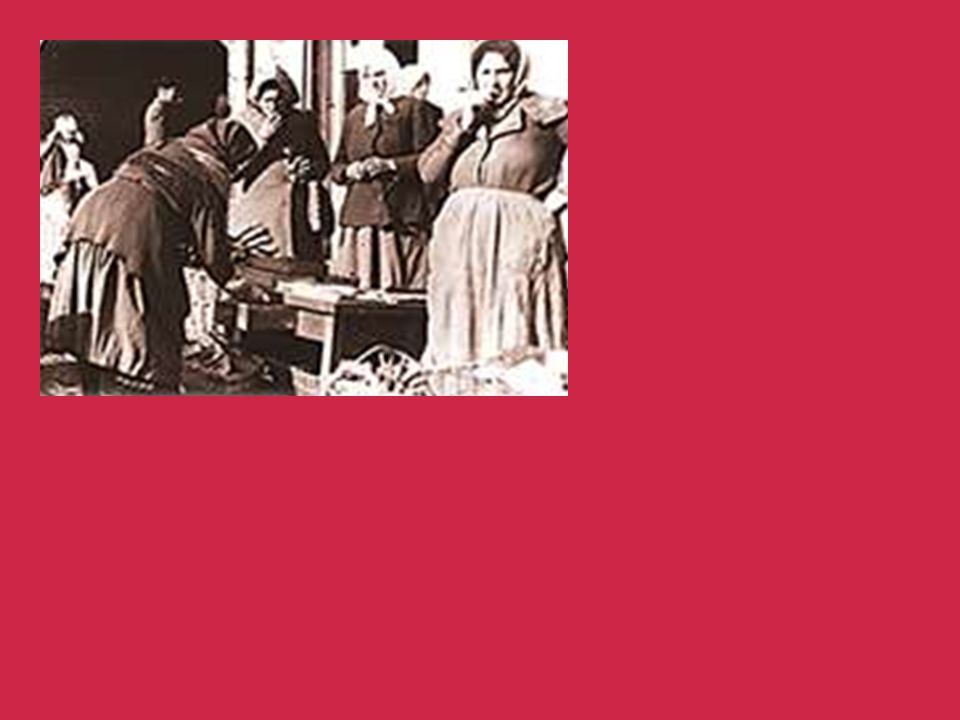
Diversity Marriage Child care Women and child labor

21
Diversity Mobile

22
Diversity Mobile Earnings and employment unstable

23
Diversity Mobile Earnings and employment unstable Recessions Depressions

24
Diversity Mobile Earnings and employment unstable Consumer demand Overproduction

25
Diversity Mobile Earnings and employment unstable Inclement weather Technological displacement

28
1849 Irish Potato Famine

29
Coffin Ships

31
1830s

34
1800 5,000 per year

35
1830s 600,000 per year

36
1840s 1.5 million per year

37
1850s 2.8 million per year

38
1877-1890 6 million

39
1890-1914 18 million

40
Prior to 1890s Western and Northern Europe

41
After 1890s Southern and Eastern Europe

46
Employment Language Culture Housing Family values

47
Family Strategies

48
Subordination of individuals for sake of collective family

49
Family Strategies Subordination of individuals for sake of collective family Key decisions based on good of family, not individuals

50
Family Strategies Subordination of individuals for sake of collective family Key decisions based on good of family, not individuals One daughter remained unmarried

51
“Family Economy”

52
Decision making product of collective needs rather than individual preferences

53
1882 Family living costs one third higher than earnings of head of household

54
1900 Richest 2% owned 1/3 wealth

55
1900 Richest 10% owned 3/4 wealth

69
Child labor

75
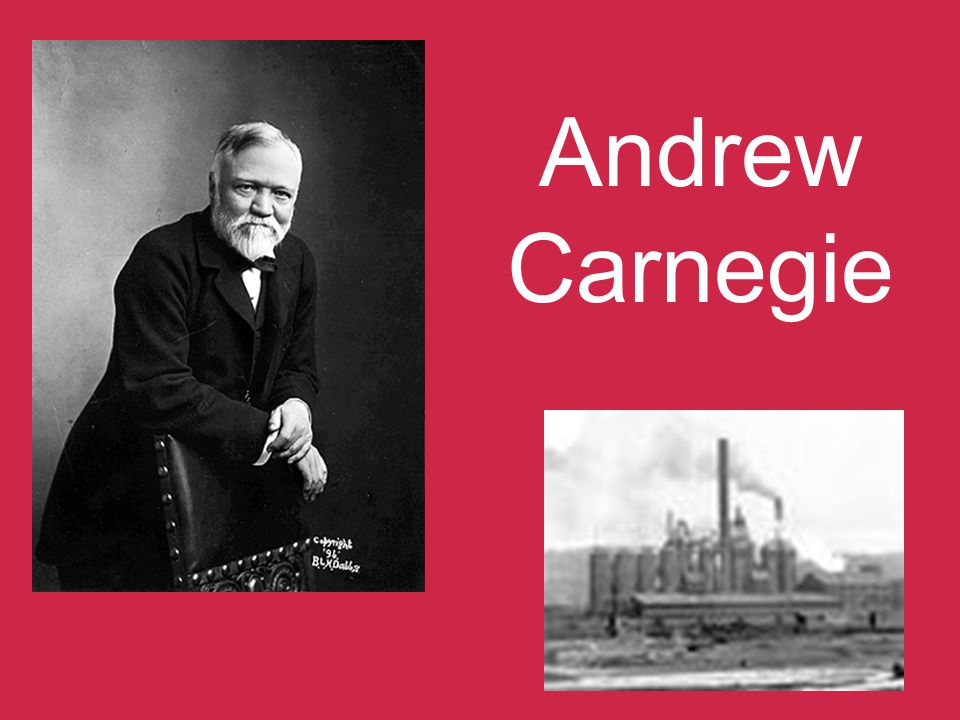
Andrew Carnegie

83
Horace Greeley

84
$10.37 – family of five

85
Shoemaker = $4

86
$10.37 – family of five Shoemaker = $4 Cabinet maker = $5

87
$10.37 – family of five Shoemaker = $4 Cabinet maker = $5 Textile worker = $6.50 m $3.50 f

88
$10.37 – family of five Shoemaker = $4 Cabinet maker = $5 Textile worker = $6.50 m $3.50 f

89
$10.37 – family of five Shoemaker = $4 Cabinet maker = $5 Textile worker = $6.50 m $3.50 f Unskilled = $1

90
1.Children too young to work

91
2.Later in life

92
Ethnic Diversity

93
Higher birthrates

94
Ethnic Diversity Higher birthrates Boarders

95
Ethnic Diversity Higher birthrates Boarders More child labor

96
Ethnic Diversity Higher birthrates Boarders More child labor Different fam. patterns

100
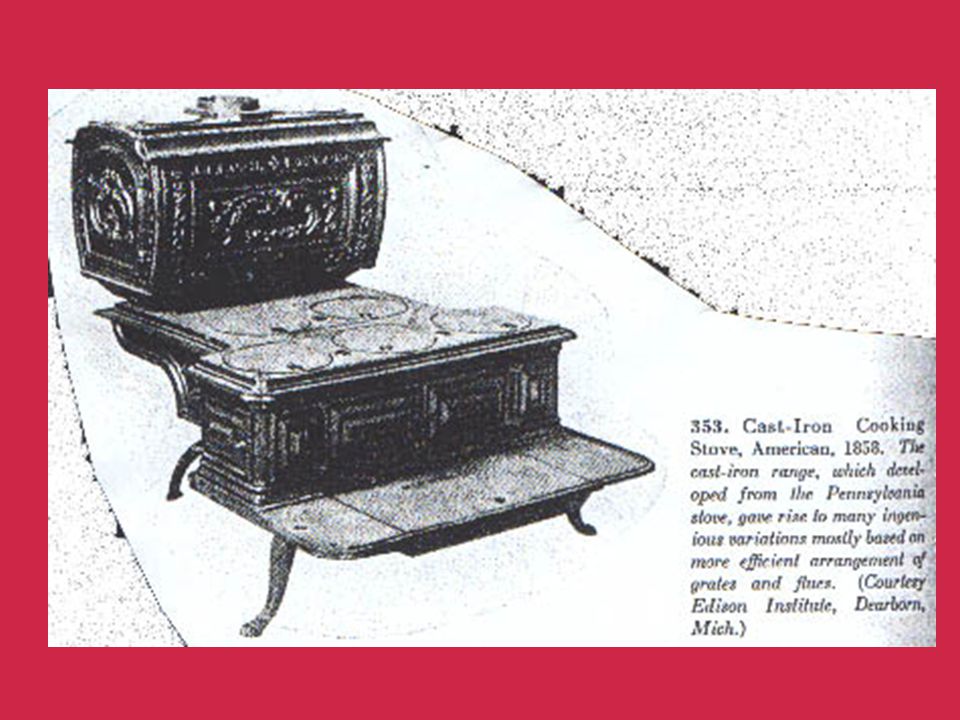
Factory Work

105
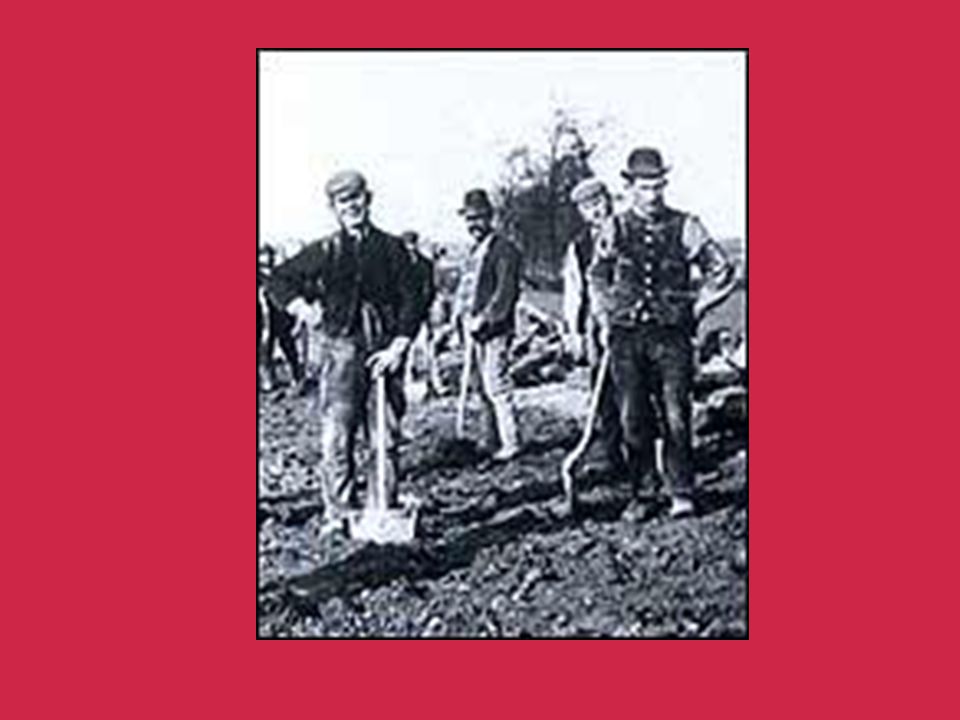
Rural Families

106
Before 1880 70% all Americans lived in towns and villages of less than 2,500 people

110
$754 per year 60% = $450 per year

111
$754 per year 60% = $450 per year scrip

118
10% white 20% black

122
1924 Emergency Quota Act Immigration Act

Similar presentations


, 1870–1920 Population is increasing, as is immigration. The labor force is also increasing.>")


 Establishment.>")


.>")


