Download presentation
Presentation is loading. Please wait.

1
Characteristics of Asian Pollution at Mt. Bachelor Observatory during Spring 2004 Peter Weiss-Penzias UWB Data Workshop, Oct. 14, 2004

2
Acknowledgements: Dan Jaffe, Isaac Bertschi, and James Dennison Phil Swartzendruber and Eric Prestbo Carol Higginbotham Mt. Bachelor Ski Area Staff

3
Research Objective Characterize long-range transport (LRT) of pollution to the West Coast in the free troposphere (FT) by making continuous measurements of O 3, CO, particulates, mercury and other tracers. Hypotheses Springtime LRT events should be stronger and more frequent at MBO in the FT compared to those seen at Cheeka Peak (CPO), which is in the marine boundary layer (MBL). Ozone should be more strongly correlated to CO during events at MBO compared to CPO. Background levels of pollutants during spring should be higher at MBO compared to CPO. Total gaseous mercury (TGM) should be well correlated with CO in pollution originating from Asia, due to large TGM emissions in that region.
, which is in the marine boundary layer (MBL). Ozone should be more strongly correlated to CO during events at MBO compared to CPO. Background levels of pollutants during spring should be higher at MBO compared to CPO. Total gaseous mercury (TGM) should be well correlated with CO in pollution originating from Asia, due to large TGM emissions in that region..")
4
Observed Asian Pollution Events at CPO From Weiss-Penzias et al., JGR, 2004

5
Hg 0 Measurements at CPO during Asian Pollution Events From Weiss-Penzias et al., ES&T, 2003 Note: Events were defined slightly differently between two projects.

6
Mt. Bachelor Observatory (MBO) Hemispheric Perspective MBO
 Hemispheric Perspective MBO")
7
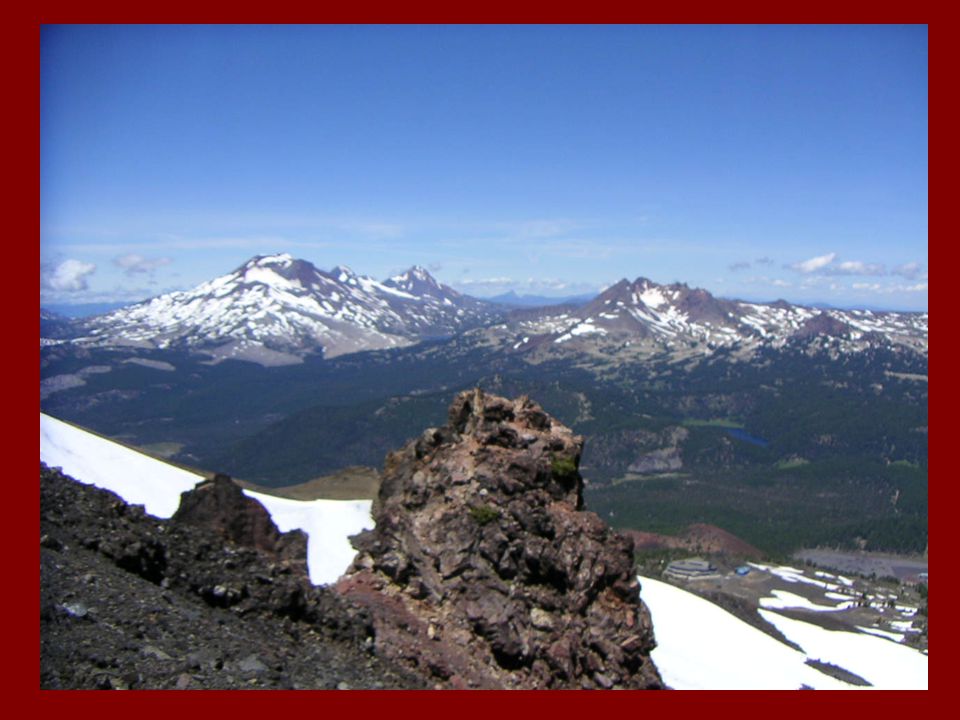
MBO Regional Perspective

8
MBO Site Information 44.0 o N, 121.7 o W, 2763 meters asl Free-standing dormant volcanic cone in the Oregon Cascade Mountains. Summit reached by high-speed ski-lift. Large, multi-story building at summit. No combustion sources at summit, except for daily snow-grooming during ski season.

12
Instrumentation Carbon monoxide – Reduction gas analyzer (Trace Analytical) and non-dispersive infrared instruments (Thermo Electron) Ozone – Dasibi UV photometric analyzer. Particulate Scattering – Single wavelength nephelometer (Radiance Research), 1 mm size cut. Total Airborne Mercury – Cold vapor atomic fluorescence (Tekran 2537A). Nitrogen Oxides (NO, NO 2, PAN) – Chemiluminescence (API 200 AU). Temperature and Relative Humidity – Campbell Scientific HMP 45C.
, 1 mm size cut. Total Airborne Mercury – Cold vapor atomic fluorescence (Tekran 2537A). Nitrogen Oxides (NO, NO 2, PAN) – Chemiluminescence (API 200 AU). Temperature and Relative Humidity – Campbell Scientific HMP 45C..")
13
Spring 2004 Data – LRT Events Highlighted

14
Could these events be from local or regional pollution? Periods of high NOy (> 2 ppbv, spiky) were removed due to snow grooming equipment. During event periods, NOy shows very little (< 0.5 ppbv) enhancements. Hysplit trajectories for each event show air masses that are of Asian or European origin and are > 3 km above North America before arrival. Most events were accompanied by high pressure and low water vapor, indicating free tropospheric air.
 were removed due to snow grooming equipment. During event periods, NOy shows very little (< 0.5 ppbv) enhancements. Hysplit trajectories for each event show air masses that are of Asian or European origin and are > 3 km above North America before arrival. Most events were accompanied by high pressure and low water vapor, indicating free tropospheric air..")
15
Net Enhancements, by Event defined as max-min during event, which is defined as CO minimum to minimum.

16
Enhancement Ratios (Slope of linear least squares fit)
")
17
Apr. 25 th Event – Industrial Pollution O 3 /CO r 2 = 0.87 T sg /CO r 2 = 0.92 TGM/CO r 2 = 0.92 H 2 O/O 3 r 2 = 0.57

18
Hysplit Trajectory for Apr. 25 th 4-5 days crossing time Not clear from trajectory when pollutants were picked up

19
Apr. 9-10 Events – Stratospheric Influence TGM/CO r 2 = 0.36 T sg /CO r 2 = 0.48 O 3 /CO r 2 = 0.03 H 2 O/O 3 r 2 = 0.39

20
Time of O 3 peak (strat. infl.)? Large CO/Tsg peak Apr. 9-10
 Large CO/Tsg peak Apr. 9-10")
21
May 13 Event – Industrial, High O 3 TGM/CO r 2 = 0.20 T sg /CO r 2 = 0.67 O 3 /CO r 2 = 0.40 H 2 O/O 3 r 2 = 0.67

22
Asian Poll.MBL Infl. May 13-14

23
Comparisons Between Major Events Concentration Enhancements Correlation with CO Correlation with O 3

24
Event Scatter Plots of O 3, T sg, TGM, and H 2 O vs. CO

25
Event Scatter Plots of TGM, and H 2 O vs. O 3

26
Comparing CPO and MBO March 28 – May 19 CPO data is “marine” periods only.

27
Conclusions Events are stronger (~50 vs. ~15 ppbv) and more numerous (~3 vs. ~10) at MBO vs. CPO. O 3 moderately well correlated, -- T sg and TGM well correlated with CO at MBO. Background CO 15% elevated at MBO vs. CPO. Background O 3 not significantly higher at MBO.
 at MBO vs. CPO. O 3 moderately well correlated, -- T sg and TGM well correlated with CO at MBO. Background CO 15% elevated at MBO vs. CPO. Background O 3 not significantly higher at MBO..")
28
Conclusions cont. TGM may have sink in stratospheric air and MBL. O 3 /CO relationship often complicated by intrusions of stratospheric air. Apr. 25 th is largest, most coherent event seen, TGM/ CO = ~0.5!

Similar presentations


 Xu, Umme Akhtar, Kyle Clark,>")
 An International Global Atmospheric Chemistry (IGAC) Program.>")


>")


 ITCT 2K2 Introduction Today (briefly): Examine a major Asian emission transport.>")

 MODEL INTERCOMPARISON STUDY ROKJIN.>")

