Download presentation
Presentation is loading. Please wait.

1
SIMS 247 Information Visualization and Presentation Prof. Marti Hearst August 29, 2000

2
What is Information Visualization? visualize: to form a mental image or vision of … visualize: to imagine or remember as if actually seeing. American Heritage dictionary, Concise Oxford dictionary

3
What is Information Visualization? ``Transformation of the symbolic into the geometric'' (McCormick et al., 1987) (McCormick et al., 1987) ``... augmenting … natural intelligence in the best ``... augmenting … natural intelligence in the best possible way,... finding the artificial memory that best possible way,... finding the artificial memory that best supports our natural means of perception.'' supports our natural means of perception.'' (Bertin, 1983) (Bertin, 1983) The depiction of information using spatial or graphical representations, to facilitate comparison, pattern representations, to facilitate comparison, pattern recognition, change detection, and other cognitive skills that make use of the visual system. recognition, change detection, and other cognitive skills that make use of the visual system.
 (McCormick et al., 1987) ``... augmenting … natural intelligence in the best ``... augmenting … natural intelligence in the best possible way,... finding the artificial memory that best possible way,... finding the artificial memory that best supports our natural means of perception. supports our natural means of perception. (Bertin, 1983) (Bertin, 1983) The depiction of information using spatial or graphical representations, to facilitate comparison, pattern representations, to facilitate comparison, pattern recognition, change detection, and other cognitive skills that make use of the visual system. recognition, change detection, and other cognitive skills that make use of the visual system..")
4
Information Visualization Problem:Problem: –HUGE Datasets: How to understand them? SolutionSolution –Take better advantage of human perceptual system –Convert information into a graphical representation. IssuesIssues –How to convert abstract information into graphical form? –Do visualizations do a better job than other methods?

5
Images from yahoo.com Visualization Success Stories

6
Image from mapquest.com The Power of Visualization 1. Start out going Southwest on ELLSWORTH AVE Towards BROADWAY by turning right. 2: Turn RIGHT onto BROADWAY. 3. Turn RIGHT onto QUINCY ST. 4. Turn LEFT onto CAMBRIDGE ST. 5. Turn SLIGHT RIGHT onto MASSACHUSETTS AVE. 6. Turn RIGHT onto RUSSELL ST.

7
Visualization Success Story Mystery: what is causing a cholera epidemic in London in 1854?

8
Visualization Success Stories From Visual Explanations by Edward Tufte, Graphics Press, 1997 Illustration of John Snow’s deduction that a cholera epidemic was caused by a bad water pump, circa 1854. Horizontal lines indicate location of deaths.

9
Visualization Success Stories From Visual Explanations by Edward Tufte, Graphics Press, 1997 Illustration of John Snow’s deduction that a cholera epidemic was caused by a bad water pump, circa 1854. Horizontal lines indicate location of deaths.

10
Goals of Information Visualization Aid in: Analysis Analysis Explanation Explanation Decision Making Decision Making Exploration Exploration Communication Communication Reasoning about Information Reasoning about Information

11
Goals of Information Visualization More specifically, visualization should: –Make large datasets coherent (Present huge amounts of information compactly) –Present information from various viewpoints –Present information at several levels of detail (from overviews to fine structure) –Support visual comparisons –Tell stories about the data
 –Present information from various viewpoints –Present information at several levels of detail (from overviews to fine structure) –Support visual comparisons –Tell stories about the data")
12
Why Visualization? Use the eye for pattern recognition; people are good at scanning scanning recognizing recognizing remembering images remembering images Graphical elements facilitate comparisons via Graphical elements facilitate comparisons via length length shape shape orientation orientation texture texture Animation shows changes across time Animation shows changes across time Important to link with other communication forms Important to link with other communication forms

13
The Role of Computers Hand-drawn illustration throughout human history –Statistical Data Graphics dates from William Playfair (1786) Computers facilitate: – Access to large datasets – Interaction – Animation – Range of scales – Precision – Elimination of tedious work – New methods of display
 Computers facilitate: – Access to large datasets – Interaction – Animation – Range of scales – Precision – Elimination of tedious work – New methods of display")
14
This Course Visualization of large, abstract datasets Examples: Examples: text collections / digital libraries web clickstream data web clickstream data complex information systems your idea goes here

15
What we are not covering Scientific visualizationScientific visualization StatisticsStatistics Cartography (maps)Cartography (maps) EducationEducation GamesGames Computer graphics in generalComputer graphics in general Computational geometryComputational geometry
Cartography (maps) EducationEducation GamesGames Computer graphics in generalComputer graphics in general Computational geometryComputational geometry")
16
A Key Question How do we Convert abstract information into a visual representation While still preserving the underlying meaning And at the same time providing new insight?

17
The Need for Critical Analysis Need to get past the coolness factorNeed to get past the coolness factor What is truly useful?What is truly useful?

18
Open Issues Does visualization help?Does visualization help? –The jury is still out –Still supplemental at best for text collections A correlation with spatial ability Learning effects: with practice ability on visual display begins to equal that of text Does visualization sell?Does visualization sell? –Jury is still out on this one too! This is a hot area! More ideas will appear!This is a hot area! More ideas will appear!

19
Course Format LecturesLectures –Core material –Project suggestions –Guest lectures Student presentationsStudent presentations AssignmentsAssignments –3-4 short assignments (30%) –Midterm project (30%) –Final project (40%) No examsNo exams
 –Midterm project (30%) –Final project (40%) No examsNo exams")
20
Readings Textbook: Robert Spence, Information Visualization, ACM Press, 2000.Textbook: Robert Spence, Information Visualization, ACM Press, 2000. Additional papers will be assignedAdditional papers will be assigned I’ve made a collection of Infoviz books availbale in 210I’ve made a collection of Infoviz books availbale in 210 There are many online resourcesThere are many online resources Software: TBASoftware: TBA

21
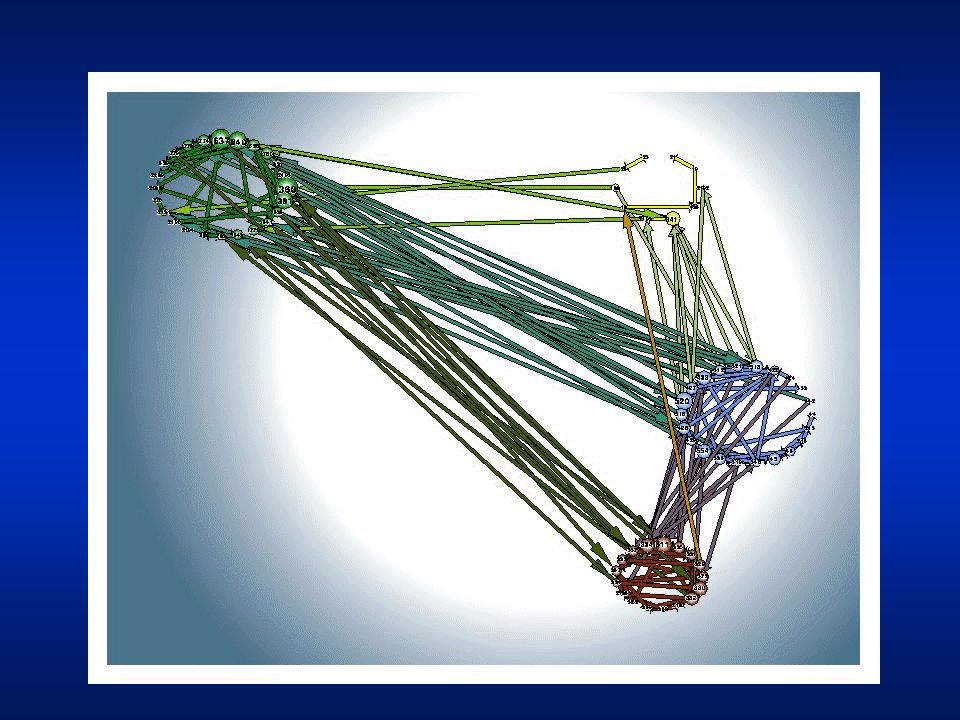
Graphing Networks and Hierarchies How many ways can we display a graph visually?

22
Graph Layout: Avoid Cross-Over

23
Cluster-graphs (Eades & Qingwen 96) tree-like between planesgraph-like within planes
 tree-like between planesgraph-like within planes")
25
File Systems as Trees

26
Image from Hilton Hotels website Web Site Map

27
Image from Dynamic Diagrams, Inc Web Site Map

28
ConeTrees (Robertson et al. 91)
")
30
Hyperbolic ConeTrees (Munzner et al. 96)
")
31
Using Arcs to Reduce Cross-Over (Munzner et al. 96)
")
32
File Systems as Trees: The Treemap (Shneiderman)
")
33
A Good Use of TreeMaps and Interactivity www.smartmoney.com/marketmap

34
Hyperbolic Tree Browser (Lamping et al. 95)
")
35
www.webbrain.com

36
First Assignment Due Sept 5Due Sept 5 –Find an interesting example of visualization in a print medium that you encounter daily Due Thursday (Aug 31)Due Thursday (Aug 31) –Read Preface & Chapter 1 of Textbook –Read Tufte piece on space shuttle disaster
Due Thursday (Aug 31) –Read Preface & Chapter 1 of Textbook –Read Tufte piece on space shuttle disaster")
Similar presentations


 David Lowe Prerequisites: 4 th year ability in CPSC Math 200 (Calculus III) Math 221 (Matrix Algebra: linear.>")


