Download presentation
Presentation is loading. Please wait.

1
NMR Spectroscopy Part I. Origin of NMR

2
Nuclei in Magnetic Field
Nucleus rotate about an axis -- spin Nucleus bears a charge, its spin gives rise to a magnetic field . The resulting magnetic moment is oriented along the axis of spin and is proportional to angular momentum m = g p : magnetic moment p: angular momentum g: magnetogyric ratio

3
Nuclei in Magnetic Field
Spin Quantum Number I a characteristic property of a nucleus. May be an integer or half integer # of protons # of neutrons I even even 0 odd odd integer 1,2,3… even even half integral odd odd half integral

4
Nuclei in Magnetic Field
Properties of nucleus with spin quantum number I 1. An angular momentum of magnitude {I(I+1)}1/2ħ 2. A component of angular momentum mIħ on an arbitrary axis where mI=I, I-1, … -I (magnetic quantum number) 3. When I>0, a magnetic moment with a constant magnitude and an orientation that is determined by the value of mI m = g mI ħ
}1/2ħ. 2. A component of angular momentum mIħ on an arbitrary axis where mI=I, I-1, … -I (magnetic quantum number) 3. When I>0, a magnetic moment with a constant magnitude and an orientation that is determined by the value of mI. m = g mI ħ.")
5
Nuclei in Magnetic Field
In a magnetic field B (in z direction) there are 2I+1 orientations of nucleus with different energies. B0: magnetic field in z direction nL: Larmor Frequency
 there are 2I+1 orientations of nucleus with different energies. B0: magnetic field in z direction. nL: Larmor Frequency.")
6
Nuclei in Magnetic Field
For I=1/2 nucleus : mI = 1/2 and –1/2

7
Nuclei in Magnetic Field

8
Nuclei in Magnetic Field

9
Nuclei in Magnetic Field

10
Nuclei in Magnetic Field

11
Nuclei in Magnetic Field
Distribution between two states

12
Nuclei in Magnetic Field

13
Nuclei in Magnetic Field
Magnetizaton The difference in populations of the two states can be considered as a surplus in the lower energy state according to the Boltzmann distribution A net magnetization of the sample is stationary and aligned along the z axis (applied field direction)
")
14
Nuclei in Magnetic Field
Two spins All spins Sum Bulk Magnetization excess facing down Ho anti-parallel parallel

15
Effect of a radio frequency
hn = DE H1 2. pump in energy p ap 1. equilibrium DE p ap 3. non-equilibrium hn = DE 4. release energy (detect) p ap 5. equilibrium
 p. ap. 5. equilibrium.")
16
Effect of a radio frequency

17
Effect of a radio frequency

18
NMR Signals

19
Relaxation- Return to Equilibrium
x,y plane z axis Transverse Longitudinal 1 1 t t 2 2 E-t/T2 1-e-t/T1 8 8 Transverse always faster!

20
NMR Spectroscopy Part II. Signals of NMR

21
Free Induction Decay (FID)
FID represents the time-domain response of the spin system following application of an radio-frequency pulse. With one magnetization at w0, receiver coil would see exponentially decaying signal. This decay is due to relaxation.

22
Fourier Transform The Fourier transform relates the time-domain f(t) data with the frequency-domain f(w) data.
 data with the frequency-domain f(w) data.")
23
Fourier Transform

24
Fourier Transform

25
NMR line shape Lorentzian line A amplitude W half-line width

26
Resolution Definition
For signals in frequency domain it is the deviation of the peak line-shape from standard Lorentzian peak. For time domain signal, it is the deviation of FID from exponential decay. Resolution of NMR peaks is represented by the half-height width in Hz.

27
Resolution

28
Resolution-digital resolution

29
Resolution Measurement half-height width:
10~15% solution of 0-dichlorobenzene (ODCB) in acetone Line-shape: Chloroform in acetone
 in acetone. Line-shape: Chloroform in acetone.")
30
Resolution Factors affect resolution
Relaxation process of the observed nucleus Stability of B0 (shimming and deuterium locking) Probe (sample coil should be very close to the sample) Sample properties and its conditions
 Probe (sample coil should be very close to the sample) Sample properties and its conditions.")
31
Sensitivity Definition signal to noise-ratio
A : height of the chosen peak Npp : peak to peak noise

32
Sensitivity Measurement 1H 0.1% ethyl benzene in deuterochloroform
13C ASTM, mixture of 60% by volume deuterobenzene and dioxan or 10% ethyl benzene in chloroform 31P 1% trimehylphosphite in deuterobenzene 15N 90% dimethylformamide in deutero-dimethyl- sulphoxide 19F 0.1% trifluoroethanol in deuteroacetone 2H, 17O tap water

33
Sensitivity Factors affect sensitivity Probe: tuning, matching, size
Dynamic range and ADC resolution Solubility of the sample in the chosen solvent

34
Spectral Parameters Chemical Shift Spin-spin Coupling
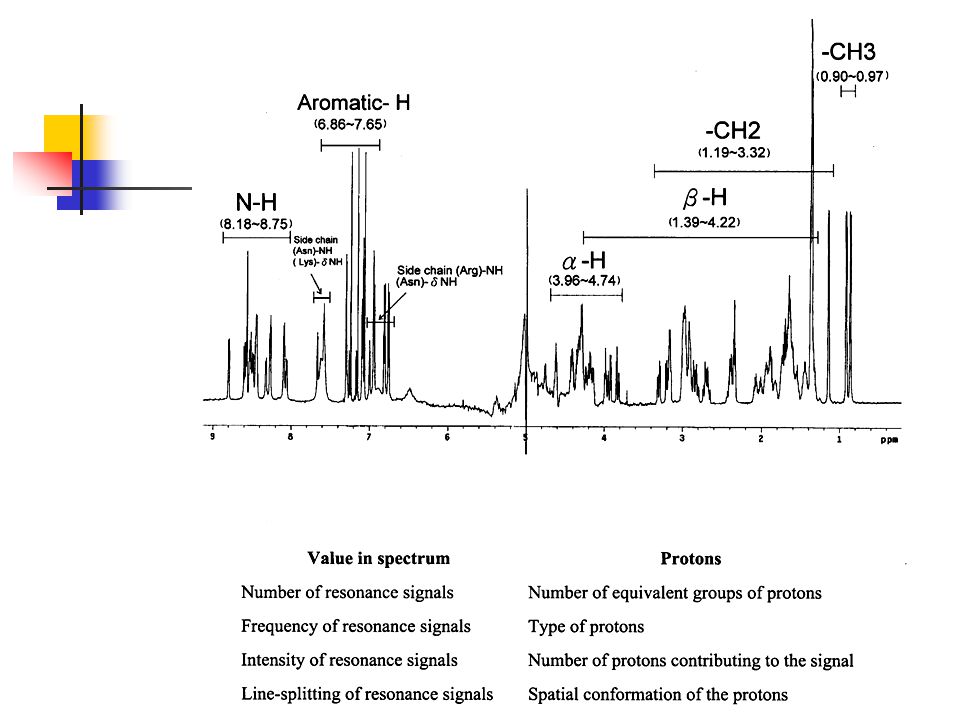
Caused by the magnetic shielding of the nuclei by their surroundings. d-values give the position of the signal relative to a reference compound signal. Spin-spin Coupling The interaction between neighboring nuclear dipoles leads to a fine structure. The strength of this interaction is defined as spin-spin coupling constant J. Intensity of the signal

36
Chemical Shift Origin of chemical shift s shielding constant
Chemically non-equivalent nuclei are shielded to different extents and give separate resonance signals in the spectrum

37
Chemical Shift

38
Chemical Shift d – scale or abscissa scale

39
Chemical Shift Shielding s CH3Br < CH2Br2 < CH3Br < TMS
90 MHz spectrum

40
Abscissa Scale

41
Chemical Shift d is dimensionless expressed as the relative shift in parts per million ( ppm ). d is independent of the magnetic field d of proton 0 ~ 13 ppm d of carbon ~ 220 ppm d of F ~ 800 ppm d of P ~ 300 ppm

42
Chemical Shift Charge density Neighboring group Anisotropy
Ring current Electric field effect Intermolecular interaction (H-bonding & solvent)
")
43
Chemical Shift – anisotropy of neighboring group
c susceptibility r distance to the dipole’s center Differential shielding of HA and HB in the dipolar field of a magnetically anisotropic neighboring group

44
Chemical Shift – anisotropy of neighboring group
d~2.88 d~9-10

45
Electronegative groups are "deshielding" and tend to move NMR signals from neighboring protons further "downfield" (to higher ppm values). Protons on oxygen or nitrogen have highly variable chemical shifts which are sensitive to concentration, solvent, temperature, etc. The -system of alkenes, aromatic compounds and carbonyls strongly deshield attached protons and move them "downfield" to higher ppm values.

46
Electronegative groups are "deshielding" and tend to move NMR signals from attached carbons further "downfield" (to higher ppm values). The -system of alkenes, aromatic compounds and carbonyls strongly deshield C nuclei and move them "downfield" to higher ppm values. Carbonyl carbons are strongly deshielded and occur at very high ppm values. Within this group, carboxylic acids and esters tend to have the smaller values, while ketones and aldehydes have values

47
Ring Current The ring current is induced form the delocalized p electron in a magnetic field and generates an additional magnetic field. In the center of the arene ring this induced field in in the opposite direction t the external magnetic field.

48
Ring Current -- example

49
Spin-spin coupling

50
Spin-spin coupling

51
AX system

52
AX2 system

53
Spin-spin coupling

54
AX3 system

55
Multiplicity Rule Multiplicity M (number of lines in a multiplet)
M = 2n I +1 n equivalent neighbor nuclei I spin number For I= ½ M = n + 1

56
Example AX4 system I=1; n=3 AX4

57
Order of Spectrum Zero order spectrum only singlet
First order spectrum Dn >> J Higher order spectrum Dn ~ J

58
AMX system

59
Spin-spin coupling Hybridization of the atoms
Bond angles and torsional angles Bond lengths Neighboring p-bond Effects of neighboring electron lone-pairs Substituent effect

60
JH-H and Chemical Structure
Geminal couplings 2J (usually <0) H-C-H bond angle hybridization of the carbon atom substituents
 H-C-H bond angle. hybridization of the carbon atom. substituents.")
61
Geminal couplings 2J bond angle

62
Effect of Neighboring p-electrons
Geminal couplings 2J Effect of Neighboring p-electrons Substituent Effects

63
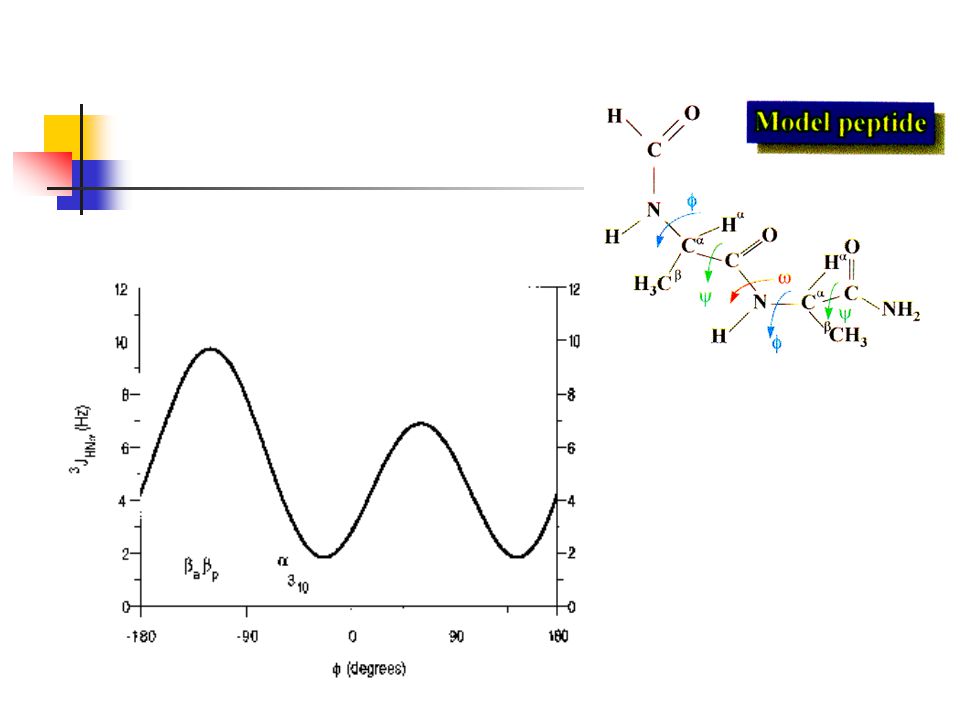
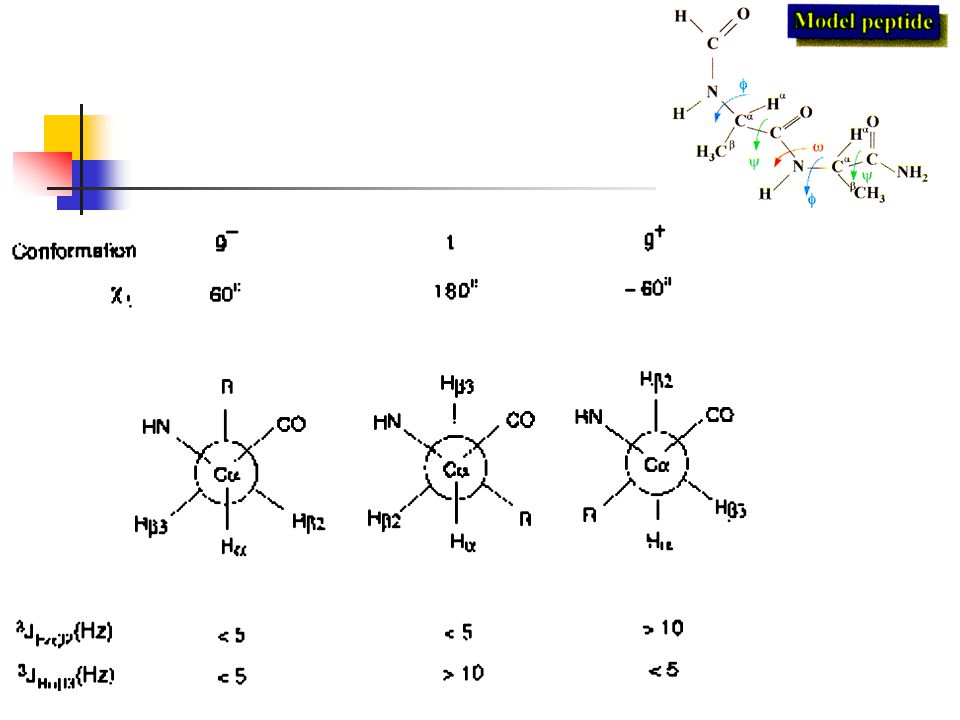
Vicinal couplings 3JH-H
Torsional or dihedral angles Substituents HC-CH distance H-C-C bond angle

64
Vicinal couplings 3JH-H dihedral angles
Karplus curves

65
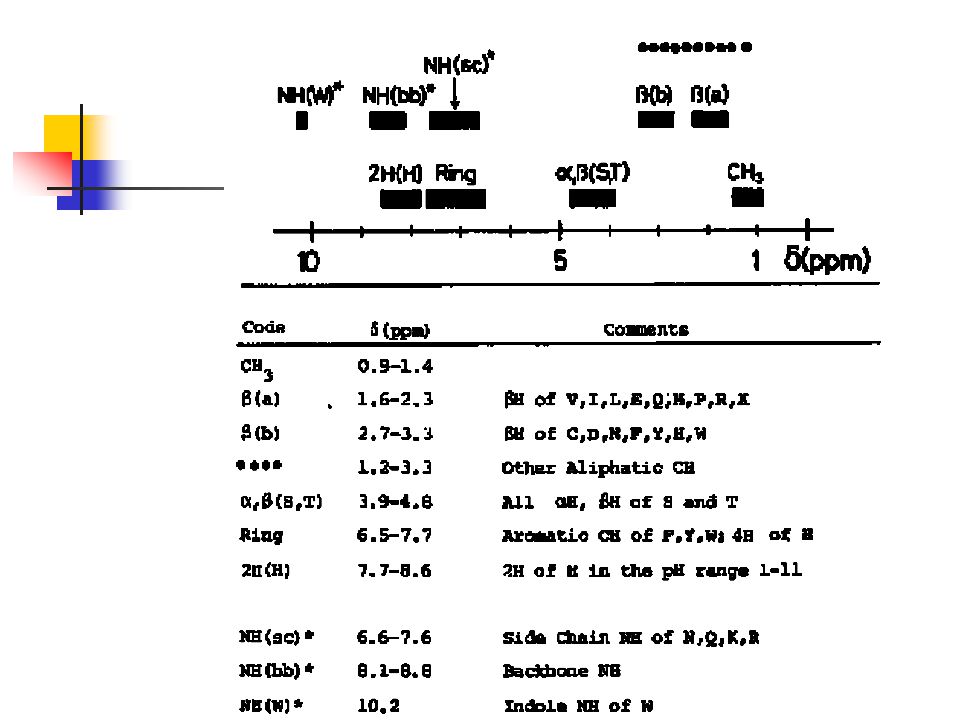
Chemical Shift of amino acid

67
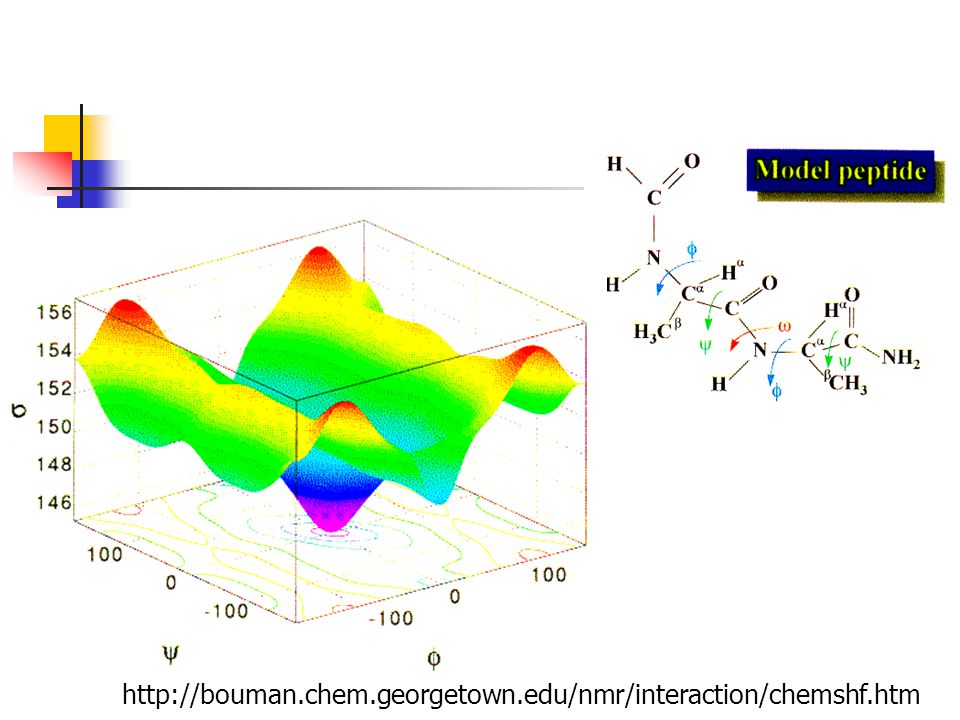
Chemical Shift Prediction
Automated Protein Chemical Shift Prediction BMRB NMR-STAR Atom Table Generator for Amino Acid Chemical Shift Assignments

71
Example 1

72
Relaxation Time Phenomenon & Application
NMR Spectroscopy Relaxation Time Phenomenon & Application

73
Relaxation- Return to Equilibrium
x,y plane z axis Transverse Longitudinal 1 1 t t 2 2 E-t/T2 1-e-t/T1 8 8 Transverse always faster!

74
magnetization vector's trajectory
Relaxation magnetization vector's trajectory The initial vector, Mo, evolves under the effects of T1 & T2 relaxation and from the influence of an applied rf-field. Here, the magnetization vector M(t) precesses about an effective field axis at a frequency determined by its offset. It's ends up at a "steady state" position as depicted in the lower plot of x- and y- magnetizations.
 precesses about an effective field axis at a frequency determined by its offset. It s ends up at a steady state position as depicted in the lower plot of x- and y- magnetizations.")
75
Relaxation The T2 relaxation causes the horizontal (xy) magnetisation to decay. T1 relaxation re-establishes the z-magnetisation. Note that T1 relaxation is often slower than T2 relaxation.
 magnetisation to decay. T1 relaxation re-establishes the z-magnetisation. Note that T1 relaxation is often slower than T2 relaxation.")
76
Relaxation time – Bloch Equation

77
Relaxation time – Bloch equation

78
Spin-lattice Relaxation time (Longitudinal) T1
Relaxation mechanisms: 1. Dipole-Dipole interaction "through space" 2. Electric Quadrupolar Relaxation 3. Paramagnetic Relaxation 4. Scalar Relaxation 5. Chemical Shift Anisotropy Relaxation 6. Spin Rotation

79
Relaxation Spin-lattice relaxation converts the excess energy into translational, rotational, and vibrational energy of the surrounding atoms and molecules (the lattice). Spin-spin relaxation transfers the excess energy to other magnetic nuclei in the sample.
. Spin-spin relaxation transfers the excess energy to other magnetic nuclei in the sample.")
80
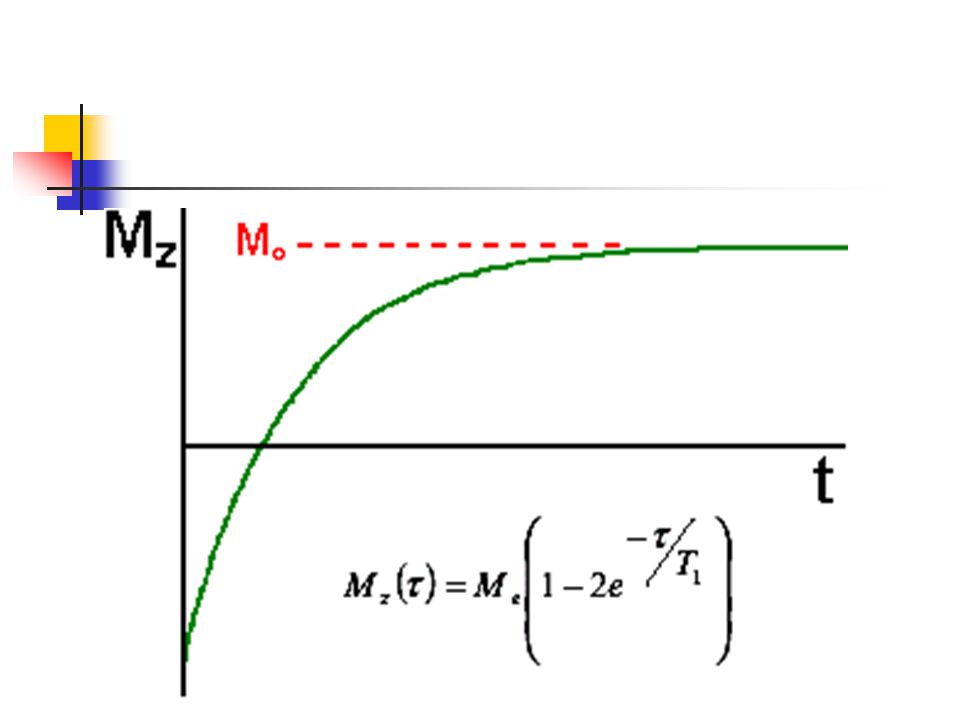
Longitudinal Relaxation time T1
Inversion-Recovery Experiment 180y (or x) 90y tD
 90y. tD.")
82
T1 relaxation

83
Range of interaction (Hz)
relevant parameters Dipolar coupling - abundance of magnetically active nuclei - size of the magnetogyric ratio Quadrupolar coupling - size of quadrupolar coupling constant - electric field gradient at the nucleus Paramagnetic concentration of paramagnetic impurities Scalar coupling size of the scalar coupling constants Chemical Shift Anisotropy (CSA) - size of the chemical shift anisotropy - symmetry at the nuclear site 6- Spin rotation
 size of the chemical shift anisotropy - symmetry at the nuclear site. 6- Spin rotation.")
84
Spin-spin relaxation (Transverse) T2
T2 represents the lifetime of the signal in the transverse plane (XY plane) T2 is the relaxation time that is responsible for the line width. line width at half-height=1/T2
 T2 is the relaxation time that is responsible for the line width. line width at half-height=1/T2.")
85
Spin-spin relaxation (Transverse) T2
Two factors contribute to the decay of transverse magnetization. molecular interactions ( lead to a pure pure T2 molecular effect) variations in Bo ( lead to an inhomogeneous T2 effect)
 variations in Bo. ( lead to an inhomogeneous T2 effect)")
86
Spin-spin relaxation (Transverse) T2
90y 180y (or x) tD tD signal width at half-height (line-width )= (pi * T2)-1
 tD. tD. signal width at half-height (line-width )= (pi * T2)-1.")
87
Spin-spin relaxation (Transverse) T2
 T2")
88
Spin-Echo Experiment

89
Spin-Echo experiment

90
MXY =MXYo e-t/T2

91
Carr-Purcell-Meiboom-Gill sequence

92
T1 and T2 In non-viscous liquids, usually T2 = T1.
But some process like scalar coupling with quadrupolar nuclei, chemical exchange, interaction with a paramagnetic center, can accelerate the T2 relaxation such that T2 becomes shorter than T1.

94
Relaxation and correlation time
For peptides in aqueous solutions the dipole-dipole spin-lattice and spin-spin relaxation process are mainly mediated by other nearby protons

95
Why The Interest In Dynamics?
Function requires motion/kinetic energy Entropic contributions to binding events Protein Folding/Unfolding Uncertainty in NMR and crystal structures Effect on NMR experiments- spin relaxation is dependent on rate of motions know dynamics to predict outcomes and design new experiments Quantum mechanics/prediction (masochism)
")
96
Application

98
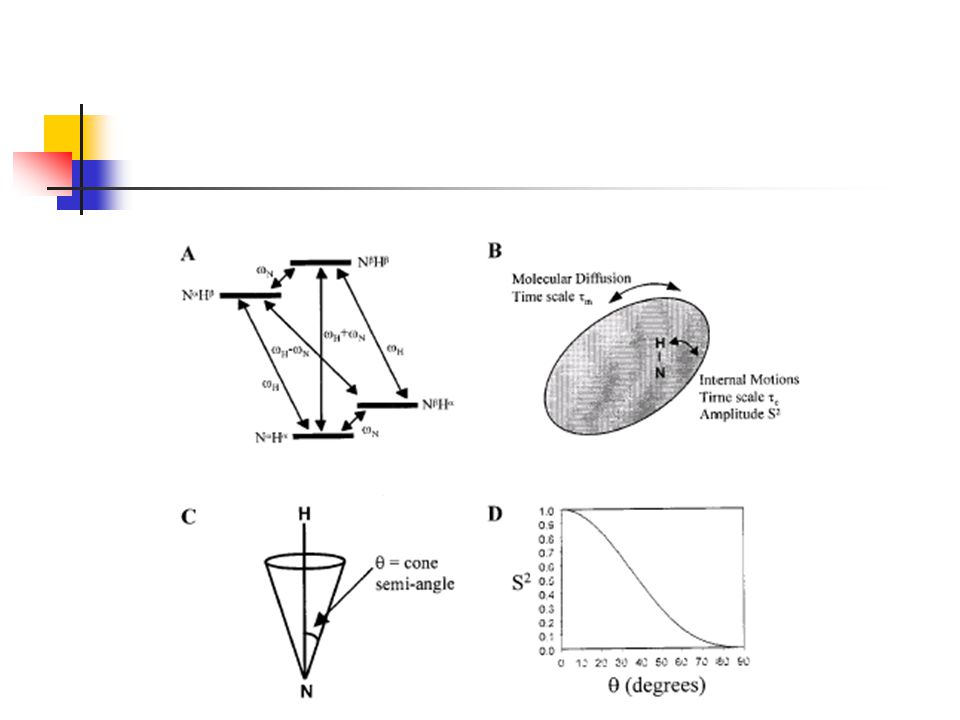
Characterizing Protein Dynamics: Parameters/Timescales
Relaxation

99
NMR Parameters That Report On Dynamics of Molecules
Number of signals per atom: multiple signals for slow exchange between conformational states Linewidths: narrow = faster motion, wide = slower; dependent on MW and conformational states Exchange of NH with solvent: requires local and/or global unfolding events slow timescales Heteronuclear relaxation measurements R1 (1/T1) spin-lattice- reports on fast motions R2 (1/T2) spin-spin- reports on fast & slow Heteronuclear NOE- reports on fast & some slow
 spin-lattice- reports on fast motions. R2 (1/T2) spin-spin- reports on fast & slow. Heteronuclear NOE- reports on fast & some slow.")
100
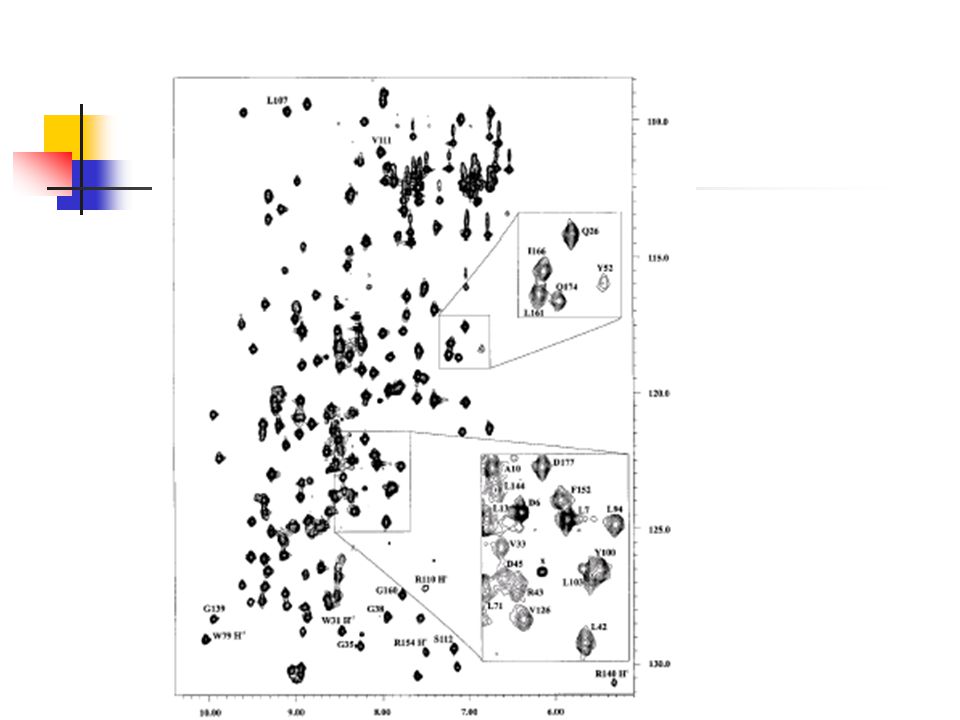
Linewidth is Dependent on MW
A B Small (Fast) Big (Slow) 1H 15N Linewidth determined by size of particle Fragments have narrower linewidths
 Big. (Slow) 1H. 15N. Linewidth determined by size of particle. Fragments have narrower linewidths.")
111
Nuclear Overhauser Effect

112
Nuclear Overhauser Effect (NOE)
A change in the integrated NMR absorption intensity of a nuclear spin when the NMR absorption of another spin is saturated.

113
Nuclear Overhauser Effect

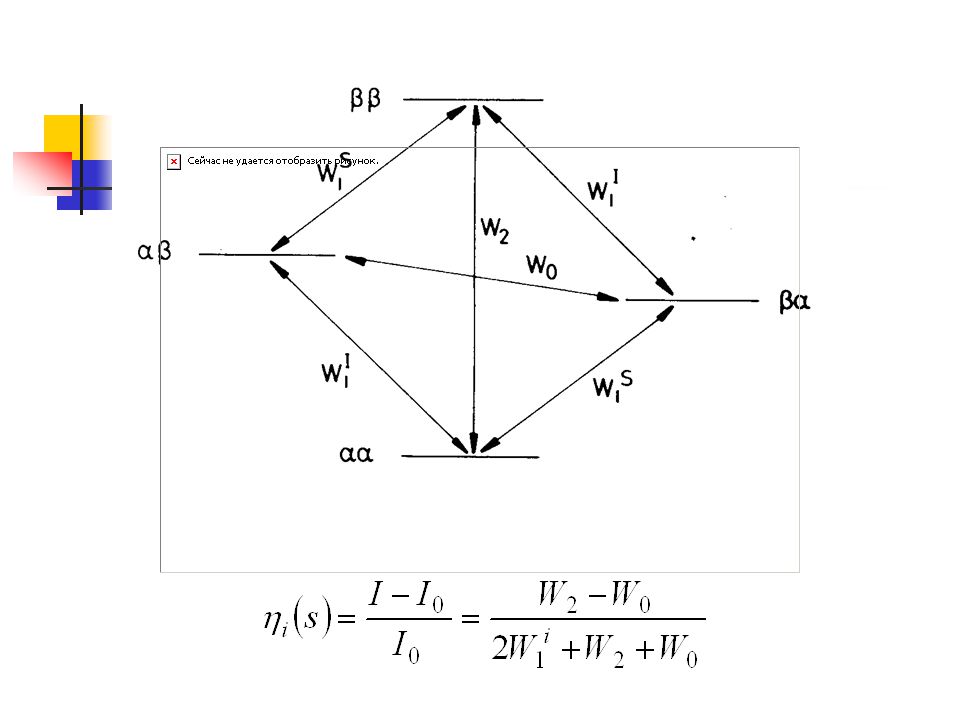
115
Macromolecules or in viscous solution
W0 dominant, negative NOE at i due to s Small molecules in non-viscous solution W2 dominant, positive NOE at i due to s

116
Nuclear Overhauser Effect Brownian motion and NOE

117
When 1/tc >>w0 (or tc2 w02 <<1 ) extreme narrowing limit
 extreme narrowing limit")
118
When 1/tc >> w0 (or tc2 w02 <<1 )
extreme narrowing limit For homo-nuclear hmax = 0.5 For hetro-nuclear hmax = 0.5 (gs/gi)
")
119
When 1/tc ~ w0 (or tc w0 ~ 1 ) M.W.~ 103
W2 and W0 effect are balanced. max ~ 0 improvement: Change solvent ofr temperature Using rotating frame NOE

120
When 1/tc < w0 (or tc w0 >> 1 ) M.W. > 104
W0 dominant , max = -1 application Useful technique for assigning NMR spectra of protein

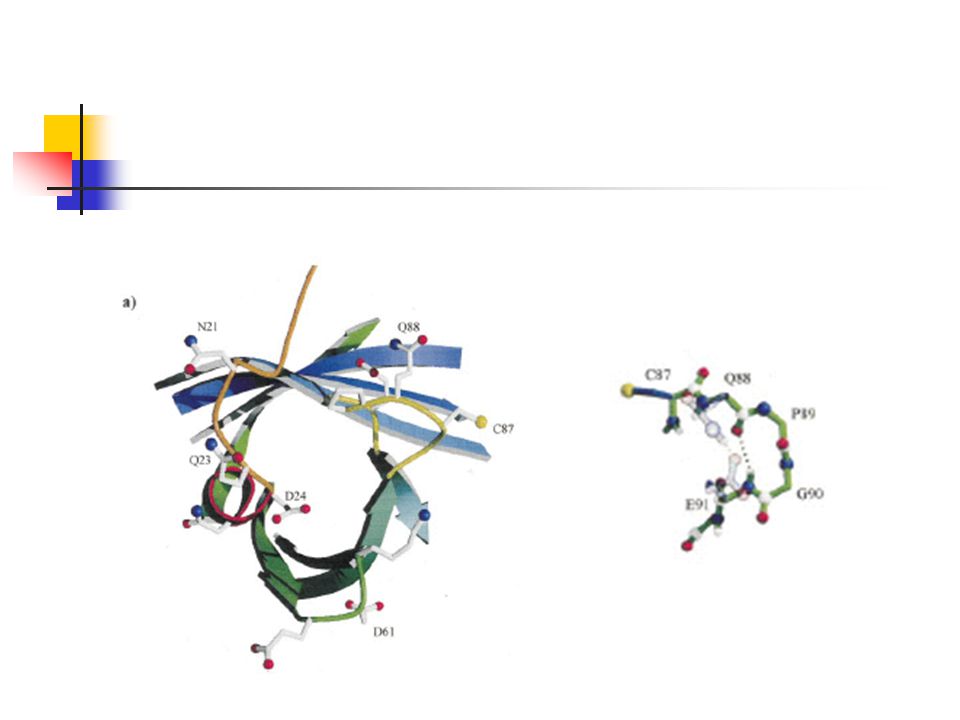
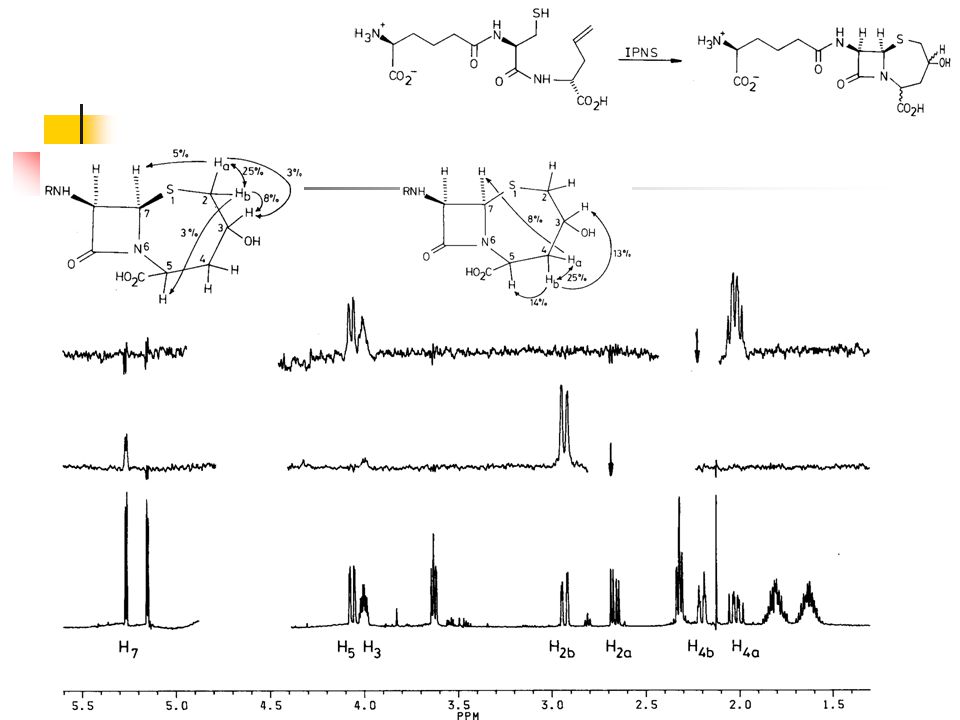
121
Nuclear Overhauser Effect & distance

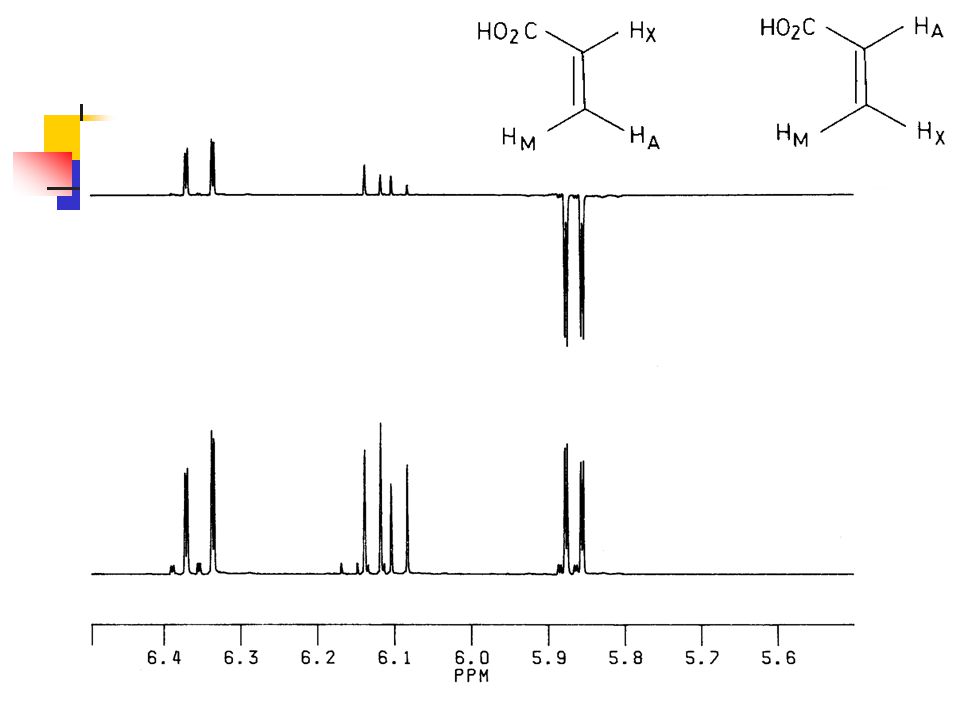
122
citraconic acid mesaconic acid

Similar presentations


>")
 (Fall Term, 2005) Department of Chemistry National Sun Yat-sen University 無機物理方法(核磁共振部分)>")


>")


 A photon generates both an electric and a magnetic field A current passing through a wire also generates both an electric and a magnetic.>")


 FID represents the time-domain response of the spin system following application.>")


>")


