Download presentation
Presentation is loading. Please wait.

1
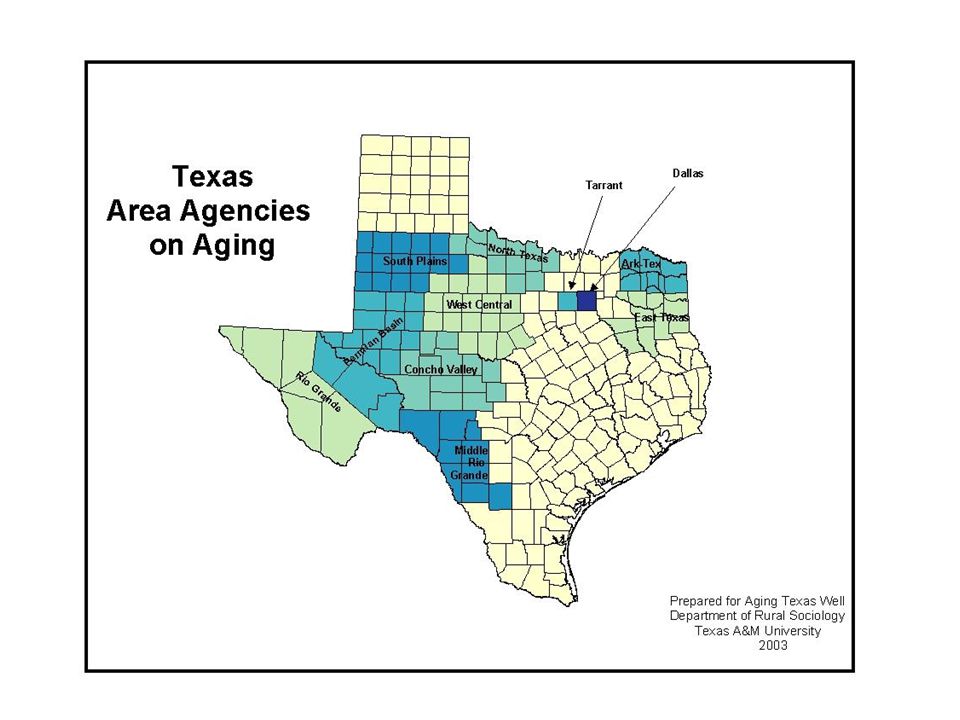
Health and Long-term care Volunteerism Recreation Education Spirituality Social Engagement Transportation Physical Health Mental Health Housing Caregiving Employment Legal Financial Protections Community Supports Rio Grande AAA

2
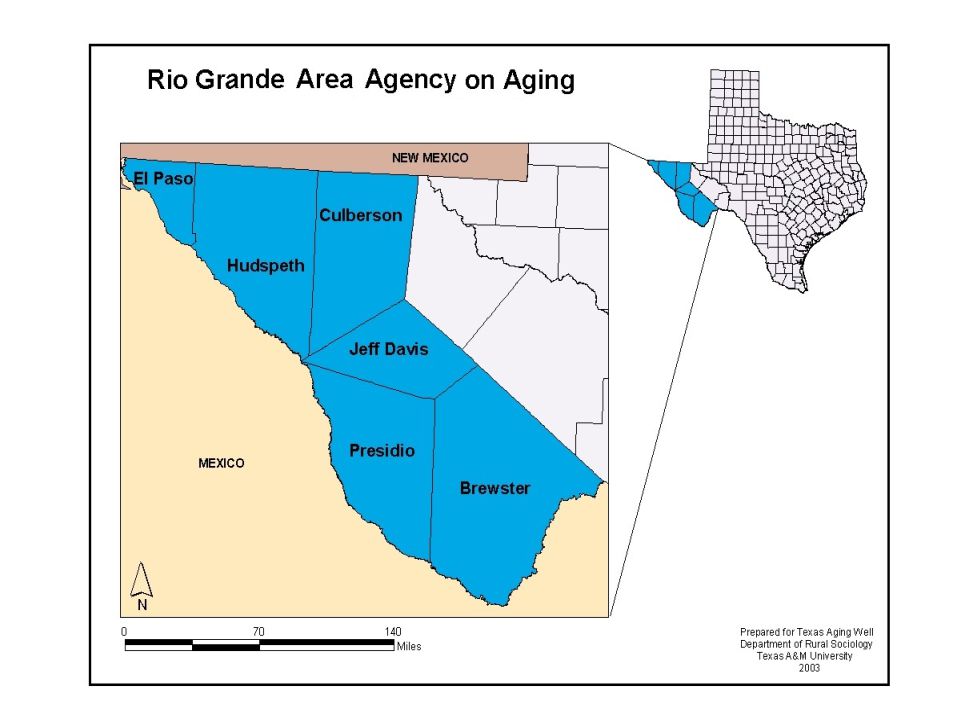
Rio Grande AAA Demographic Profile Cruz C. Torres, RN Ph.D. Department of Rural Sociology Hispanic Research Program

5
Socioeconomic Profile: Income Per capita income for Rio Grande AAA is $13,008 vs. $19,617 for Texas per capita income –Hudspeth County has the lowest per capita income at $9,549 –Jeff Davis County has the highest per capita income at $18,846 Median household income in the Rio Grande AAA is $26,239 vs. $39,927 for Texas –Presidio County has the lowest median household income at $19,860 –Jeff Davis County has the highest median household income at $32,212

6
Socioeconomic Profile: Poverty 23.9% of Rio Grande AAA residents live below poverty vs. 15.4% of Texas residents –Presidio County has highest poverty rate: 36.4% –Jeff Davis County has lowest poverty rate:15.0% 18.9% of Rio Grande AAA elderly live below poverty vs.12.8% of Texas elderly –Presidio County has highest rate of elderly living below poverty, 44.1% – Brewster County has the lowest rate of elderly living below poverty, 13.0%

7
Elderly Household Characteristics 19.5% of Rio Grande AAA households include a member that is 65+ vs. 17.7% of Texas households –Presidio Co. has highest rate of households with someone 65 years old or older, 29.4% –El Paso Co. has the lowest rate of households with someone 65 years old or older, 19.2% 7.0% elderly live alone in Rio Grande AAA compared to 7.3% of Texas elderly –Presidio Co. has the highest rate of elderly living alone, 12.5% –El Paso Co. has the lowest rate of elderly living alone, 6.8% The percent of elderly with disabilities in Rio Grande AAA is 48.1% vs. 44.8% - the State rate –Presidio Co. elderly report the highest disability rate, 59.1% –Culberson Co. elderly report the lowest disability rate, 39.4%

8
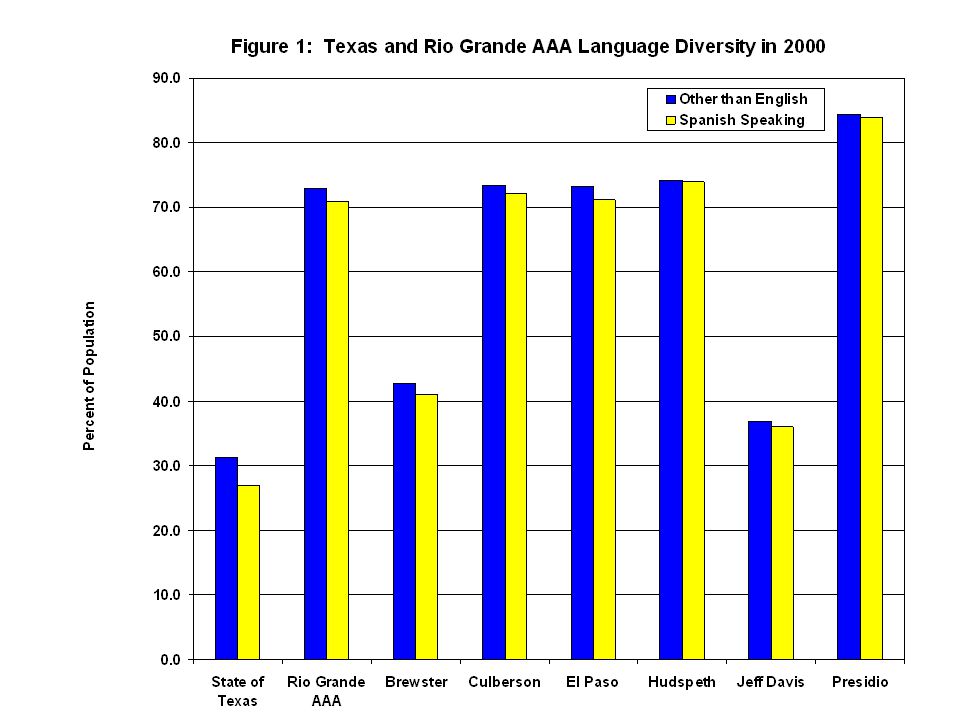
Language & Education Profile 72.9% of Rio Grande AAA residents speak a language other than English vs. 31.2 % of Texas residents –Presidio Co. has highest rate, 84.4% –Jeff Davis Co. has the lowest rate, 36.9% 70.8% of Rio Grande AAA residents speak Spanish vs. 27.0% of Texas residents –Presidio Co. has highest rate of Spanish speakers, 83.9% –Jeff Davis Co. has the lowest rate, 36.0% High School completion or equivalency in Rio Grande AAA is 65.6% vs. 75.7% for Texas –Brewster Co. has highest HS completion rate, 78.6% –Presidio Co. has lowest rate, 44.7%

10
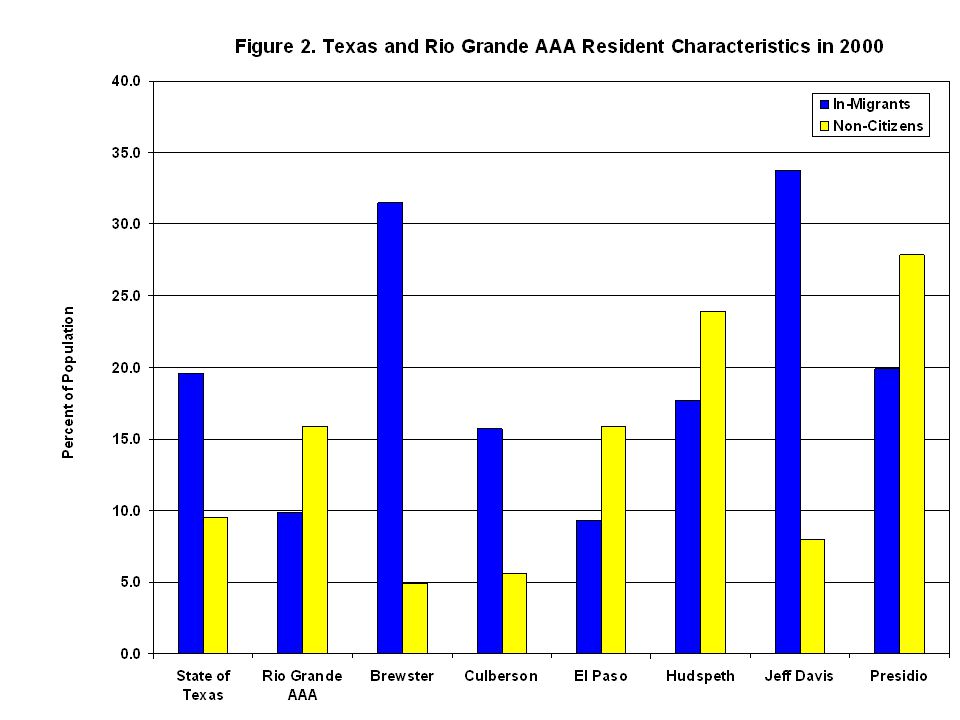
Residency Status of Population In-migration rate for the Rio Grande AAA residents is 9.9% vs. 19.6% for Texas –Jeff Davis Co. has highest in-migration rate, 33.8% –El Paso Co. has lowest in-migration rate, 9.3% Non-citizen rate for Rio Grande AAA residents is 15.9% vs. 9.5% for Texas –Presidio Co. has the highest rate, 27.9% –Brewster Co. has the lowest rate, 4.9%

12
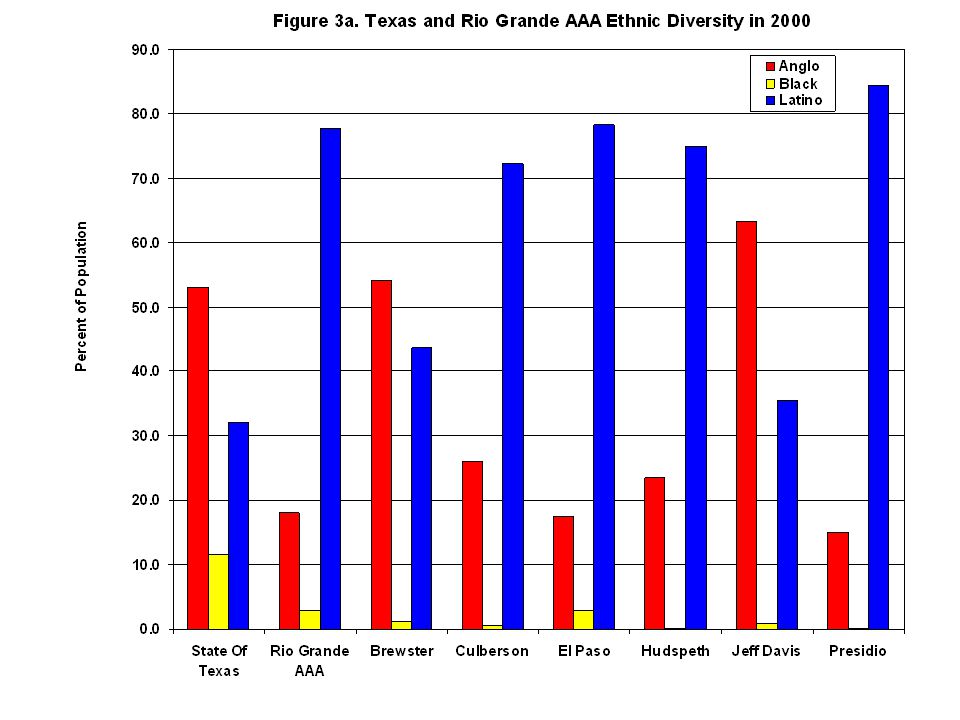
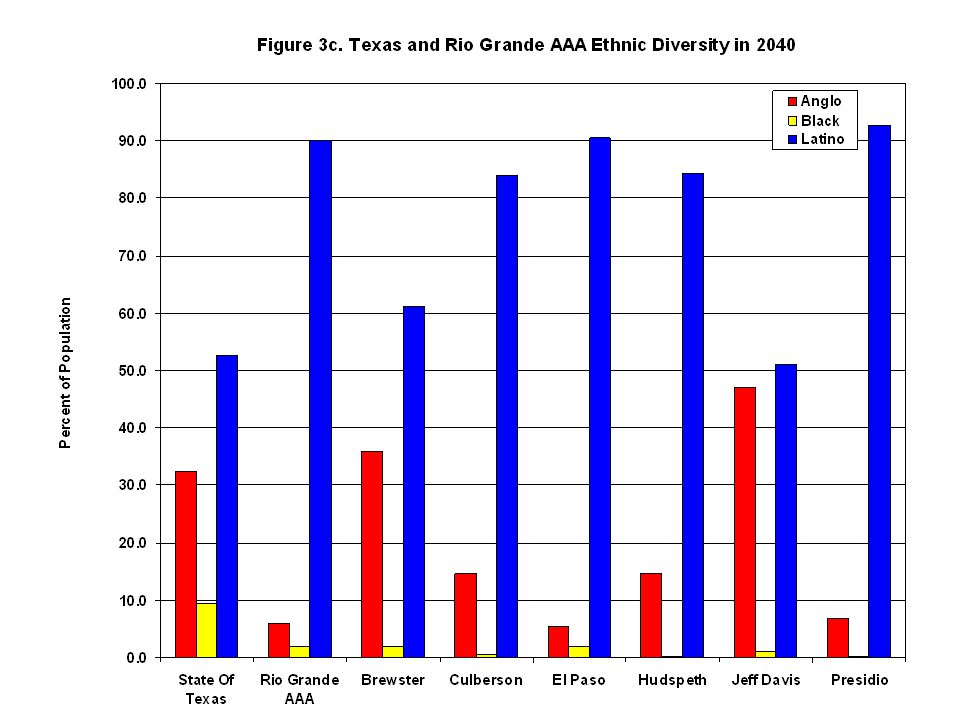
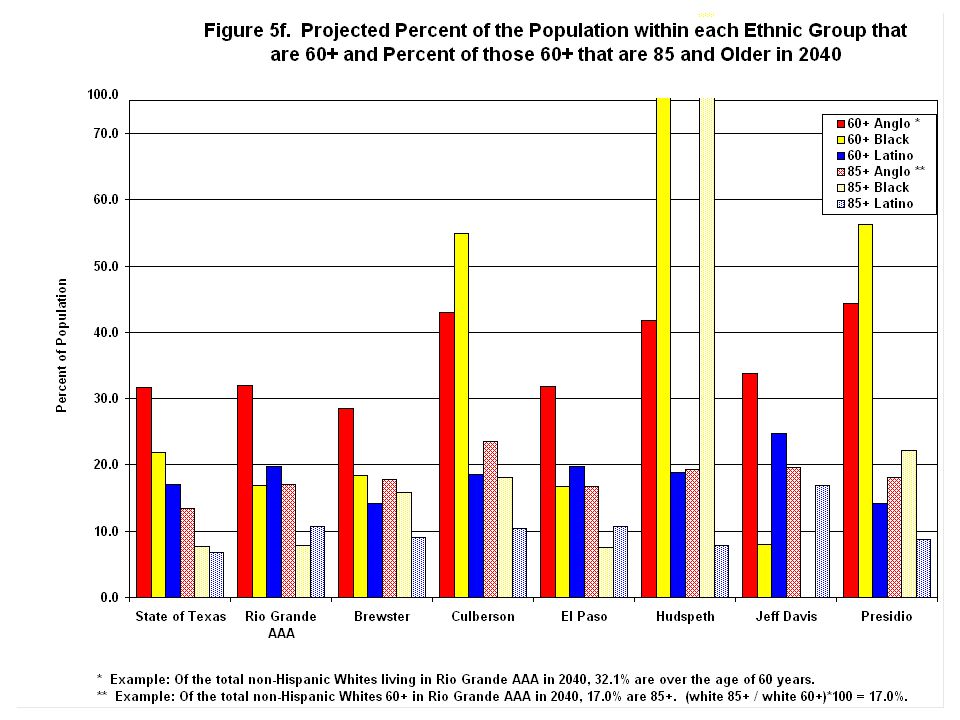
Ethnic Diversity Rio Grande AAA has a lower percent of non-Hispanic White residents than Texas, 18.1% vs. 53.1% –Jeff Davis Co. has highest rate of non-Hispanic Whites, 63.2% –Presidio Co. has lowest rate of non-Hispanic Whites, 15.0% 77.7% of Rio Grande AAA residents are Hispanic vs. 32% of Texas residents –Presidio Co. has highest rate of Hispanics, 84.4% –Jeff Davis Co. has lowest rate of Hispanics, 35.5% 2.8% of Rio Grande AAA residents are African American vs. 11.6% of Texas residents –El Paso Co. has highest rate of African Americans, 2.9% –Hudspeth and Presidio Co. have the lowest rate of African Americans, 0.2% Figures 3a, 3b, 3c illustrate the projected decrease in non- Hispanic Whites and the corresponding increase in Hispanics

15
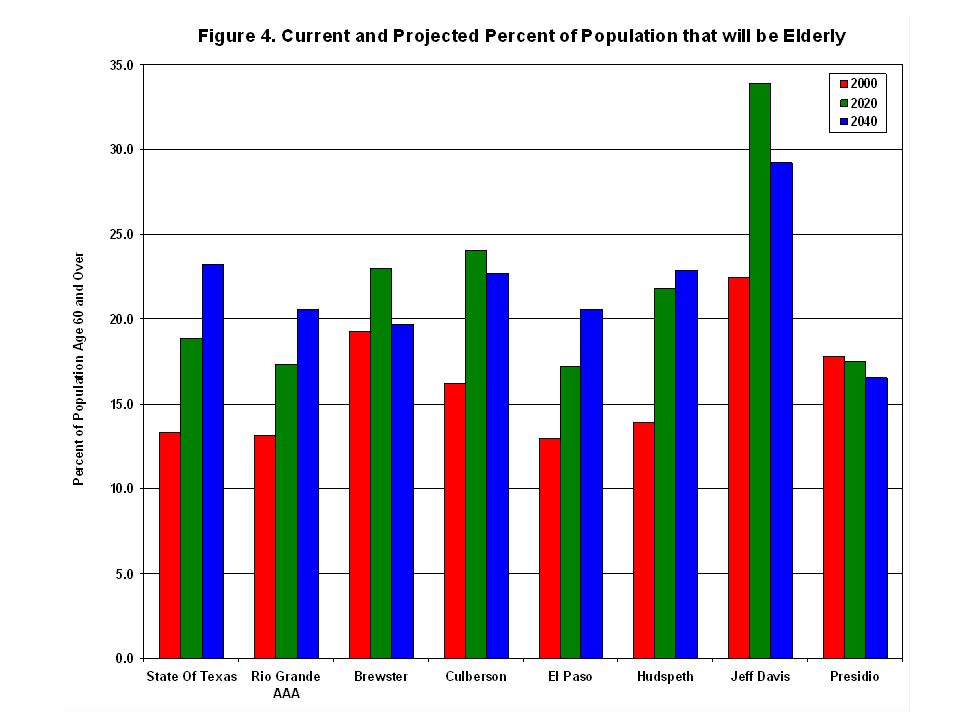
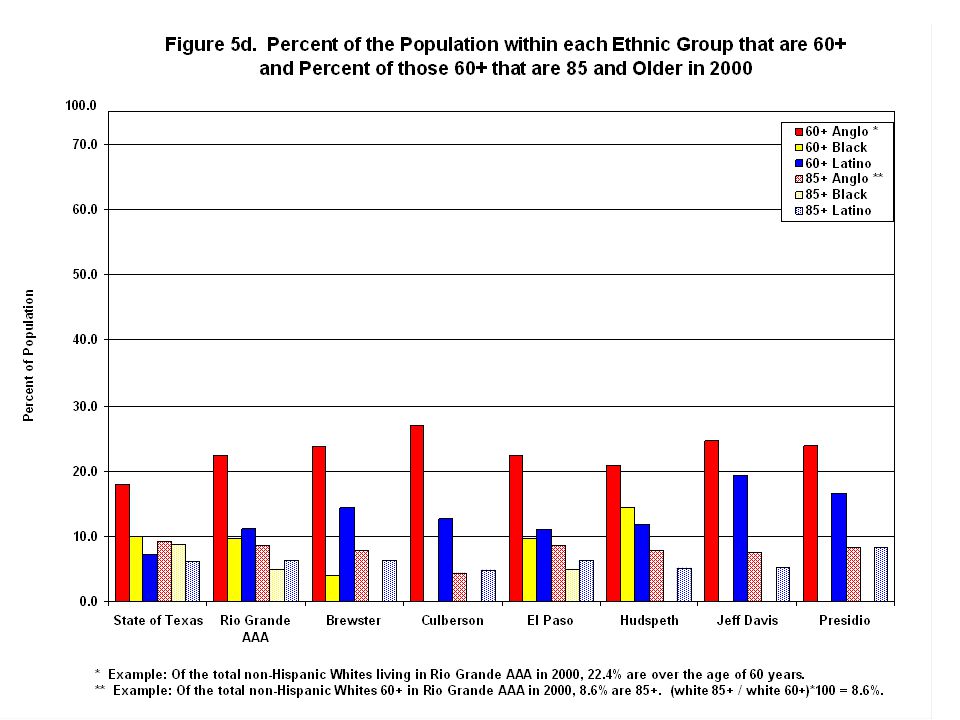
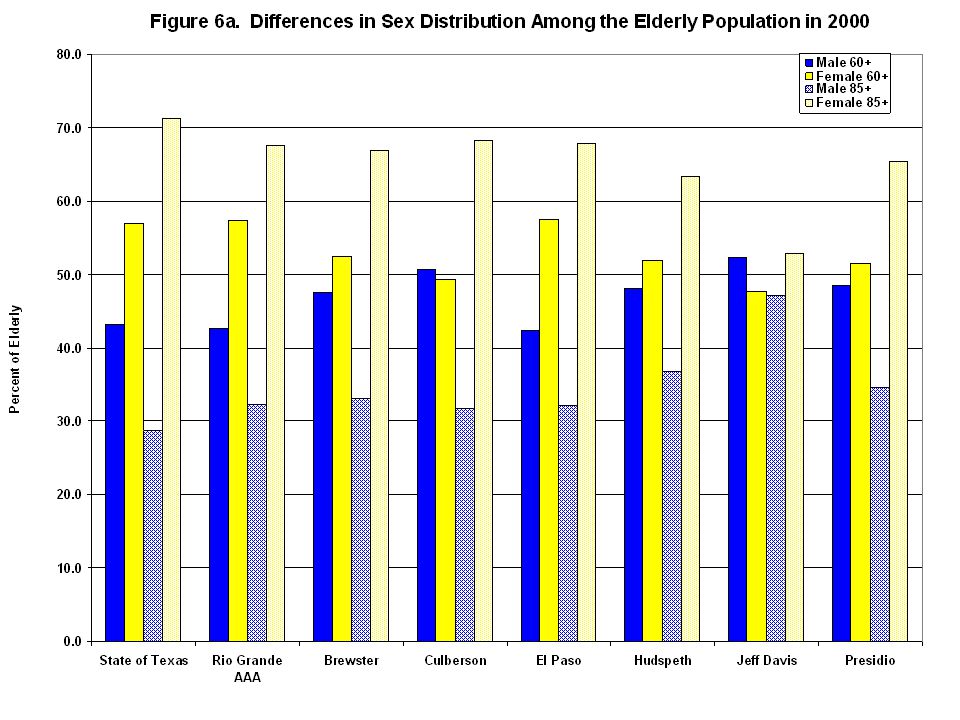
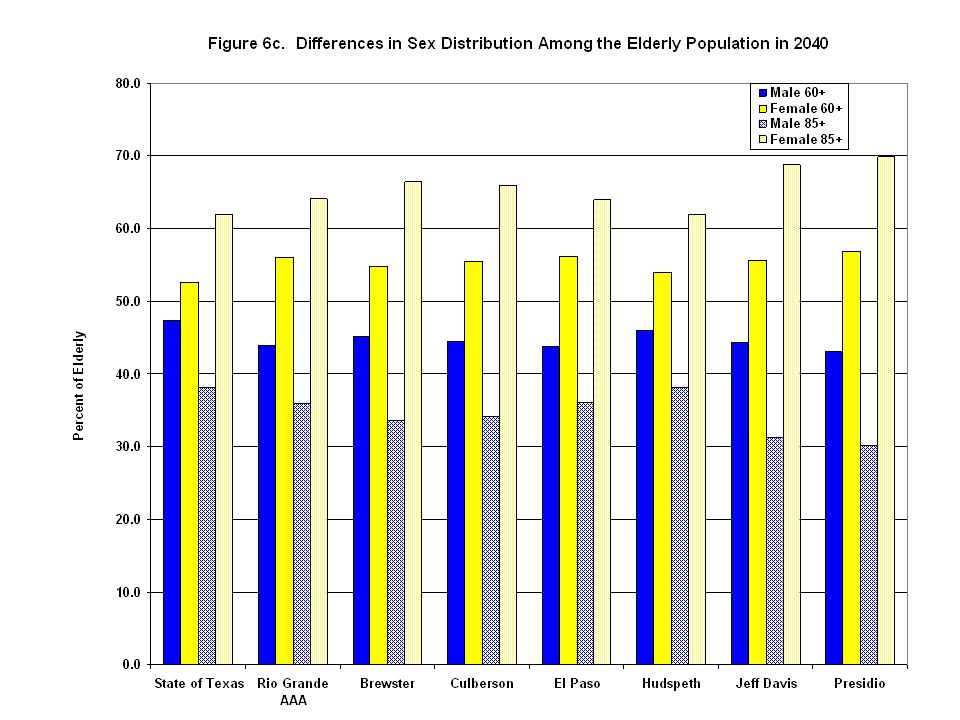
Current & Projected Elderly Population Figure 4 illustrates current and projected elderly percent of population Figures 5a, 5b, 5c illustrate the ethnic shift that will occur in the elderly population by 2040 Figures 5d, 5e, 5f illustrate the increase of elderly within each ethnic population Figures 6a, 6b, 6c illustrate the current and projected sex ratio among the elderly Figures 7a, 7b, 7c (in your packet) illustrate the current and projected proportion of the population that will be elderly for each ethnic group by 2040
 illustrate the current and projected proportion of the population that will be elderly for each ethnic group by 2040")
23
Rio Grande AAA Table 5. Health Care Delivery System Number of doctors in Rio Grande AAA –Total number of physicians by county –Ratio of doctors to population by county Number of nurses in Rio Grande AAA –Total number of nurses by county –Ratio of nurses to population by county Number of dentists in Rio Grande AAA –Total number of dentists by county –Ratio of dentists to population by county Number of hospitals and hospital beds in Rio Grande AAA and AAA counties Number of nursing homes and number of licensed nursing home beds in Rio Grande AAA and AAA counties

24
http://ruralsoc.tamu.edu/presentations.php

Similar presentations


 Anna Rose Steiner Introduction to Geographic Information.>")


