Download presentation
Presentation is loading. Please wait.

1
The Balance Function: Experimental Studies in STAR Marguerite Belt Tonjes, G.D. Westfall, A.M. Vander Molen, the STAR collaboration

2
STAR STAR Solenoidal Tracker At RHIC large acceptance detector with near 4 coverage, study hadrons, jets, event-by-event, high p t particles, strangeness.

4
Selecting Good Data Use Au+Au 130GeV events from Year1 running, summer, 2000 Physics events: –Central trigger –Minimum bias trigger -75cm ≤ vertex z ≤ 75cm -1cm ≤ vertex x ≤ 1cm, -1cm ≤ vertex y ≤ 1cm

5
Selecting good TPC tracks Collaboration-wide selection cuts | | < 1.3 0.1 GeV/c ≤ p t ≤ 2 GeV/c DCA ≤ 1 cm (distance of closest approach to the primary vertex choose tracks from the vertex) Fit points ≥ 15 Fit points/possible points > 0.52
 Fit points ≥ 15 Fit points/possible points > 0.52")
6
PID Compare measured dE/dx with Bethe- Bloch calculation of dE/dx for , K, p, and e. Particles within 2 of predicted ionization are tagged.

7
PID cuts ZPid = ln( I meas /I hyp( ) ) –I meas = measured truncated mean for track –I hyp( ) = expected ionization for hypothesis : p≤0.7 GeV/c, and |ZPidp|≤0.2 K: p≤0.8 GeV/c, |ZpidK|≤0.2, |ZPid |>0.2, |ZPidp|>0.2 P: p≤ 1 GeV/c, |ZPidp|≤0.2, |ZPid |>0.2, |ZPidK|>0.2 E: |ZPide|≤0.2, |ZPid |>0.2, |ZPidK|>0.2, |ZPidp|>0.2
 ) –I meas = measured truncated mean for track –I hyp( ) = expected ionization for hypothesis : p≤0.7 GeV/c, and |ZPidp|≤0.2 K: p≤0.8 GeV/c, |ZpidK|≤0.2, |ZPid |>0.2, |ZPidp|>0.2 P: p≤ 1 GeV/c, |ZPidp|≤0.2, |ZPid |>0.2, |ZPidK|>0.2 E: |ZPide|≤0.2, |ZPid |>0.2, |ZPidK|>0.2, |ZPidp|>0.2")
8
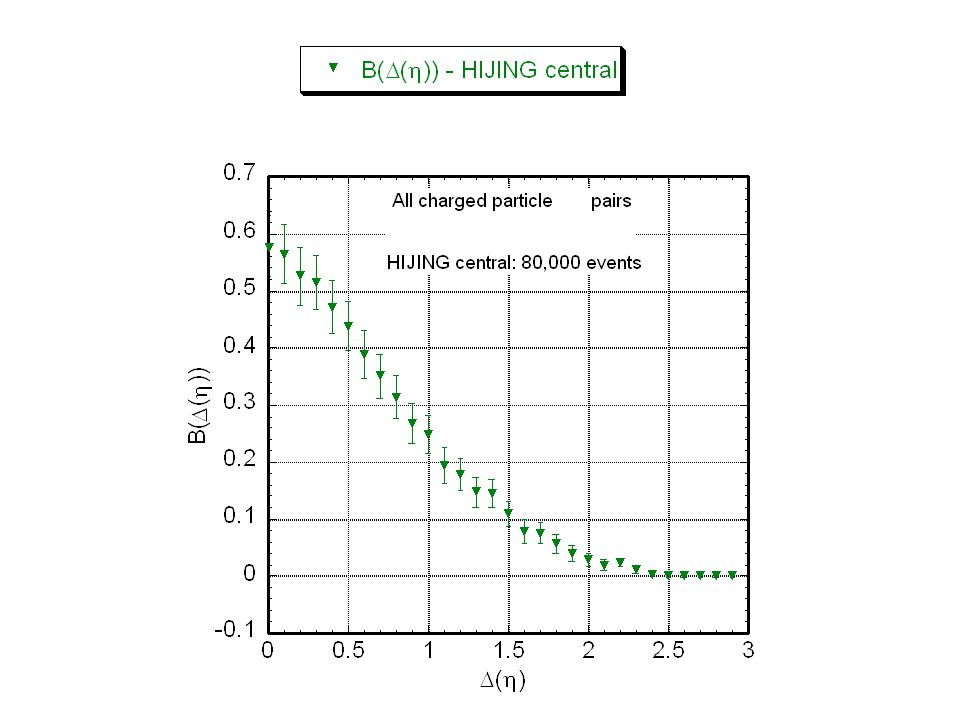
Calculating the Balance Function For pairs: –B = 1/2 { + - /N + + - + /N - - ++ /N + - - - /N - } – +- = Histogram of | y( + ) - y( - ) |, for all possible pairs within an event. This histogram is summed over all events. For charged particle pairs, we sum over all charged particle pairs. – +- = Histogram of | (particle + )- (particle - )|
- (particle - )|.")
12
Conclusions and future analysis More statistics are needed, and are being analyzed We see no difference between central and peripheral events in HIJING HNeed to study beam pipe/detector effects for simulations HStudy p t sensitivity HLook at pp simulations

13
Thanks to Gary Westfall, Skip Vander Molen, Scott Pratt for much discussion of the analysis The STAR Collaboration DOE NSF

Similar presentations


 University of Science and Technology of China (USTC) Brookhaven National Laboratory (BNL)>")


 Sarah LaPointe Wayne State University SVT review, BNL, July 7 th /8.>")


>")


 Sarah LaPointe Wayne State University For the STAR Collaboration.>")
