Download presentation
Presentation is loading. Please wait.

1
BASIC MODELS IN DIAGNOSTICS
PET basics I BASIC MODELS IN DIAGNOSTICS Turku PET Centre

2
Simple methods favoured
to reduce scan time to increase service produced or to allow more scans per patient (whole body imaging) to make it easier for seriously ill patients to produce diagnostic images with better visual quality to produce numerical results with smaller variance to be able to use built-in software Feasible with all scanners and institutions Simplified imaging protocols are favored in diagnostic PET studies. This means we have less data to work with, and therefore we can only apply simplified models in the analysis of data, or we have to make a lot of assumptions. There are very good reasons to keep diagnostic studies simple:
 to make it easier for seriously ill patients. to produce diagnostic images with better visual quality. to produce numerical results with smaller variance. to be able to use built-in software. Feasible with all scanners and institutions. Simplified imaging protocols are favored in diagnostic PET studies. This means we have less data to work with, and therefore we can only apply simplified models in the analysis of data, or we have to make a lot of assumptions. There are very good reasons to keep diagnostic studies simple:")
3
Qualitative analysis: procedure
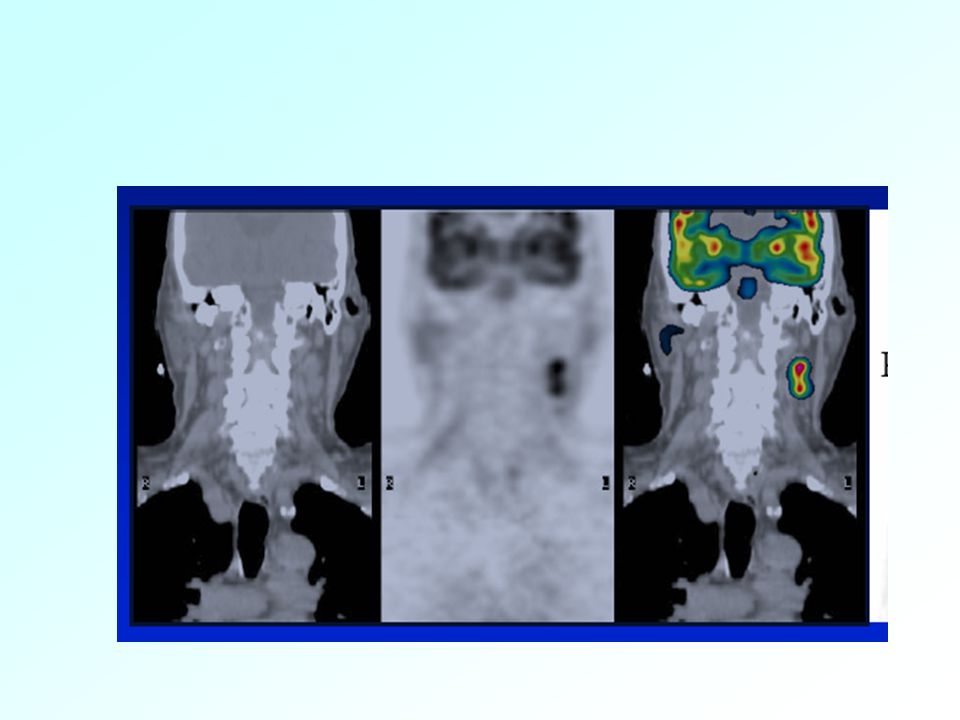
inject the radiotracer (FDG) wait for the radiotracer (re)distribute and accumulate scan (whole body, if possible) visual evaluation of the image: preoperative detection determination of biopsy site differentiating between recurrence and scarring The most simple method allows only qualitative analysis. Basically, you can just look the scanned image, and check if there seems to be any hotspot or lesion.
 wait for the radiotracer (re)distribute and accumulate. scan (whole body, if possible) visual evaluation of the image: preoperative detection. determination of biopsy site. differentiating between recurrence and scarring. The most simple method allows only qualitative analysis. Basically, you can just look the scanned image, and check if there seems to be any hotspot or lesion.")
5
Quantitative analysis
Needed in: intermediate cases (with defined cut-off values) staging of disease detection of residual masses or relapses after radical treatment early monitoring of response to treatment Increases the effect size (but also variation)
 staging of disease. detection of residual masses or relapses after radical treatment. early monitoring of response to treatment. Increases the effect size (but also variation)")
6
Visual assessment Qualitative Semi-quantitative SUV, T/N ratio FUR
MTGA In practical diagnostics the semi-quantitative measures are usually fine. However, those must be validated for all tracers and tissue or cancer types. We will go through these methods in this presentation, but first we need to review some basic ideas behind modeling in PET... Quantitative Compartment model fit

7
What happens to the radiotracer in a PET study?
Radiotracer is administrated as a short bolus into large vein (in forearm) Blood that is coming from all veins is well mixed in the heart Arterial blood carries into all body tissues the same concentration of radiotracer per blood volume Biochemical properties of the tracer and biology of the target tissue determine at which rates the radioactivity accumulates and is washed away First, a few basic things about PET modeling. We are measuring
 Blood that is coming from all veins is well mixed in the heart. Arterial blood carries into all body tissues the same concentration of radiotracer per blood volume. Biochemical properties of the tracer and biology of the target tissue determine at which rates the radioactivity accumulates and is washed away. First, a few basic things about PET modeling. We are measuring.")
8
Arterial blood Brain Myocardium Liver time time time time
In the first phase of the tissue concentration curve we will mainly see the impact from blood in the vascular volume in tissue. This is mainly seen in the beginning, because concentration in blood is later much lower, and because during the first few seconds, the concentration in tissue cells is very low. Next, the curve is mainly affected by perfusion and transport across endothelium and tissue cell membranes. Most of the radiotracer then resides in extracellular space and as free tracer in intracellular space. Then, we will start to see also the effects of specific binding to receptors or enzyme activity, and in the end we may see if the isotope label is trapped inside the cells or if it is released from the cells at some noticeable rate. The released radioactivity need not to be the original radiotracer. The labeled isotope may now be attached to another molecule, that is the product of some enzymatic process. For example, if we have injected C-11 labeled glucose, the glucose molecules are metabolized, and the C-11 label can be attached to many different molecules, which will take part in more biochemical reactions. Carbon dioxide (CO2) will be the first molecule, carrying C-11 label, that leaves the tissue. time time
 will be the first molecule, carrying C-11 label, that leaves the tissue. time. time.")
9
What can be measured? the properties of the tracer determine what properties of the tissue you can measure perfusion and first-pass extraction activity and saturation of membrane transporter activity of enzymatic pathway in tissue concentration and affinity of receptor Select a suitable tracer !

10
Properties of FDG FDG is glucose analogue
Glucose and FDG share (compete for) the same membrane transporters and hexokinase; but with different affinities phosphorylated glucose is further metabolized, but FDG-6-PO4 is not FDG-6-PO4 is trapped inside cells where it is formed (except in liver and kidneys which contain glucose-6-phosphatase) Glucose transporter and hexokinase have different affinities for glucose and FDG. These differences are in opposite directions, therefore these effects more or less cancel out from the net rate of glucose or FDG uptake. When these differences in affinities are lumped together, we get the so called ‘lumped constant’, LC. So usually the lumped constant is close to 1. However, if either transport or phosphorylation becomes more rate-limiting than the other in certain situation, it will affect the outcome of the FDG study. FDG compete for the same transporters and hexokinase. Because the molar amount of FDG is very small (picomolar range) compared to glucose, about 5 mM, the concentration of FDG does not affect the glucose transport or phosphorylation. Instead, the concentration of glucose directly affects the rates for FDG. Thus, in any quantitative analysis, the rates of FDG net uptake are multiplied by the separately measured plasma glucose concentration, to achieve the rate of glucose consumption. Both phosphorylated glucose and phosphorylated FDG are metabolized further, but FDG with much slower rate, so that during the normal PET scan, around 1 – 1.5 hour, it and its metabolites stay in the cells where it is formed. Also the rate of dephosphorylation is very low in most tissues, including tumors; except in liver and kidneys this rate is much higher, therefore the normal calculation models for FDG may not apply to liver and kidneys, especially with longer scan times.
 the same membrane transporters and hexokinase; but with different affinities. phosphorylated glucose is further metabolized, but FDG-6-PO4 is not. FDG-6-PO4 is trapped inside cells where it is formed (except in liver and kidneys which contain glucose-6-phosphatase) Glucose transporter and hexokinase have different affinities for glucose and FDG. These differences are in opposite directions, therefore these effects more or less cancel out from the net rate of glucose or FDG uptake. When these differences in affinities are lumped together, we get the so called ‘lumped constant’, LC. So usually the lumped constant is close to 1. However, if either transport or phosphorylation becomes more rate-limiting than the other in certain situation, it will affect the outcome of the FDG study. FDG compete for the same transporters and hexokinase. Because the molar amount of FDG is very small (picomolar range) compared to glucose, about 5 mM, the concentration of FDG does not affect the glucose transport or phosphorylation. Instead, the concentration of glucose directly affects the rates for FDG. Thus, in any quantitative analysis, the rates of FDG net uptake are multiplied by the separately measured plasma glucose concentration, to achieve the rate of glucose consumption. Both phosphorylated glucose and phosphorylated FDG are metabolized further, but FDG with much slower rate, so that during the normal PET scan, around 1 – 1.5 hour, it and its metabolites stay in the cells where it is formed. Also the rate of dephosphorylation is very low in most tissues, including tumors; except in liver and kidneys this rate is much higher, therefore the normal calculation models for FDG may not apply to liver and kidneys, especially with longer scan times.")
11
[11C]-Methyl-D-glucose
Transported into cells like glucose and FDG, but can not be phosphorylated Could be used to measure glucose transport and glucose concentration in the tissue Not used in diagnostics, but demonstrates the importance of tracer selection! As an example, C-11 labeled methyl-glucose is transported by the GLUT into cells just like glucose and FDG are, but it can not be metabolized there, not even phosphorylated. Therefore it would be an excellent tracer to measure the amount of glucose transporters and glucose concentration inside tissue cells. Currently this tracer is not used in diagnostic PET. But this just demonstrates that you should use the tracer that best identifies the disease.
![[11C]-Methyl-D-glucose](http://slideplayer.com/slide/5169006/16/images/11/%5B11C%5D-Methyl-D-glucose.jpg "Transported into cells like glucose and FDG, but can not be phosphorylated. Could be used to measure glucose transport and glucose concentration in the tissue. Not used in diagnostics, but demonstrates the importance of tracer selection! As an example, C-11 labeled methyl-glucose is transported by the GLUT into cells just like glucose and FDG are, but it can not be metabolized there, not even phosphorylated. Therefore it would be an excellent tracer to measure the amount of glucose transporters and glucose concentration inside tissue cells. Currently this tracer is not used in diagnostic PET. But this just demonstrates that you should use the tracer that best identifies the disease.")
12
Tracer and isotope label
We are interested in the concentration of tracer in tissues (pmol/mL) PET can be used to measure concentration of isotope label (Bq/mL); isotope label is decaying Physical decay of the label, physiological clearance of the tracer, and sensitivity of PET scanner set the limits on how long the tracer concentration can be followed
 PET can be used to measure concentration of isotope label (Bq/mL); isotope label is decaying. Physical decay of the label, physiological clearance of the tracer, and sensitivity of PET scanner set the limits on how long the tracer concentration can be followed.")
13
Tracer and isotope label
Explanation in the next slide...

14
Physical decay PET and blood data is corrected for decay to the common time (usually the time of injection, t=0) Decay-corrected radioactivity concentrations are directly relational to molar concentrations

15
Semiquantitative methods
Standardized uptake value (SUV) sometimes named differential uptake ratio (DUR) or differential absorption ratio (DAR) Tissue-to-reference tissue ratio or tissue-to-normal tissue (T/N) ratio
 sometimes named differential uptake ratio (DUR) or differential absorption ratio (DAR) Tissue-to-reference tissue ratio. or tissue-to-normal tissue (T/N) ratio.")
16
Standardized uptake value 1/3
Enables to compare patients and healthy subjects semi-quantitatively by taking into account different radiotracer doses and different body weight (total distribution space of injected tracer) Total or lean body mass, or body surface area The more radiotracer is injected, the higher the measured tissue radioactivity concentration will be. This is corrected by dividing the tissue concentration by the injected dose. Also the total distribution space of the radiotracer is different between patients. The smaller the patient is, the more radiotracer will accumulate into the tumor. This is taken into account by multiplying the measured tissue radioactivity concentration by the patient weight. Or instead of weight, the lean body mass, or body surface area, could be used to get more accurate SUVs. One more thing that may vary between patients, and during treatment, is the plasma glucose concentration. It has also been suggested that SUVs should be corrected for plasma glucose.
 Total or lean body mass, or body surface area. The more radiotracer is injected, the higher the measured tissue radioactivity concentration will be. This is corrected by dividing the tissue concentration by the injected dose. Also the total distribution space of the radiotracer is different between patients. The smaller the patient is, the more radiotracer will accumulate into the tumor. This is taken into account by multiplying the measured tissue radioactivity concentration by the patient weight. Or instead of weight, the lean body mass, or body surface area, could be used to get more accurate SUVs. One more thing that may vary between patients, and during treatment, is the plasma glucose concentration. It has also been suggested that SUVs should be corrected for plasma glucose.")
17
Standardized uptake value 2/3
Tissue radioactivity and dose must be decay corrected to the same time point Instead of weight, body surface area (BSA) is recently recommended: SUVBSA In FDG PET, correcting for plasma glucose should be considered
 is recently recommended: SUVBSA. In FDG PET, correcting for plasma glucose should be considered.")
18
SUV is time-dependent 3/3
NCI PET Guidelines, 2006

19
Tissue-to-reference tissue ratio 1/3
Inter-individual variation in doses, body weight, and plasma clearance is taken into account by normalizing tissue radioactivity concentration with normal (reference) tissue that is with certainty not affected by the disease Commonly used in the brain studies; cerebellum is often used as reference tissue; or the other hemisphere
 tissue that is with certainty not affected by the disease. Commonly used in the brain studies; cerebellum is often used as reference tissue; or the other hemisphere.")
20
Asymmetry index (AI)
")
21
Tissue-to-reference tissue ratio 2/3
Even simpler method than SUV, because reference tissue is in the same image: no need to calibrate PET scanner no need to worry about physical decay corrections Problems: normal tissue not always available not easy to define the same normal tissue in repeated scans image data in low-uptake tissue may be noisy ratio is a complex function of time

22
Tissue-to-reference tissue ratio 3/3
Muscle is frequently used as reference for tumor FDG uptake in muscle may increase if patient is nervous or position is hard to keep Also, chemotherapy or radiation may also induce changes in the normal tissue.

23
SUV vs T/N ratio Scores SUV T/N ratio “Normal” tissue not required ++
-- Dynamic scanning not required + Blood sampling not required +++++ Time-independent ---- Cross-calibration not required - Independent of plasma clearance

24
What is the optimal scan time?
Initially, do long dynamic PET scans Take blood samples: blood sampling allows to use of quantitative analysis methods that are not time-dependent Calculate results from different time ranges: Select the scan time that best predicts clinical outcome Select the scan time that best correlates with quantitative method

25
If semiquantitative method does not work
develop a new better radiotracer, or collect more information in the PET studies blood sampling dynamic scanning extended scanning times and use kinetic analysis methods to separate the important tissue property from the less important but more prominent ones

26
Tracer concentration in blood
Arterial concentration from injection time to the end of PET scan When used in the kinetic model: accounts for plasma clearance reference tissue is not needed (but may be useful, if it exists)
")
27
Arterial blood curve Arterial catheterization:
Burdensome Applied in diagnostic studies only if absolutely necessary Non-invasively from dynamic PET image if heart is visible, or if abdominal aorta is visible, or if other main arteries are visible with high-resolution scanners The image resolution does not have to be very good, if it is precisely known, and if arterial inner diameter can be measured, for example from CT or MR image. PET-CT is marvellous for this purpose!

28
Arterialized venous blood curve
Venous blood curve can not be used, because it has very different shape (lower peak) Solution: hand is warmed to increase blood flow and shunting Resulting venous blood curve is acceptable for diagnostic studies Venous blood curve represents partly arterial curve, but mostly it represents the tissues where it comes from.
 Solution: hand is warmed to increase blood flow and shunting. Resulting venous blood curve is acceptable for diagnostic studies. Venous blood curve represents partly arterial curve, but mostly it represents the tissues where it comes from.")
29
Quantitative methods Multiple-time graphical analysis (MTGA):
Gjedde-Patlak plot (“Patlak”) Fractional uptake rate (FUR) Logan plot Compartment model fit Distributed model Spectral analysis In multiple-time graphical analysis the tracer concentration curves of tissue region-of-interest and arterial plasma are transformed and combined into a single curve that approaches linearity when certain conditions are reached. The data could be plotted in a graph, and line can be fitted to the linear phase. The slope of the fitted line represents the net uptake rate of the tracer or volume of distribution. In some instances a reference region curve can be used in place of arterial plasma input. The graphical analysis methods are independent of any particular model structure, although the slope can be interpreted in terms of a combination of model parameters for some model structure. Graphical analysis methods have been developed for reversibly and irreversibly binding tracers (Logan 2000; Logan 2003).
 Fractional uptake rate (FUR) Logan plot. Compartment model fit. Distributed model. Spectral analysis. In multiple-time graphical analysis the tracer concentration curves of tissue region-of-interest and arterial plasma are transformed and combined into a single curve that approaches linearity when certain conditions are reached. The data could be plotted in a graph, and line can be fitted to the linear phase. The slope of the fitted line represents the net uptake rate of the tracer or volume of distribution. In some instances a reference region curve can be used in place of arterial plasma input. The graphical analysis methods are independent of any particular model structure, although the slope can be interpreted in terms of a combination of model parameters for some model structure. Graphical analysis methods have been developed for reversibly and irreversibly binding tracers (Logan 2000; Logan 2003).")
30
Gjedde-Patlak plot There can be any number of reversible compartments, where the tracer can come and go. After some time, tracer concentrations in these compartments start to follow the tracer concentration changes in plasma (ratio does not change). Then, any change in the total tissue concentration (measured by PET) per plasma concentration, represents the change in irreversible compartments.
. Then, any change in the total tissue concentration (measured by PET) per plasma concentration, represents the change in irreversible compartments.")
31
Gjedde-Patlak plot When the equilibrium is achieved, the Gjedde-Patlak plot becomes linear. The slope of the linear phase represents the net transfer rate Ki (influx constant). To make it simple, Ki represents the amount of accumulated tracer in relation to the amount of tracer that has been available in plasma. The y axis of plot contains apparent distribution volumes, that is the ratio of concentrations of tracer in tissue and in plasma. On x axis is normalized plasma integral, that is the ratio of the integral of plasma concentration and the plasma concentration. If there is no irreversible binding in the tissue, the resulting Gjedde-Patlak plot becomes horizontal, with slope of zero. In this case MTGA for reversible tracers (Logan plot) should be applied.
. To make it simple, Ki represents the amount of accumulated tracer in relation to the amount of tracer that has been available in plasma. The y axis of plot contains apparent distribution volumes, that is the ratio of concentrations of tracer in tissue and in plasma. On x axis is normalized plasma integral, that is the ratio of the integral of plasma concentration and the plasma concentration. If there is no irreversible binding in the tissue, the resulting Gjedde-Patlak plot becomes horizontal, with slope of zero. In this case MTGA for reversible tracers (Logan plot) should be applied.")
32
Ki and metabolic rate If PET tracer is an analogue of glucose (e.g. [F-18]FDG) or fatty acids (e.g. [F-18]FTHA) or other native substrate, then Ki can be used to calculate the metabolic rate of the native substrate For example; [F-18]FDG PET study:
![Ki and metabolic rate If PET tracer is an analogue of glucose (e.g. [F-18]FDG) or fatty acids (e.g. [F-18]FTHA) or other native substrate, then.](http://slideplayer.com/slide/5169006/16/images/32/Ki+and+metabolic+rate+If+PET+tracer+is+an+analogue+of+glucose+%28e.g.+%5BF-18%5DFDG%29+or+fatty+acids+%28e.g.+%5BF-18%5DFTHA%29+or+other+native+substrate%2C+then..jpg "Ki can be used to calculate the metabolic rate of the native substrate. For example; [F-18]FDG PET study:")
33
Fractional uptake rate (FUR)
For calculation of FUR, plasma TAC is integrated from 0 (injection time) to the middle time of PET frame (or middle point of PET time range when PET scan consists of several frames). Note that integration to the end of PET data would be a mistake. Mean tissue concentration is then divided by plasma integral to get the FUR value.
 to the middle time of PET frame (or middle point of PET time range when PET scan consists of several frames). Note that integration to the end of PET data would be a mistake. Mean tissue concentration is then divided by plasma integral to get the FUR value.")
34
FUR FUR is an approximation to the Gjedde-Patlak plot slope Ki:
at large T (late time after injection) the effective distribution volume term in Gjedde-Patlak analysis is not important, and y axis intercept can be assumed to be 0 Fractional uptake rate was previously sometimes called retention index (Ri)
 the effective distribution volume term in Gjedde-Patlak analysis is not important, and y axis intercept can be assumed to be 0. Fractional uptake rate was previously sometimes called retention index (Ri)")
35
Logan plot Y-axis: Integral of tissue curve divided by tissue concentration X-axis: Integral of plasma curve divided by plasma concentration Slope equals volume of distribution, VT

36
Irreversible or reversible uptake?
Make Gjedde-Patlak plot (MTGA for irreversible tracers If plot becomes linear, then uptake is irreversible (during PET scanning) If plot turns down, try Logan plot (MTGA for reversible tracers) If plot becomes linear, then uptake is reversible
 If plot turns down, try Logan plot (MTGA for reversible tracers) If plot becomes linear, then uptake is reversible.")
37
Summary of MTGA Gjedde-Patlak plot for irreversible uptake, Logan plot for reversible Linearity of plots must be checked; otherwise time-independent Plasma or reference region input can be used, depending on the tracer Outcome from Gjedde-Patlak plot is net influx constant Ki which may be used further to calculate metabolic rate, or Kiref with reference region input Outcome from Logan plot is distribution volume VT, or distribution volume ratio DVR = VT/VTREF with reference region input Easy and fast to calculate pixel-by-pixel from dynamic PET images to produce Ki or VT images

38
Perfusion with [15O]H2O Based on the principle of exchange of inert gas between blood and tissues (Kety-Schmidt, 1945) Perfect first-pass extraction
![Perfusion with [15O]H2O Based on the principle of exchange of inert gas between blood and tissues (Kety-Schmidt, 1945)](http://slideplayer.com/slide/5169006/16/images/38/Perfusion+with+%5B15O%5DH2O+Based+on+the+principle+of+exchange+of+inert+gas+between+blood+and+tissues+%28Kety-Schmidt%2C+1945%29.jpg "Perfect first-pass extraction.")
39
Perfusion with [15O]H2O: ARG
Autoradiographic (ARG) method: min scan time Arterial blood curve from PET image or from arterial line using on-line sampler Partition coefficient of water (p) is assumed to be known; when true value is different, bias is introduced Produces high-quality images of perfusion
![Perfusion with [15O]H2O: ARG](http://slideplayer.com/slide/5169006/16/images/39/Perfusion+with+%5B15O%5DH2O%3A+ARG.jpg "Autoradiographic (ARG) method: min scan time. Arterial blood curve from PET image or from arterial line using on-line sampler. Partition coefficient of water (p) is assumed to be known; when true value is different, bias is introduced. Produces high-quality images of perfusion.")
40
Computation using ARG 1/3
Take measured PET image Calculate the AUC (integral from scan start to end) of each voxel curve create a (look-up) table with two columns in the first column, write perfusion values from the whole physiological range with reasonable distance Perfusion mL*(100g*min)-1 Tissue AUC (Bq/mL)*min 1 2 3 4 ...
 of each voxel curve. create a (look-up) table with two columns. in the first column, write perfusion values from the whole physiological range with reasonable distance. Perfusion mL*(100g*min)-1. Tissue AUC (Bq/mL)*min")
41
Computation using ARG 2/3
take the measured blood curve for each row, calculate the predicted tissue curve with that perfusion (f) and assumed p calculate AUC of predicted tissue curve and write it in the second column
 and assumed p. calculate AUC of predicted tissue curve and write it in the second column.")
42
Computation using ARG 3/3
Go through the AUC image one voxel at a time get the AUC image voxel value look for the closest AUC value from the second column of the table replace the voxel value with the corresponding perfusion value from the first column Now you have a “parametric” image, where each voxel value represents quantitative perfusion in units mL blood / 100 g tissue / min Perfusion mL*(100g*min)-1 Tissue AUC (Bq/mL)*min 1 2389 2 5378 3 7822 4 10231 ... 13106
-1. Tissue AUC (Bq/mL)*min")
43
Region of interest and target size
If target is large, small ROI will give correct result If target is small, result is always underestimated Consistency in defining ROI is extremely important for reliable quantitative results.

44
Region of interest and target size
Guidelines may not give specific instructions on how to draw the ROI. Recommendation is that the same ROI volumes should be sampled on follow-up scans, and they should of course be drawn as close to the original ROI as possible. Threshold technique usually gives the most reliable results. For example, including all pixels within a 50% threshold between maximum pixel value and background value.

45
Region of interest and tissue heterogeneity
Tissue heterogeneity will lead to mixture of tissues inside any ROI At its best, regional result represents the average

46
Models for heterogeneous data
Results from multiple-time graphical analysis (MTGA) represent (weighed) average of tissues inside the ROI Optimal scan time for SUV may change Methods based on assumption of homogenous tissue may lead to over- or underestimation
 represent (weighed) average of tissues inside the ROI. Optimal scan time for SUV may change. Methods based on assumption of homogenous tissue may lead to over- or underestimation.")
47
Clinical model validation
Repeatability coefficient (RC) and intra-class correlation coefficient (ICC) must be high (test-retest setting) Effect size and discriminating power must high (patient-control or treatment-placebo study) Any new simplification needs to be fully evaluated before it is used in large-scale studies
 and intra-class correlation coefficient (ICC) must be high (test-retest setting) Effect size and discriminating power must high (patient-control or treatment-placebo study) Any new simplification needs to be fully evaluated before it is used in large-scale studies.")
48
Selecting the method Follow international guidelines in clinical use
The best method in science lab may not be feasible in clinical lab: Higher dose and longer scan would provide better image quality Blood sampling would increase effect size FDG usually is the only available tracer, although another tracer would provide better results International guidelines are based on a minimum standard that could be followed by all clinical PET centers in the world.

49
PET tracers in diagnostics
Oncology [18F]FDG: general [11C]methionine: glioma [11C]metomidate: adrenal tumours [18F]fluorodopa: neuroendocrine tumours [11C]choline: prostate [11C]asetate: prostate [18F]F2: bone metastases

50
Imaging cellular growth
[11C]Thymidine: marker of DNA synthesis [11C]Methionine: marker of protein synthesis Rapid metabolism and uptake and release of radioactive metabolites make the interpretation of uptake curves difficult Derivatives under validation

51
References In Vivo Imaging of Cancer Therapy. Series: Cancer Drug Discovery and Development. Shields AF, Price P (Eds.); 2007, XII, 326 p., Humana Press. ISBN: Positron Emission Tomography. Basic Sciences. Bailey DL, Townsend DW, Valk PE, Maisey MN (Eds.); 2005, 382 p., Springer. ISBN: Hoekstra CJ, Paglianiti I, Hoekstra OS, Smit EF, Postmus PE, Teule GJJ, Lammertsma AA. Monitoring response to therapy in cancer using [18F]-2-fluoro-2-deoxy-D-glucose and positron emission tomography: an overview of different analytical methods. Eur J Nucl Med. 2000; 27(6): Logan J, Alexoff D, Kriplani A. Simplifications in analyzing positron emission tomography data: effects on outcome measures. Nucl Med Biol. 2007; Shankar LK, et al. Consensus recommendations for the use of [18F]-FDG PET as an indicator of therapeutic response in patients in National Cancer Institute trials. J Nucl Med. 2006; 47(6): van den Hoff J. Principles of quantitative positron emission tomography. Amino Acids 2005; 29:
; 2007, XII, 326 p., Humana Press. ISBN: Positron Emission Tomography. Basic Sciences. Bailey DL, Townsend DW, Valk PE, Maisey MN (Eds.); 2005, 382 p., Springer. ISBN: Hoekstra CJ, Paglianiti I, Hoekstra OS, Smit EF, Postmus PE, Teule GJJ, Lammertsma AA. Monitoring response to therapy in cancer using [18F]-2-fluoro-2-deoxy-D-glucose and positron emission tomography: an overview of different analytical methods. Eur J Nucl Med. 2000; 27(6): Logan J, Alexoff D, Kriplani A. Simplifications in analyzing positron emission tomography data: effects on outcome measures. Nucl Med Biol. 2007; Shankar LK, et al. Consensus recommendations for the use of [18F]-FDG PET as an indicator of therapeutic response in patients in National Cancer Institute trials. J Nucl Med. 2006; 47(6): van den Hoff J. Principles of quantitative positron emission tomography. Amino Acids 2005; 29:")
Similar presentations


>")


 Results Parametric Sinogram PET Image Parametric Image Regional TACs.>")
. What is cancer? Failure of the mechanisms that control growth and proliferation of the cells Uncontrolled (often rapid) growth.>")


