Download presentation
Presentation is loading. Please wait.

2
Chapter 3 Air Temperature

3
Introduction Temperature –the measure of sensible heat of a substance, or –Typically measured or observed at 4 feet above the ground surface Many factors affect the temperature at a location, but there are five key factors...

4
Instrument Shelter Thermometer at 1.2 m Underlying surface – grass or bare soil/dirt Shelter is painted white and has “vents” to allow air to flow through freely Set up so door opens away from Sun (on north side in NH) – why?
 – why")
5
Factors Influencing Temperature 1. Insolation –INcoming SOLar radiATION –affected by rotation and revolution of Earth

6
Factors Influencing Temperature 2. Latitude - in general, temperatures decrease from equator to poles – why? - temps also become more variable with increasing latitude (seasonal variation)
.")
7
Factors Influencing Temperature 3. Surface Type - smoothness (solar noon vs. early AM or late afternoon) - dark vs. light-colored surface –Urban Areas (Tucson and outside Tucson) –(Phoenix) 4. Continentality and the marine effect - “coastal vs. interior location” in text - water heats/cools more slowly than land (specific heat) –San Diego vs. Fargo 5. Elevation - lapse rate - greenhouse effect is less
 - dark vs. light-colored surface –Urban Areas (Tucson and outside Tucson) –(Phoenix) 4. Continentality and the marine effect - coastal vs. interior location in text - water heats/cools more slowly than land (specific heat) –San Diego vs. Fargo 5. Elevation - lapse rate - greenhouse effect is less.")
8
Continentality vs. Marine Effect

9
Temperature Scales and Conversion Three scales: Celsius, Fahrenheit, Kelvin Conversion formulas: 1. Celsius to Fahrenheit: 1.8 x (°C) + 32 2. Fahrenheit to Celsius: (°F – 32) ÷ 1.8 3. Celsius to Kelvin: 273.14 + °C 32°F/ 0°C=Freezing water 212°F/100°C=Boiling water
 Fahrenheit to Celsius: (°F – 32) ÷ Celsius to Kelvin: °C 32°F/ 0°C=Freezing water 212°F/100°C=Boiling water.")
10
Surface Temperature Controlled by balance of energy flow (net radiation of substance) –If net radiation positive, substance heats –If net radiation negative, substance cools 3 Principal ways which energy moves to/from a surface: –1. Latent heat transfer (storage or release of heat due to change of state) Ex: Evap. Cooling OR sweating –2. Conduction (flow of sensible heat via contact) –3. Convection (heat is distributed by rising and mixing)
 Ex: Evap. Cooling OR sweating –2. Conduction (flow of sensible heat via contact) –3. Convection (heat is distributed by rising and mixing).")
11
Daily Cycle of Air Temperature _________is the main cause by the Earth which causes significant variability in incoming solar radiation in a 24-hour period? –Rotation!! (Day=Positive NR, Night=Negative NR) In general, lows temps occur in the morning and high temps occur in the afternoon. A sort of trickle-down effect from insolation to net radiation to daily temperature
 In general, lows temps occur in the morning and high temps occur in the afternoon. A sort of trickle-down effect from insolation to net radiation to daily temperature.")
12
Daily Cycle of Air Temperature – Insolation (step 1) Insolation begins at sunrise, peaks at solar noon, and ends at sunset Daily maximum intensity and total daily insolation vary throughout year (day length, sun angle)
 Insolation begins at sunrise, peaks at solar noon, and ends at sunset Daily maximum intensity and total daily insolation vary throughout year (day length, sun angle)")
13
Daily Cycle of Air Temperature – Net Radiation (step 2) Surplus beginning just after sunrise and ending just prior to sunset, deficit otherwise Magnitude and duration vary throughout year (day length, sun angle... again!)
.")
14
Daily Cycle of Air Temperature – The End Result Min temp occurs around sunrise (longest period of no insolation/negative net radiation); max occurs in mid-afternoon (convection causes mixing of warm/cool air) So... insolation and net radiation affect daily temp cycle (ignoring other conditions like cloudiness, fronts, precipitation, etc.)
.")
15
Human Activity and Temperature How do humans impact temperature? 1. Removal of vegetation – less cooling via transpiration/evapotranspiration 2. Pavement – conduct and hold heat 3. Structures – more absorption; more reflection by vertical surfaces 4. Fuel consumption/exhaust – a/c 5. Greenhouse gases (mostly long-term) # 1 – 4 lead to development of urban heat island
 # 1 – 4 lead to development of urban heat island.")
16
What’s an Urban Heat Island? Warmer area surrounding city due to less vegetation, building structure/components, pavement, and fuel consumption/exhaust Noticeable in both high and low temperatures Does Tucson have one?

17
Rural vs. Urban Climate Warming

18
Vertical Temperature Structure of the Atmosphere With an increase in altitude, temperature can: 1. Lapse rate: temp decrease with height MOST COMMON 2. Inversion: temp increase with height 3. Isothermal layer: no temp change

19
Vertical Temperature Structure of the Atmosphere – Lapse Rate Lapse rate not always the same, but varies with humidity and temperature and moisture advection Measures the drop in temperature in degrees Celsius per 1,000m Just an average rate (6.5°C/1,000m)
")
20
Vertical Temperature Structure of the Atmosphere Thermosphere –Upper layer, temp increases with height –Location of auroras (interaction of ions and radiation) Mesosphere –3 rd layer, temp decreases with height until mesopause –Lowest average temperatures in atmosphere (-90°C) Stratosphere –Next layer, strong ozone presence –Temp increases with altitude until stratopause Troposphere –Lowest layer, where most weather phenomena occur –Temp decreases with altitude until tropopause
 Mesosphere –3 rd layer, temp decreases with height until mesopause –Lowest average temperatures in atmosphere (-90°C) Stratosphere –Next layer, strong ozone presence –Temp increases with altitude until stratopause Troposphere –Lowest layer, where most weather phenomena occur –Temp decreases with altitude until tropopause")
21
Vertical Temperature Structure of the Atmosphere

22
Annual Cycle of Air Temperature Revolution and tilt of axis variations in day length insolation variation cycle of net radiation cycle of mean (average) monthly temperatures Also affected by: 1.Elevation3. Continentality vs. marine effect 2.Latitude4. Albedo

23
World Temperature Characteristics Common practice is to analyze January and July temperature – why? Study both spatial and temporal patterns Isotherms-lines that are drawn on a map to connect locations having the same temperature –World patterns of isotherms 1. Latitude 2. Coast/Interior 3. Elevation

24
Spatial Temperature Patterns General decrease with increasing latitude (large annual insolation variation) Large land masses in high latitudes get VERY COLD (snow cover high albedo) Little change in equatorial regions (small annual insolation variation) Large north-south shift in isotherms over land, less over oceans (continentality, marine effect) High-elevations cold vs low elevations (lapse rate) Perpetually ice- and snow-covered regions always much colder than elsewhere (high elevation, high albedo)
 Large land masses in high latitudes get VERY COLD (snow cover high albedo) Little change in equatorial regions (small annual insolation variation) Large north-south shift in isotherms over land, less over oceans (continentality, marine effect) High-elevations cold vs low elevations (lapse rate) Perpetually ice- and snow-covered regions always much colder than elsewhere (high elevation, high albedo)")
25
Spatial Temperature Patterns

26
Temporal Temperature Patterns Annual range increases with latitude (insolation variations) Largest annual ranges over arctic/sub-arctic zones of Asia and North Am. (insolation) Moderately large ranges over tropical deserts (continentality) At same latitude, annual range over ocean less than over land (marine effect) Annual range very low over tropical oceans (little annual insolation variation, marine effect)
 Moderately large ranges over tropical deserts (continentality) At same latitude, annual range over ocean less than over land (marine effect) Annual range very low over tropical oceans (little annual insolation variation, marine effect).")
27
Temporal Temperature Patterns

29
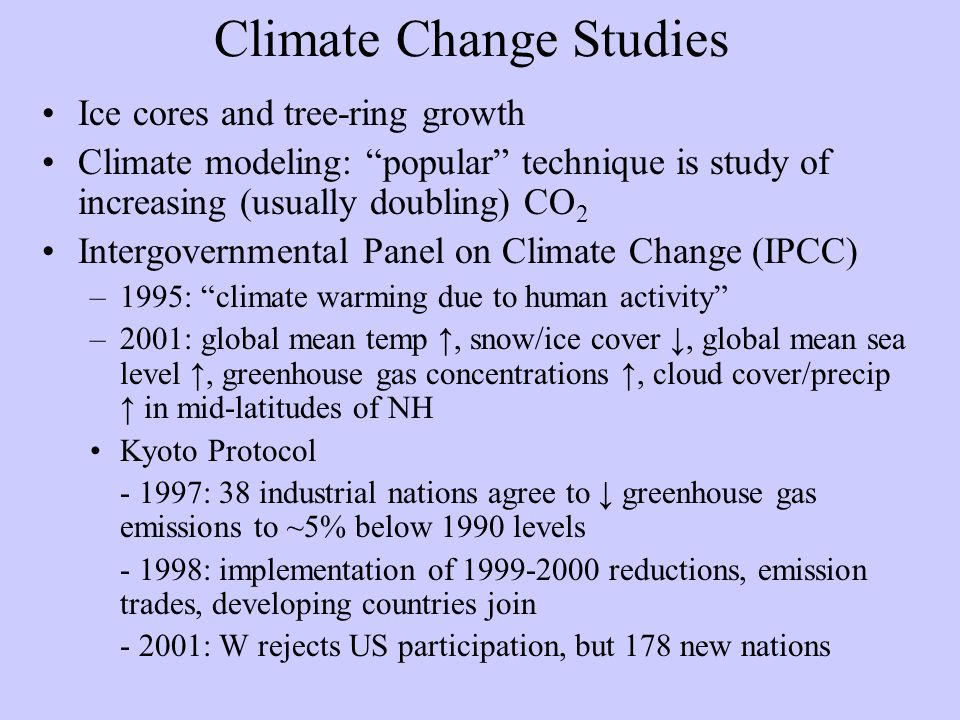
Climate Change Studies Ice cores and tree-ring growth Climate modeling: “popular” technique is study of increasing (usually doubling) CO 2 Intergovernmental Panel on Climate Change (IPCC) –1995: “climate warming due to human activity” –2001: global mean temp ↑, snow/ice cover ↓, global mean sea level ↑, greenhouse gas concentrations ↑, cloud cover/precip ↑ in mid-latitudes of NH Kyoto Protocol - 1997: 38 industrial nations agree to ↓ greenhouse gas emissions to ~5% below 1990 levels - 1998: implementation of 1999-2000 reductions, emission trades, developing countries join - 2001: W rejects US participation, but 178 new nations
 CO 2 Intergovernmental Panel on Climate Change (IPCC) –1995: climate warming due to human activity –2001: global mean temp ↑, snow/ice cover ↓, global mean sea level ↑, greenhouse gas concentrations ↑, cloud cover/precip ↑ in mid-latitudes of NH Kyoto Protocol : 38 industrial nations agree to ↓ greenhouse gas emissions to ~5% below 1990 levels : implementation of reductions, emission trades, developing countries join : W rejects US participation, but 178 new nations")
Similar presentations