Download presentation
Presentation is loading. Please wait.

1
Spline Garch as a Measure of Unconditional Volatility and its Global Macroeconomic Causes Robert Engle and Jose Gonzalo Rangel NYU and UCSD

2
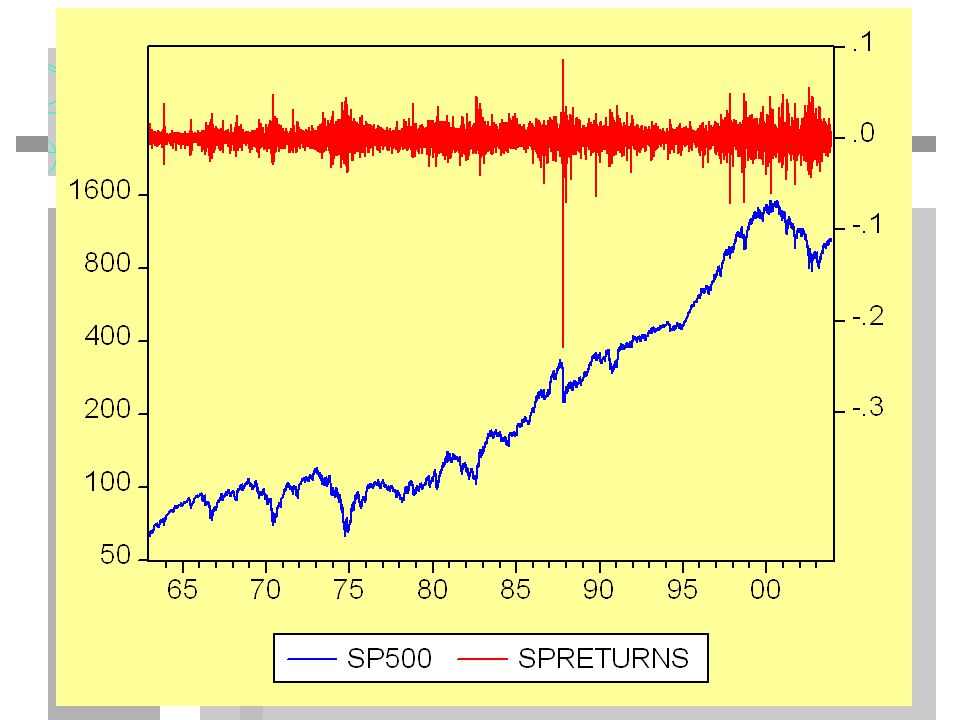
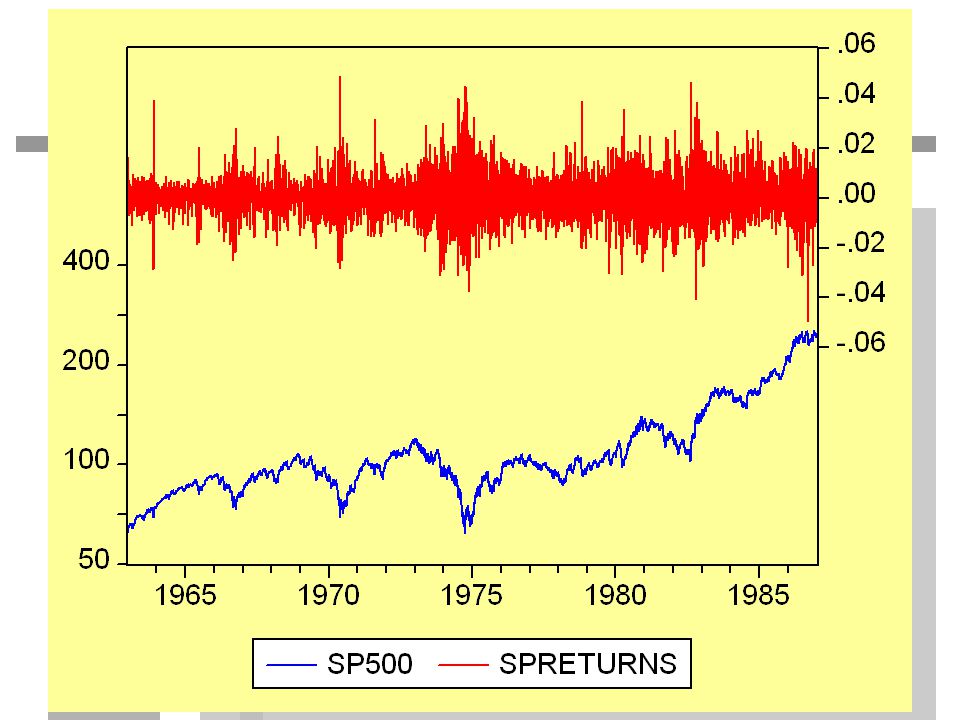
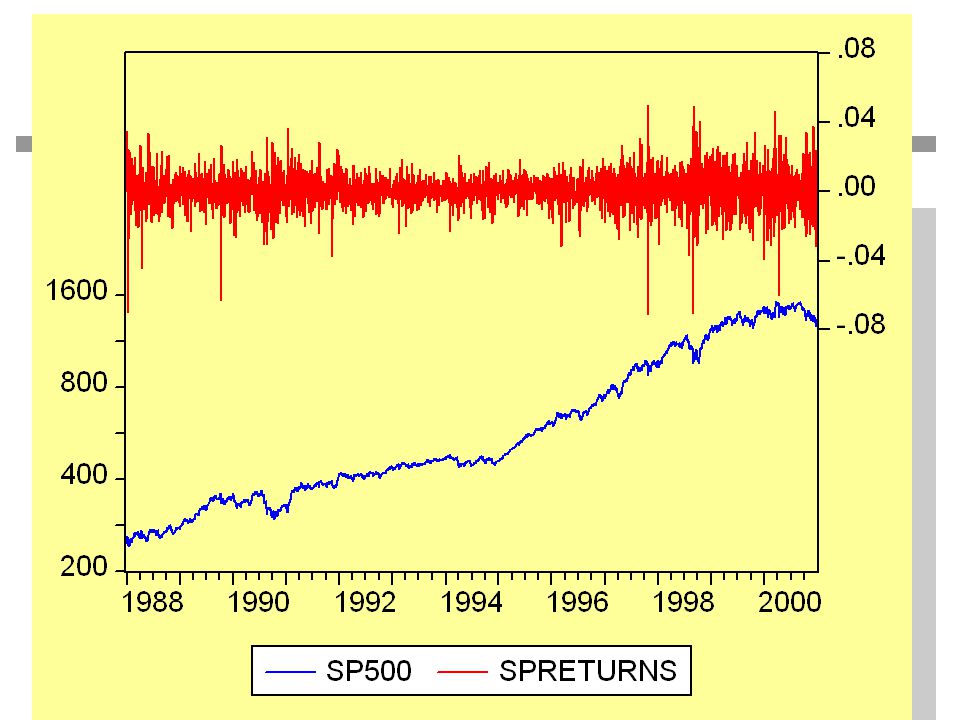
HISTORY OF THE US EQUITY MARKET VOLATILITY: S&P500 PLOT PRICES AND RETURNS HOW MUCH DO RETURNS FLUCTUATE?

7
MEAN REVERSION QUOTES “Volatility is Mean Reverting” –no controversy “The long run level of volatility is constant” –very controversial “Volatility is systematically higher now than it has been in years” –Very controversial. Cannot be answered by simple GARCH

8
DEFINITIONS r t is a mean zero random variable measuring the return on a financial asset CONDITIONAL VARIANCE UNCONDITIONAL VARIANCE

9
GARCH(1,1) The unconditional variance is then
 The unconditional variance is then ")
10
GARCH(1,1) If omega is slowly varying, then This is a complicated expression to interpret
 If omega is slowly varying, then This is a complicated expression to interpret")
11
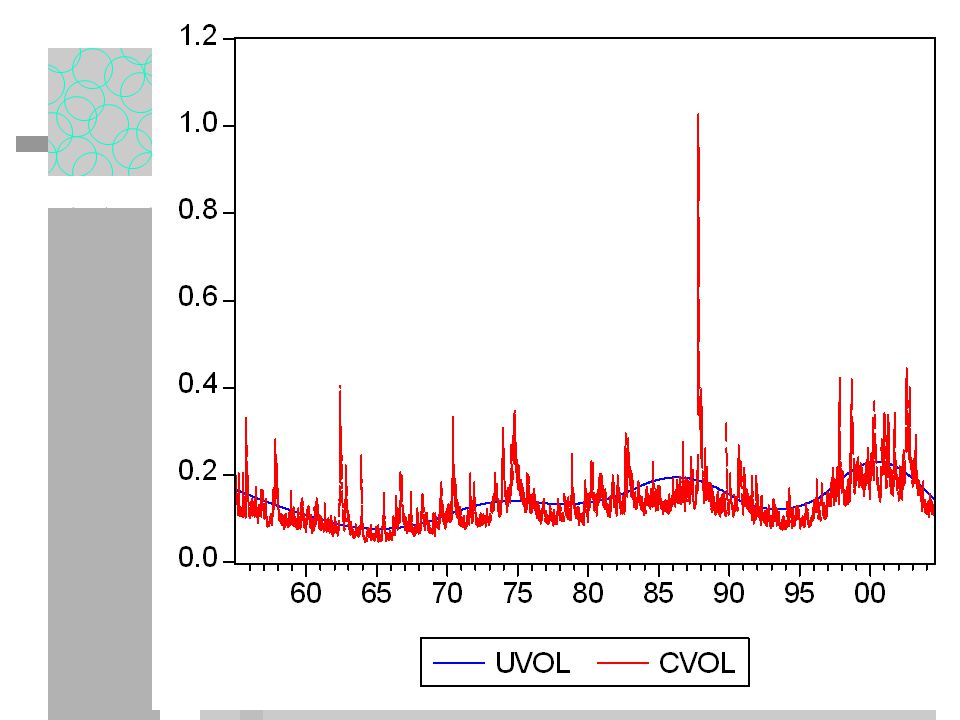
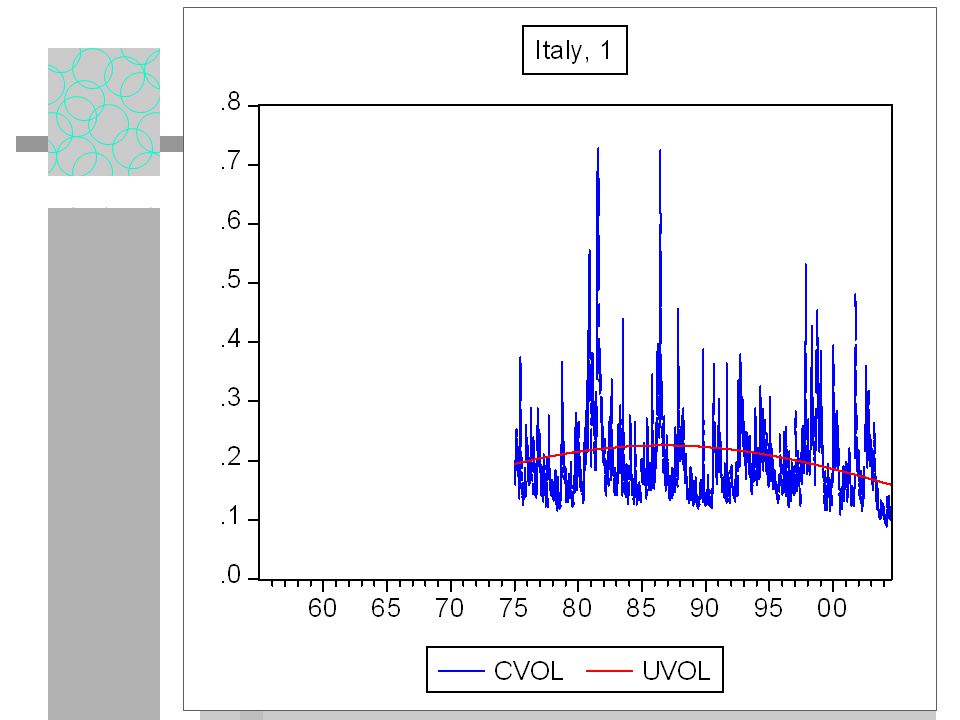
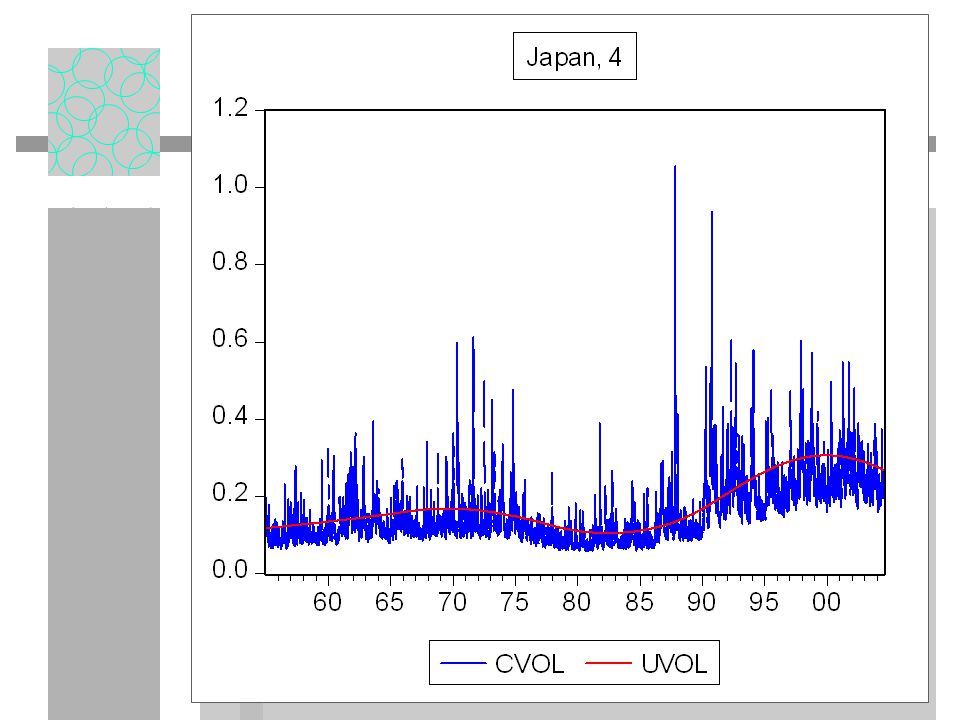
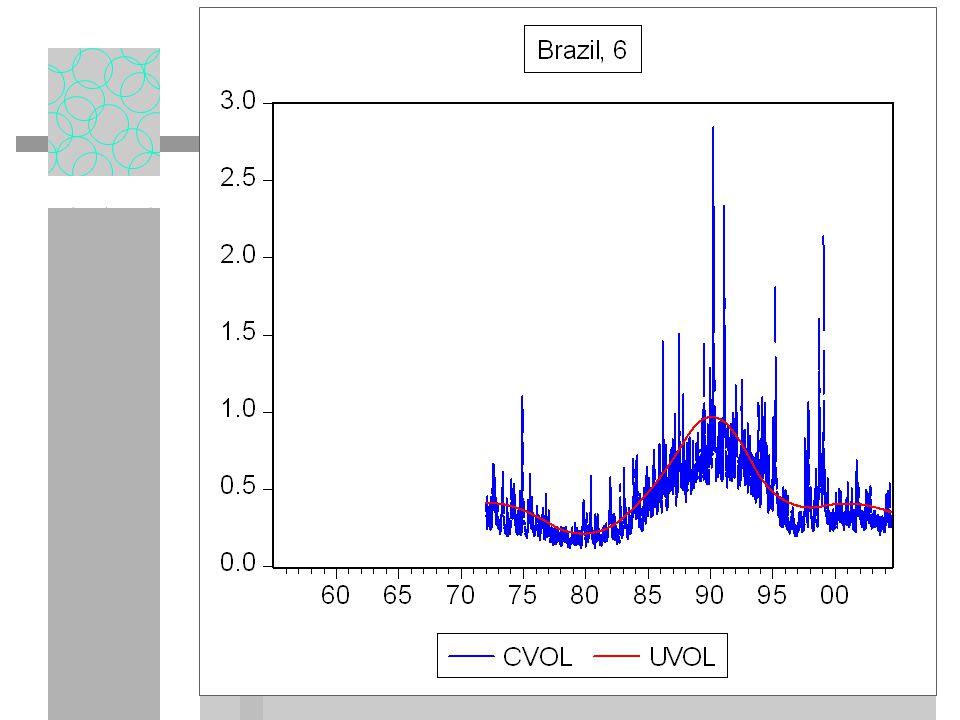
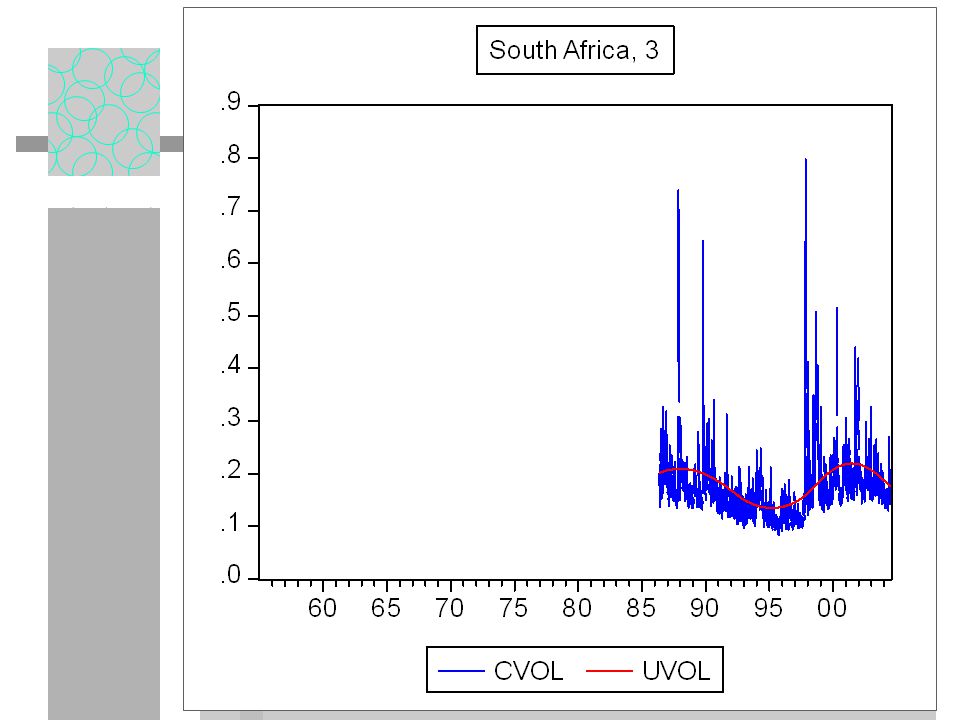
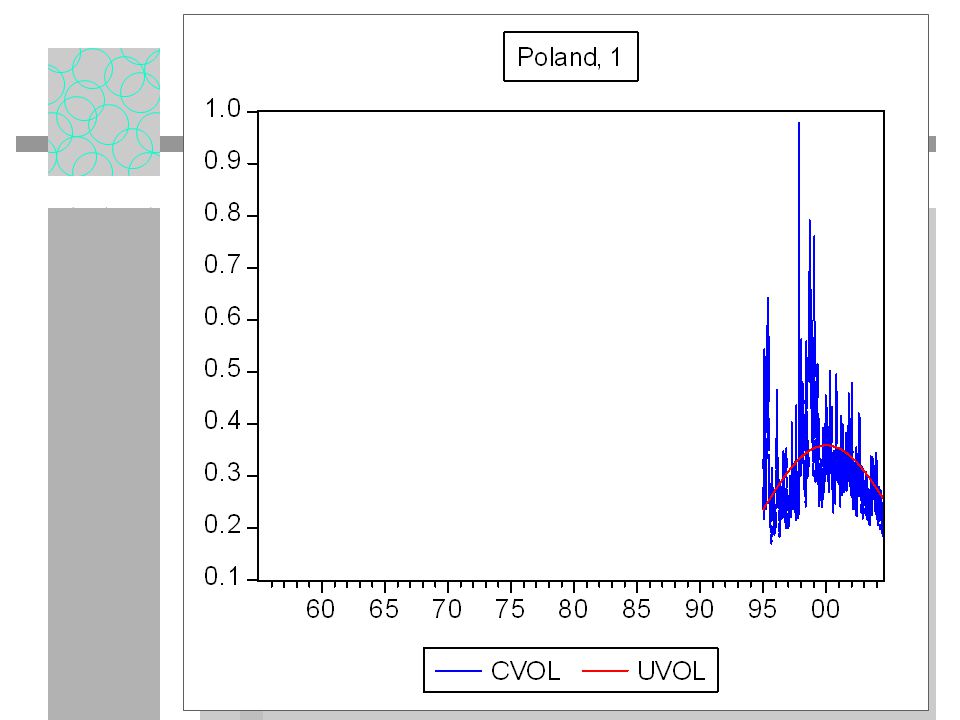
SPLINE GARCH Instead, use a multiplicative form Tau is a function of time and exogenous variables

12
UNCONDITIONAL VOLATILTIY Taking unconditional expectations Thus we can interpret tau as the unconditional variance.

13
SPLINE ASSUME UNCONDITIONAL VARIANCE IS AN EXPONENTIAL QUADRATIC SPLINE OF TIME

14
THIS IS EASY TO COMPUTE For K knots equally spaced, construct new regressors

15
ESTIMATION FOR A GIVEN K, USE GAUSSIAN MLE CHOOSE K TO MINIMIZE BIC FOR K LESS THAN OR EQUAL TO 15

16
EXAMPLES FOR US SP500 DAILY DATA FROM 1963 THROUGH 2004 ESTIMATE WITH 1 TO 15 KNOTS OPTIMAL NUMBER IS 7

17
RESULTS LogL: SPGARCH Method: Maximum Likelihood (Marquardt) Date: 08/04/04 Time: 16:32 Sample: 1 12455 Included observations: 12455 Evaluation order: By observation Convergence achieved after 19 iterations CoefficientStd. Errorz-StatisticProb. C(4)-0.0003197.52E-05-4.2466430.0000 W(1)-1.89E-082.59E-08-0.7294230.4657 W(2)2.71E-072.88E-089.4285620.0000 W(3)-4.35E-073.87E-08-11.247180.0000 W(4)3.28E-075.42E-086.0582210.0000 W(5)-3.98E-075.40E-08-7.3774870.0000 W(6)6.00E-075.85E-0810.263390.0000 W(7)-8.04E-079.93E-08-8.0922080.0000 C(5)1.1372770.04356326.106660.0000 C(1)0.0894870.00241837.008160.0000 C(2)0.8810050.004612191.02450.0000 Log likelihood-15733.51 Akaike info criterion2.528223 Avg. log likelihood-1.263228 Schwarz criterion2.534785 Number of Coefs.11 Hannan-Quinn criter.2.530420
 E W(1)-1.89E E W(2)2.71E E W(3)-4.35E E W(4)3.28E E W(5)-3.98E E W(6)6.00E E W(7)-8.04E E C(5) C(1) C(2) Log likelihood Akaike info criterion Avg. log likelihood Schwarz criterion Number of Coefs.11 Hannan-Quinn criter")
25
PATTERNS OF VOLATILITY ASSET CLASSES –EQUITIES –EQUITY INDICES –CURRENCIES –FUTURES –INTEREST RATES –BONDS

26
VOLATILITY BY ASSET CLASS

28
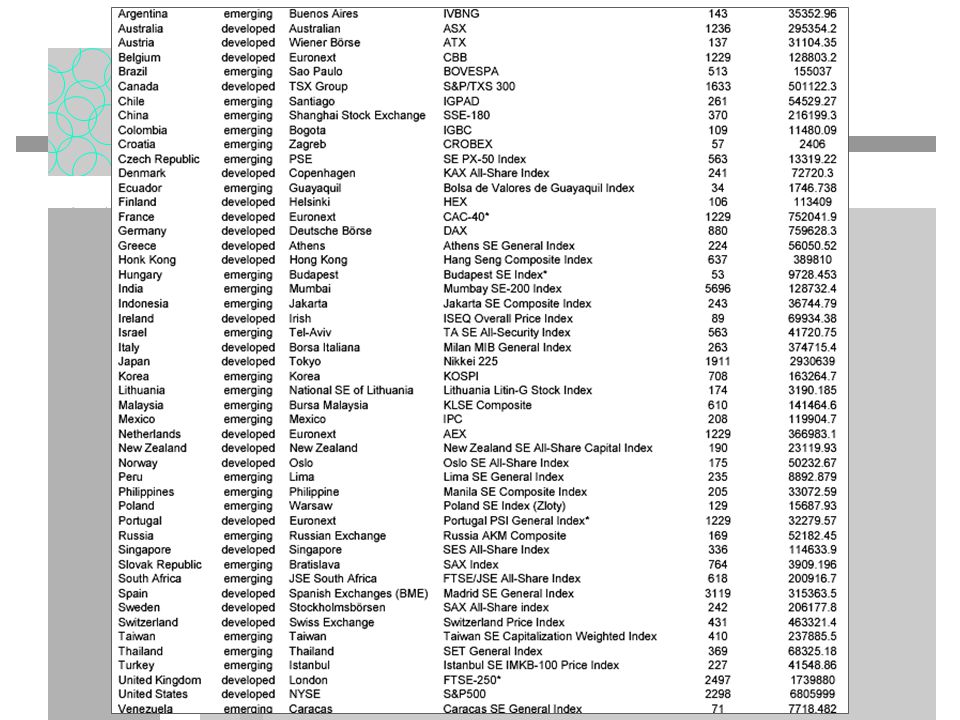
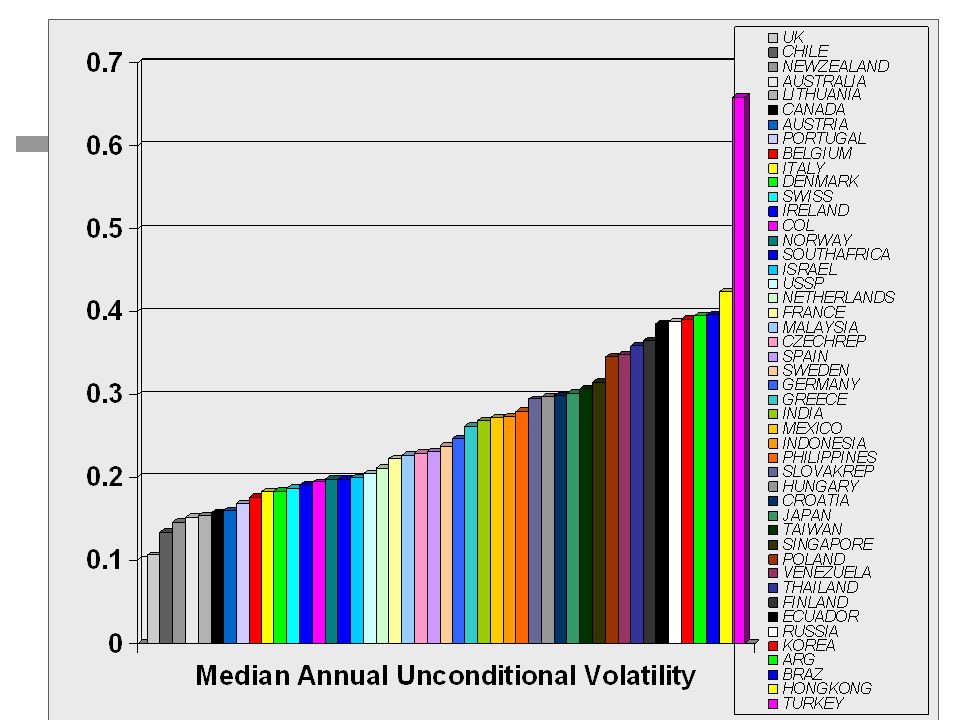
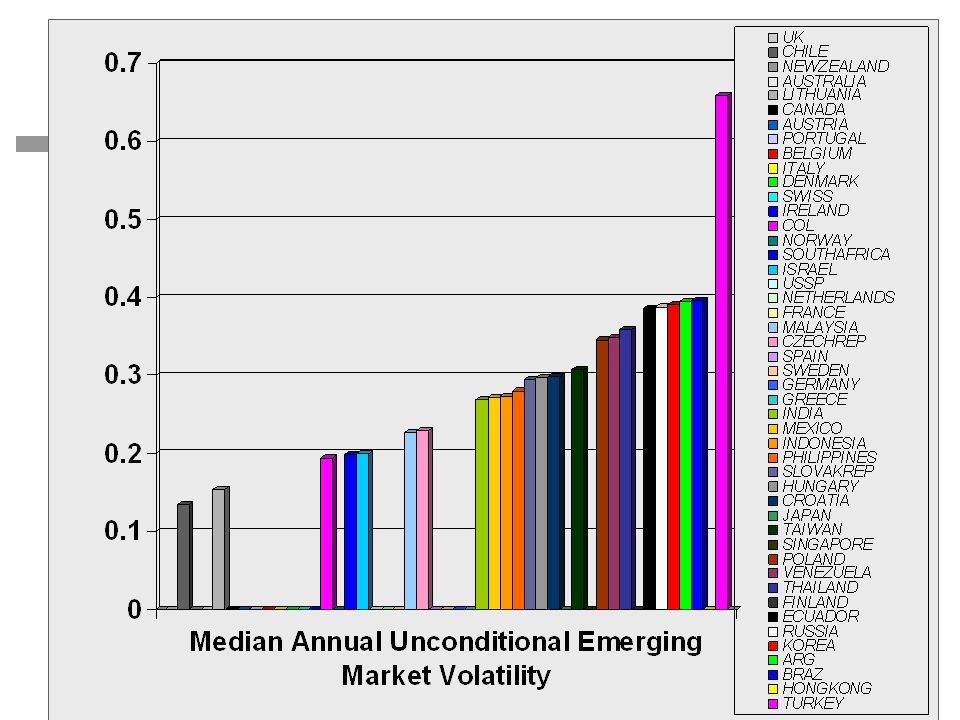
PATTERNS OF EQUITY VOLATILITY COUNTRIES –DEVELOPED MARKETS –EUROPE –TRANSITION ECONOMIES –LATIN AMERICA –ASIA –EMERGING MARKETS Calculate Median Annualized Unconditional Volatility 1997-2003 using daily data

32
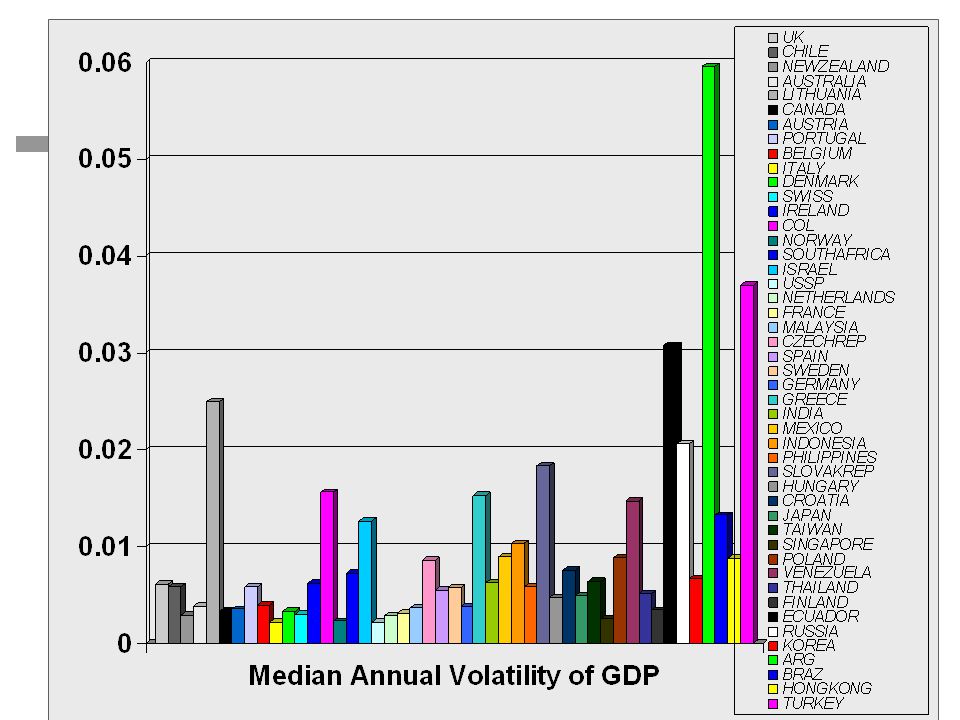
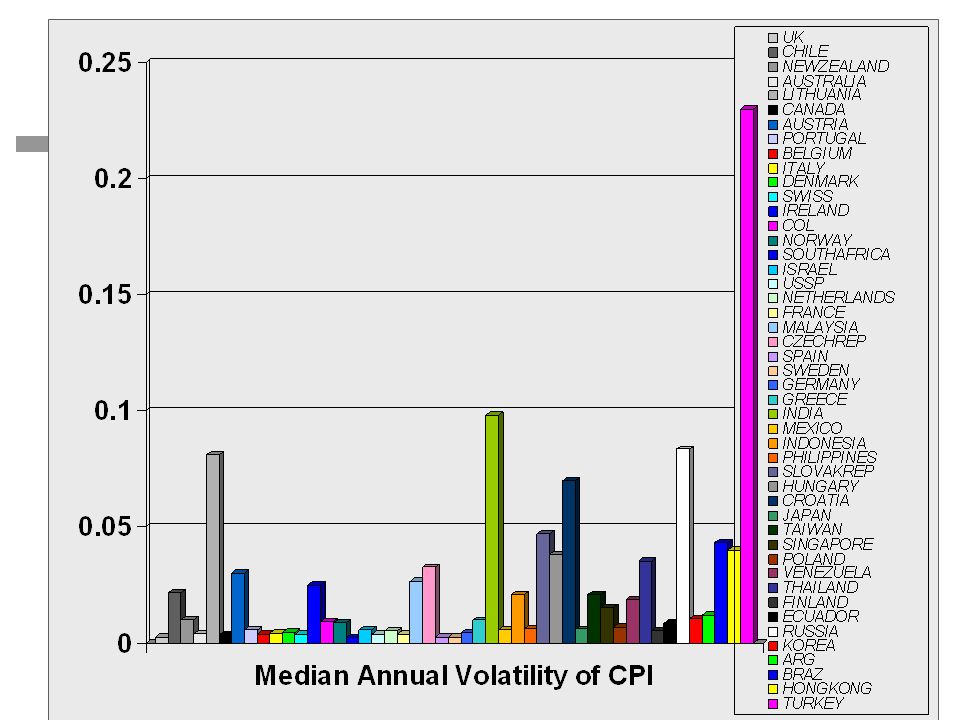
MACRO VOLATILITY Macro volatility variables measure the size of the surprises in macroeconomic aggregates over the year. If y is the variable (cpi, gdp,…), then:
, then:.")
36
EXPLANATORY VARIABLES

37
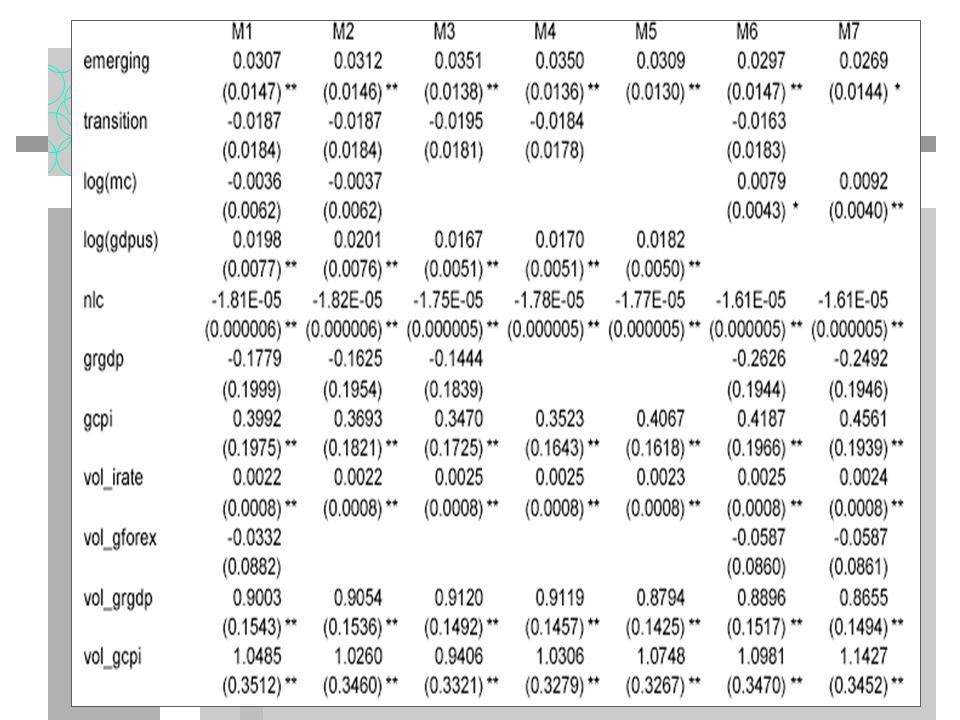
ESTIMATION Volatility is regressed against explanatory variables with observations for countries and years. Within a country residuals are auto-correlated due to spline smoothing. Hence use SUR. Volatility responds to global news so there is a time dummy for each year. Unbalanced panel

38
ONE VARIABLE REGRESSIONS

39
MULTIPLE REGRESSIONS

41
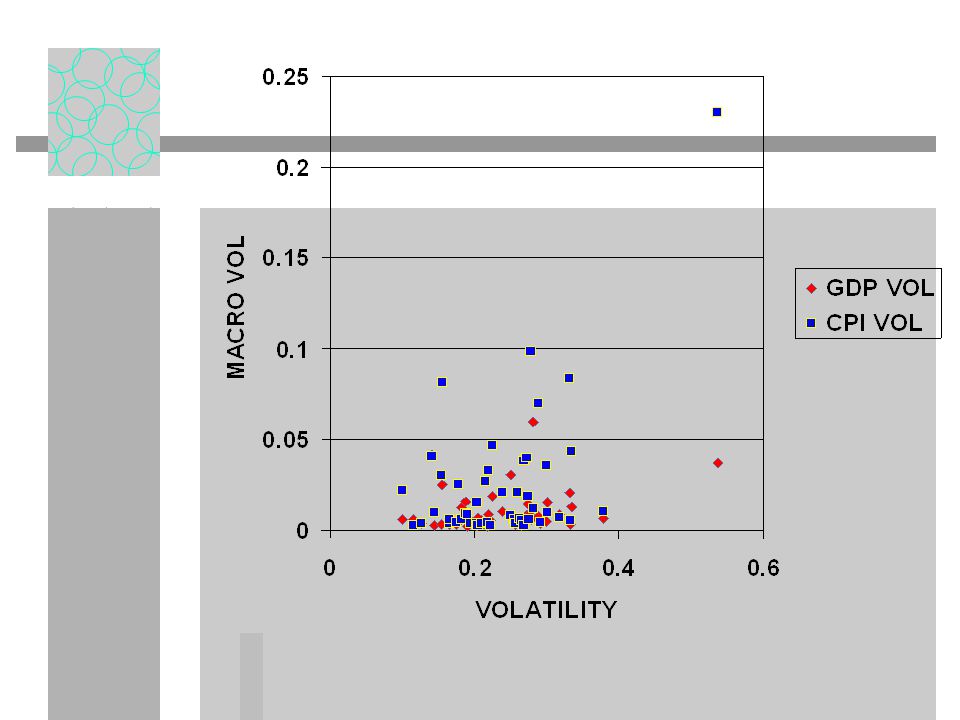
ANNUAL REALIZED VOLATILITY

42
CONCLUSIONS AND IMPLICATIONS Unconditional volatility changes in systematic ways. Macro volatility is an important determinant of financial volatility Potential justification for inflation targeting monetary policy as well as stabilization. Big swings in global financial volatility are associated with US volatility.

Similar presentations