Download presentation
Presentation is loading. Please wait.

1
Chapter 14 Financial Statement Analysis

2
Who and Why? To understand the economics of a firm and To help forecast its future profitability and risk Profitability is an increase in wealth Risk is the probability that a specific level of profitability will be achieved. Managers Responsible for day to day operations and and long-range performance Responsible and accountable for efficiency, effective deployment of capital, human resource and other resource management Owners Interested in current and long-term returns on their investments Expect growing earnings, dividends Affected by how earnings are distributed and how their shares are valued in the market Lenders and creditors Concerned about liquidity and cash flow of the company Interested in the degree of financial leverage employed Others: employees, government, society

3
Financial Statement Analysis Should start with an understanding of Global and local macro economic condition Industry (past performance, future expectations, competition etc…) Should involve time series analysis, Should compare performance with peers, competitors, industry averages
 Should involve time series analysis, Should compare performance with peers, competitors, industry averages")
4
Tools Analytical Analysis Vertical Analysis Horizontal Analysis Ratio Analysis

5
Analytical Analysis Vertical Analysis Express the items in the financial statements as a percentage of total assets or sales

6
Income Statement- Vertical Analysis

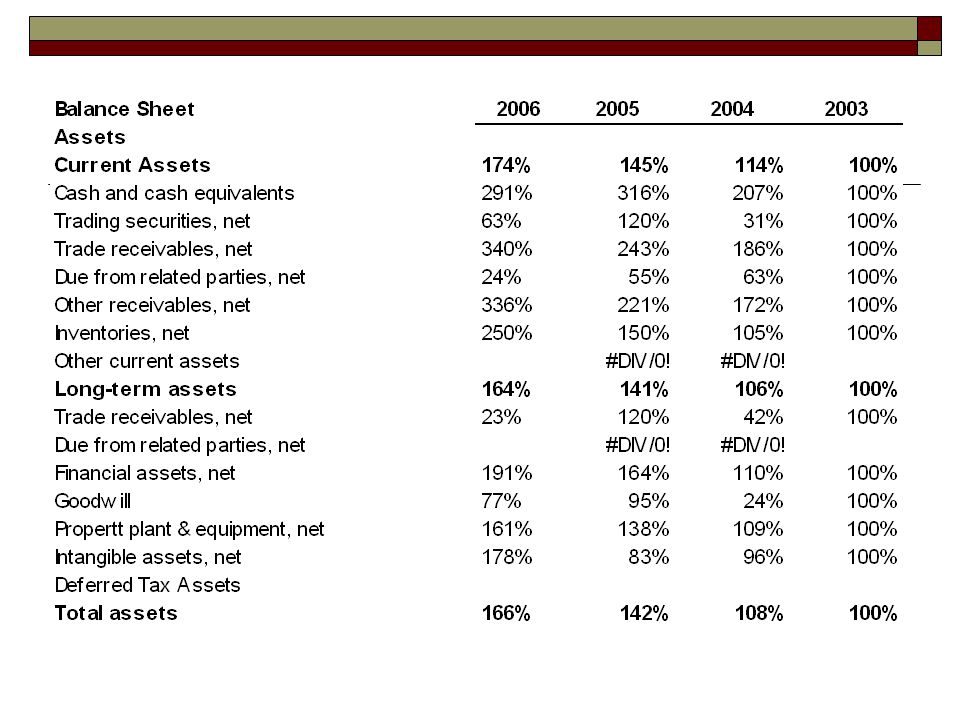
7
Balance Sheet Vertical Analysis

9
Trend Analysis

11
Ratio Analysis Important point: to be selective-too many ratios would lead to information overload Understand the meaning and limitations of the ratios Define the following elements before starting: The viewpoint taken The objectives of the analysis The potential standards of comparison Remember ratios are not absolute: they are relative performances over time, over a number of companies, over an industry, etc. Ratios might indicate changes in patterns and help to assess future risk of the company in question

12
Usefulness of Ratios Help compare different firms, and Help compare the firm against its past performance Standards against which to compare ratios 1. The planned ratio for the period 2. The corresponding ratio from a prior period 3. The corresponding ratio for another firm in the same industry 4. The average ratio for other firms in the same industry

13
Ratio Analysis Cross-sectional and time series analysis Controls for size differences Controls for currency differences Evaluate related components of different financial statements simultaneously Ratios are easily (and commonly) modified
 modified")
14
Ratio Analysis Categories Activity (operations and asset management) Liquidity (meeting short-term obligations) Solvency (meeting long-term obligations) Profitability (earnings and cost coverage) Cash Flow (quality of earnings) Price Multiples (stock price)
 Liquidity (meeting short-term obligations) Solvency (meeting long-term obligations) Profitability (earnings and cost coverage) Cash Flow (quality of earnings) Price Multiples (stock price)")
15
Activity Ratios Receivable turnover Average collection period

16
Activity Ratios Inventory turnover Average days in inventory

17
Activity Ratios Payable Turnover Average payment period

18
Activity Ratios Cash Cycle:

19
Activity Ratios PP&E Turnover Asset Turnover

20
Liquidity Ratios Current ratio Ability to meet short-term obligations [Current assets/current liabilities] Quick ratio Remove less liquid assets Keep cash, liquid investments, A/R [(Cash+short-term investments + A/R)/current liabilities]
![Liquidity Ratios Current ratio Ability to meet short-term obligations [Current assets/current liabilities] Quick ratio Remove less liquid assets Keep cash, liquid investments, A/R [(Cash+short-term investments + A/R)/current liabilities]](http://images.slideplayer.com/16/5155861/slides/slide_20.jpg "Liquidity Ratios Current ratio Ability to meet short-term obligations [Current assets/current liabilities] Quick ratio Remove less liquid assets Keep cash, liquid investments, A/R [(Cash+short-term investments + A/R)/current liabilities]")
21
Solvency Ratios Debt to assets: Total liabilities/Total assets Proportion of assets financed with debt Could include interest bearing debt only [(short term debt + noncurrent debt)/total assets] Be aware that assets are recorded at historical cost, which may be different from current market value
![Solvency Ratios Debt to assets: Total liabilities/Total assets Proportion of assets financed with debt Could include interest bearing debt only [(short term debt + noncurrent debt)/total assets] Be aware that assets are recorded at historical cost, which may be different from current market value](http://images.slideplayer.com/16/5155861/slides/slide_21.jpg "Solvency Ratios Debt to assets: Total liabilities/Total assets Proportion of assets financed with debt Could include interest bearing debt only [(short term debt + noncurrent debt)/total assets] Be aware that assets are recorded at historical cost, which may be different from current market value")
22
Solvency Ratios Debt to equity: Total liabilities/Total equity A measure of how assets are financed

23
Solvency Ratios Coverage Ratios Adequacy of resources for meeting firm’s contractual obligations Times interest earned Can the firm cover its interest obligations? (EBIT/Interest expense) Cash interest coverage (Cash from ops + interest paid + tax paid)/Interest paid
 Cash interest coverage (Cash from ops + interest paid + tax paid)/Interest paid.")
24
Profitability Ratios Gross Margin: profitability of sales Return on Sales: Net profitability of the company

25
Profitability Ratios Retun on Assets Return on Equity

26
Cash Flow Ratios Quality of earnings Ability to pay obligations CFO/Total liabilities CFO = Cash flows from operations Profitability (cash flow relative to sales) CFO/Sales revenue Cash flow-earnings index CFO/Net income
 CFO/Sales revenue Cash flow-earnings index CFO/Net income")
27
Price Multiple Ratios Market’s valuation of a firm’s common stock P/E = Share price/Earnings per share Price/book ratio compares stock’s price to the recorded value of the net assets [Share price/(Book value of equity/Share outstanding)]
![Price Multiple Ratios Market’s valuation of a firm’s common stock P/E = Share price/Earnings per share Price/book ratio compares stock’s price to the recorded value of the net assets [Share price/(Book value of equity/Share outstanding)]](http://images.slideplayer.com/16/5155861/slides/slide_27.jpg "Price Multiple Ratios Market’s valuation of a firm’s common stock P/E = Share price/Earnings per share Price/book ratio compares stock’s price to the recorded value of the net assets [Share price/(Book value of equity/Share outstanding)]")
28
Limitation of Ratio Analysis Represent the average conditions and influenced by the accounting methods used Based on historical data and do not reflect price level effects and real economic values Changes in many ratios are strongly associated with each other and interrelationships among/between the ratios should be examined During comparison of ratios over a period of time changes in operating conditions should be taken into consideration During comparison between companies differences among the companies should be examined Use audited financial statements to perform ratio analysis

Similar presentations


 2004 Prentice Hall, Inc. The Analysis of Financial Statements This chapter will develop tools and.>")


