Download presentation
Presentation is loading. Please wait.

1
National Center for Health Statistics DCC CENTERS FOR DISEASE CONTROL AND PREVENTION Using Health and Family Data from the National Center for Health Statistics to Study Health Disparities Anjani Chandra, Ph.D.

2
Agenda NCHS mission Overview of major NCHS data systems NHANES NHIS NHCS NVSS Closer look at data sets related to reproductive and perinatal health

3
NCHS Mission To monitor the nation’s health by providing data that are: accurate relevant timely To support the broader CDC mission: SAFER … HEALTHIER … PEOPLE

4
NCHS Data Are Used For Comparisons across populations, providers, and geographic areas Planning/assessing public health programs Identifying health problems, risk factors, and disease patterns Comparisons across populations, providers, and geographic areas Planning/assessing public health programs Identifying health problems, risk factors, and disease patterns

5
Quality Control at Every Stage Data collection Instrument design Interviewer (or data collector) training Data analysis Evaluation of data quality Information dissemination
 training Data analysis Evaluation of data quality Information dissemination")
6
Four Major Data Systems at NCHS National Health and Nutrition Examination Survey National Health Interview Survey National Health Care Survey National Vital Statistics System and surveys

7
NHANES Data sources Personal interviews (including ACASI) Physical examinations Laboratory tests Nutritional assessments Data sources Personal interviews (including ACASI) Physical examinations Laboratory tests Nutritional assessments
 Physical examinations Laboratory tests Nutritional assessments Data sources Personal interviews (including ACASI) Physical examinations Laboratory tests Nutritional assessments")
8
NHANES sample design 30,000 persons aged 2 months or older Oversample African Americans Mexican Americans Adolescents aged 12-19 Older persons aged 60+ Pregnant women OP96031

9
Mobile Examination Center (MEC) Trailer used for NHANES
 Trailer used for NHANES")
10
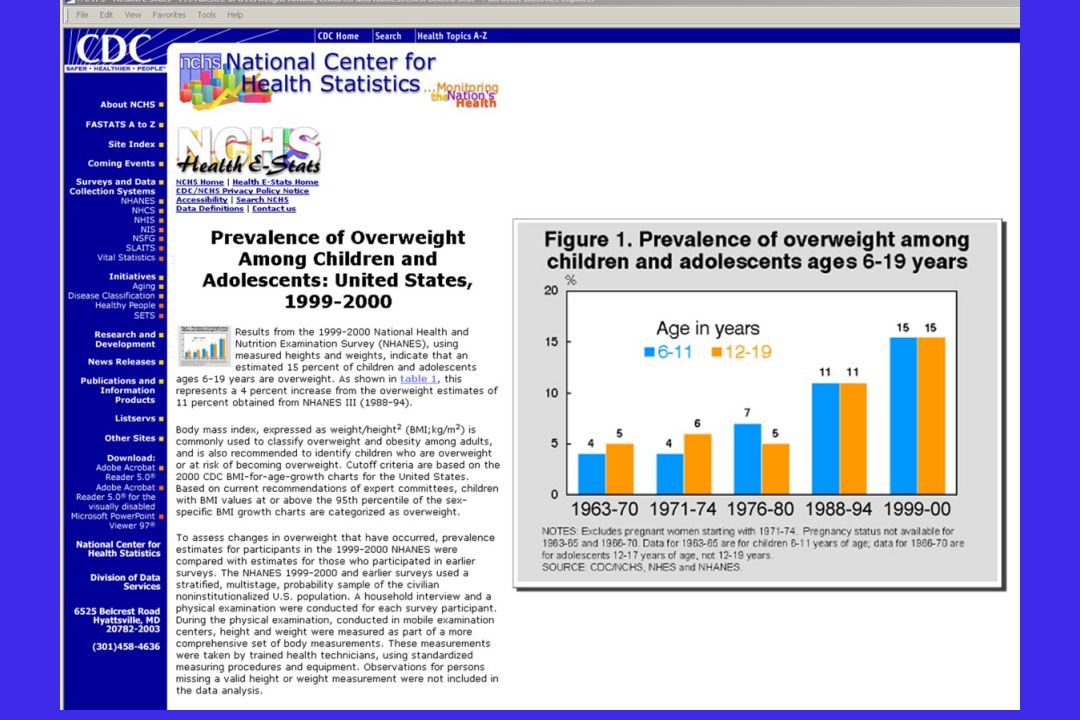
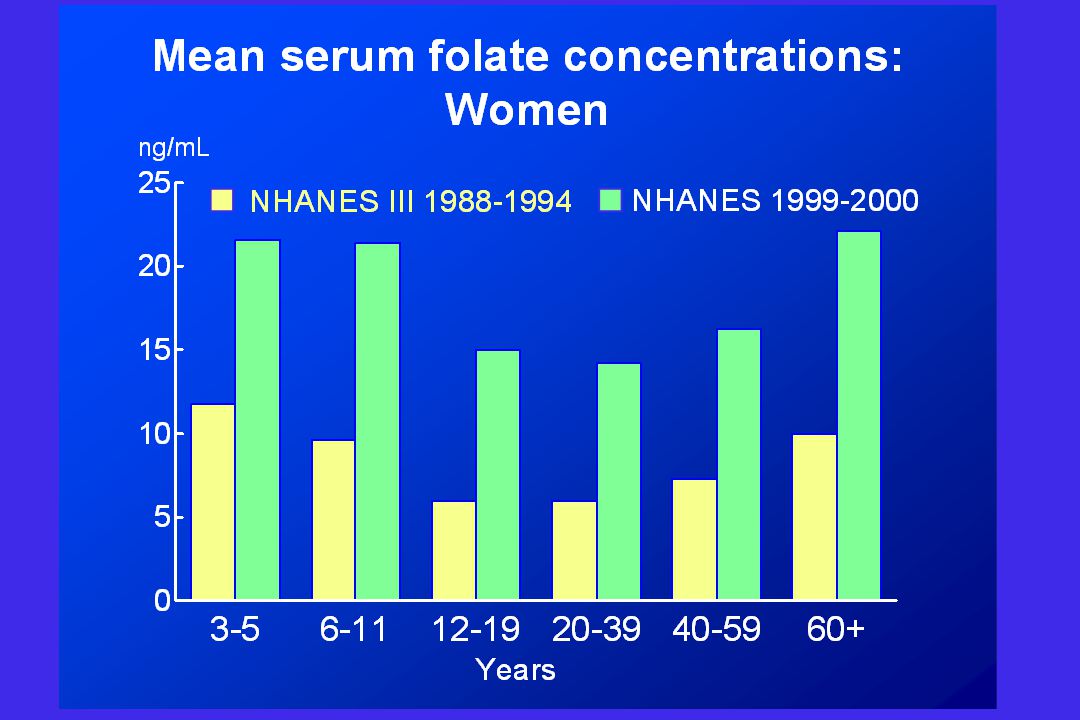
Estimate the prevalence and distribution of health conditions and related risk factors in the population Describe awareness, treatment and control of selected diseases Monitor trends in health, risk behaviors, and environmental exposures over time Some Uses of NHANES OP96023

11
Study the relationship of diet, nutrition and health Develop “growth charts” for evaluating child development Explore emerging public health issues Establish a national probability sample of genetic material for future research Some Uses of NHANES (cont’d) OP96024
 OP96024")
14
National Health Interview Survey (NHIS) Data source Personal interviews with household members Sample 41,000 households annually (approximately 110,000 people) Oversample African Americans and Hispanics
 Data source Personal interviews with household members Sample 41,000 households annually (approximately 110,000 people) Oversample African Americans and Hispanics")
15
NHIS Components Core questionnaire Topical modules Periodic modules Core questionnaire Topical modules Periodic modules

16
NHIS Core Questionnaire Collects minimal information on Health behaviors Chronic and acute conditions Health care utilization Health status and limitations Collects minimal information on Health behaviors Chronic and acute conditions Health care utilization Health status and limitations

17
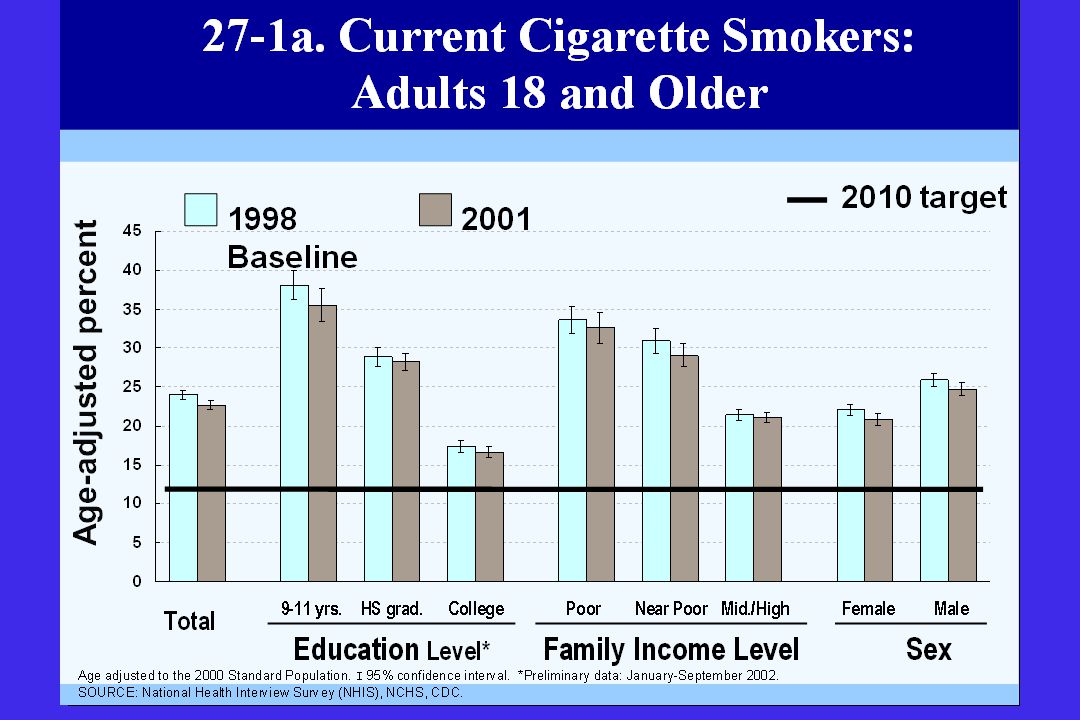
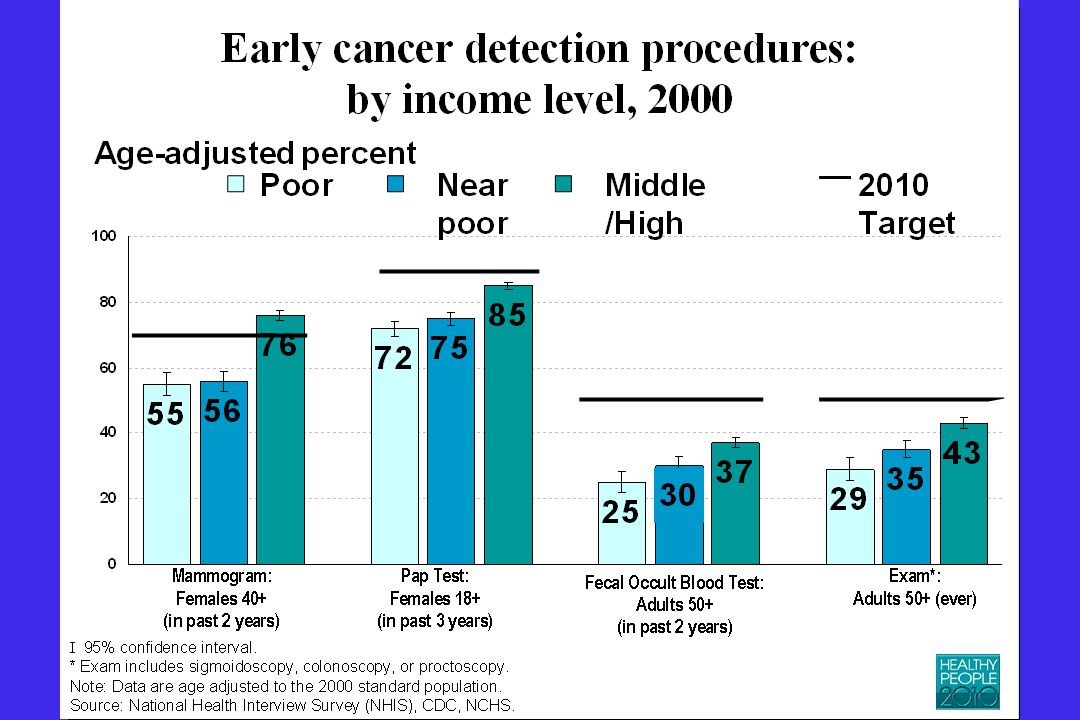
Topical modules collect data on: Emerging problems or specific health problems Cancer Healthy People 2000 and 2010 indicators Diabetes Periodic modules collect more detailed information on one of the four areas of health above. NHIS Modules

18
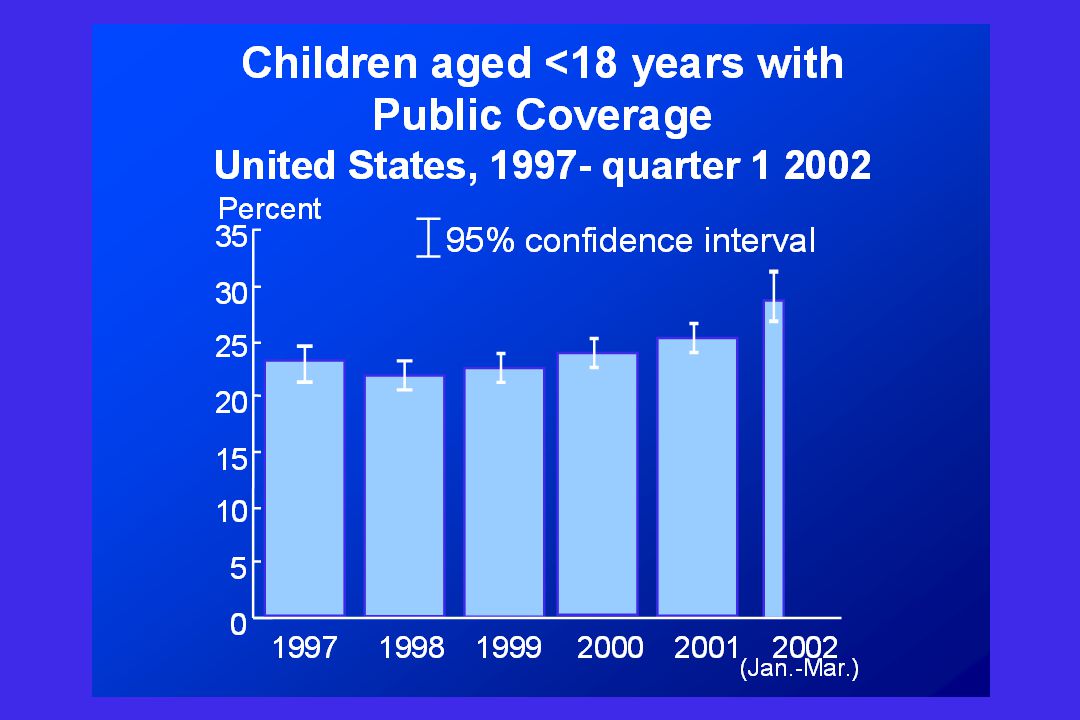
Health status and disability Insurance coverage Access to care Use of health services Immunization Health behaviors Family practices Health status and disability Insurance coverage Access to care Use of health services Immunization Health behaviors Family practices NHIS Module Topics Have Included

22
National Hospital Discharge Survey National Ambulatory Medical Care Survey National Nursing Home Survey National Health Provider Inventory National Hospital Discharge Survey National Ambulatory Medical Care Survey National Nursing Home Survey National Health Provider Inventory The National Health Care Survey (Original Surveys)
")
23
National Hospital Ambulatory Medical Care Survey National Survey of Ambulatory Surgery National Home and Hospice Care Survey National Hospital Ambulatory Medical Care Survey National Survey of Ambulatory Surgery National Home and Hospice Care Survey The National Health Care Survey (Newer Surveys)
")
24
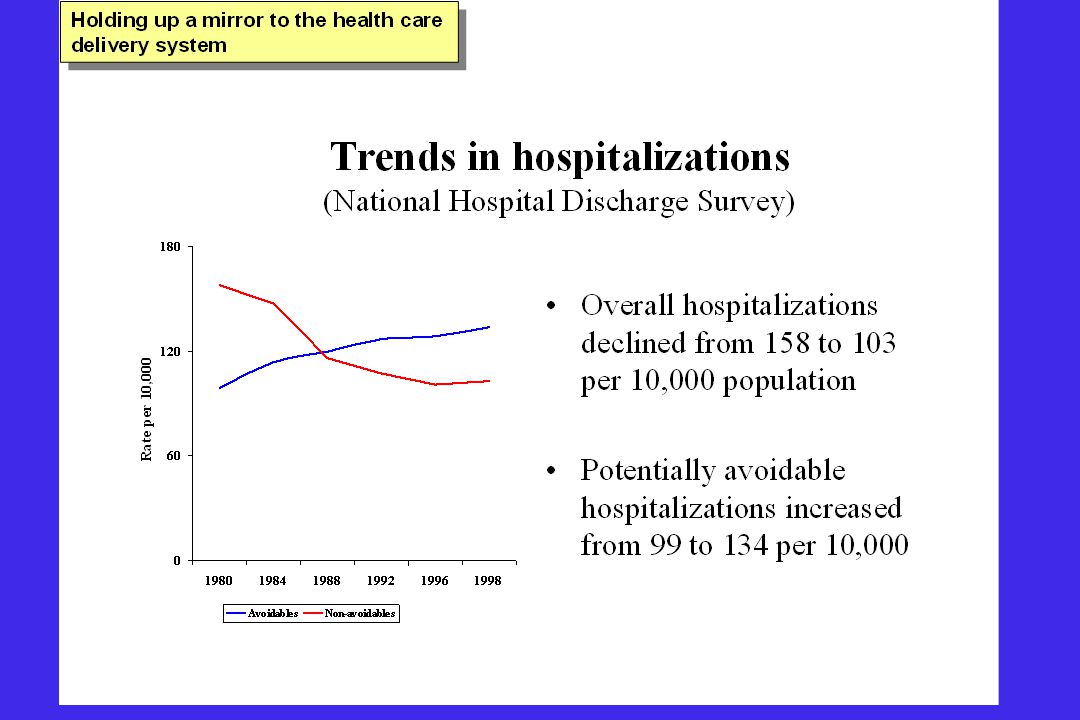
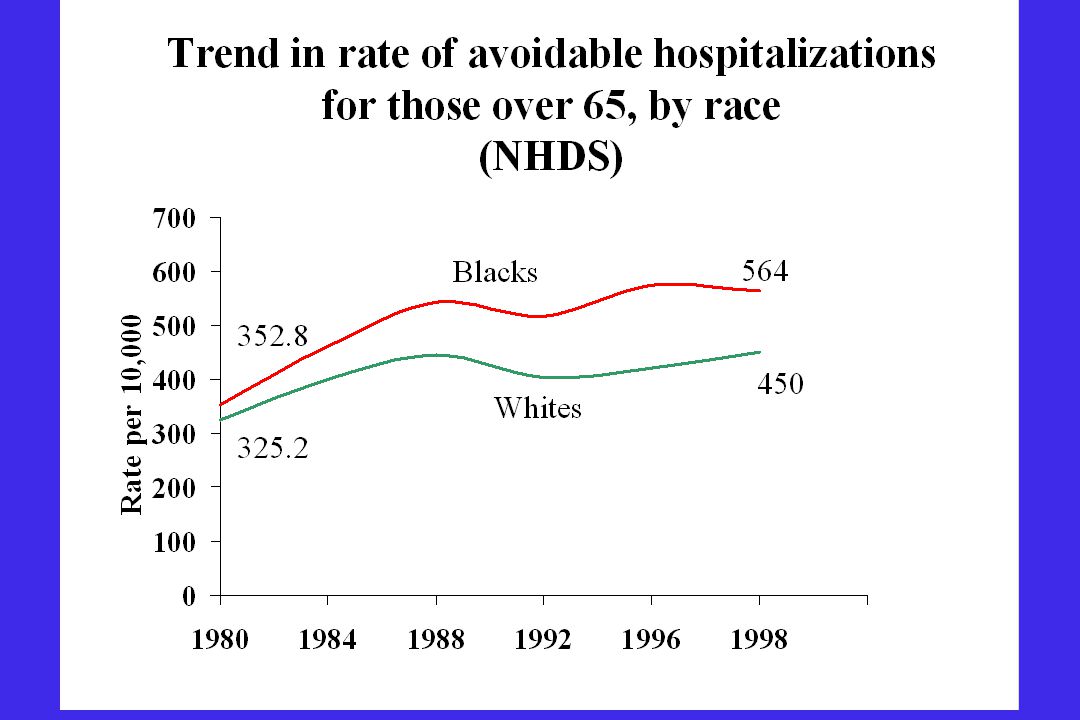
Prevalence of diagnosis and treatment Trends in use of services Characteristics of patients and providers Patterns of disease Use of technology drugs, and other treatments Emergence of alternative care sites Prevalence of diagnosis and treatment Trends in use of services Characteristics of patients and providers Patterns of disease Use of technology drugs, and other treatments Emergence of alternative care sites Some Uses of NHCS Data

27
Other NCHS Surveys National Immunization Survey State and Local Area Integrated Telephone Survey (SLAITS) National Longitudinal Survey of Aging (LSOA) National Immunization Survey State and Local Area Integrated Telephone Survey (SLAITS) National Longitudinal Survey of Aging (LSOA)
 National Longitudinal Survey of Aging (LSOA) National Immunization Survey State and Local Area Integrated Telephone Survey (SLAITS) National Longitudinal Survey of Aging (LSOA)")
28
National Vital Statistics System Data source State vital registration Sample All births, deaths, and fetal deaths Counts of marriages and divorces

29
Hispanic and API Subgroups (since 1990s) Hispanic origin Mexican, Puerto Rican, Cuban, Central or South American, other/unknown Hispanic group Asian American or Pacific Islander Chinese, Japanese, Hawaiian, Filipino, Asian Indian, Korean, Vietnamese, Samoan, Guamanian, Other Asian or Pacific Islander 1 1 Categories in green are available only for selected States
 Hispanic origin Mexican, Puerto Rican, Cuban, Central or South American, other/unknown Hispanic group Asian American or Pacific Islander Chinese, Japanese, Hawaiian, Filipino, Asian Indian, Korean, Vietnamese, Samoan, Guamanian, Other Asian or Pacific Islander 1 1 Categories in green are available only for selected States")
30
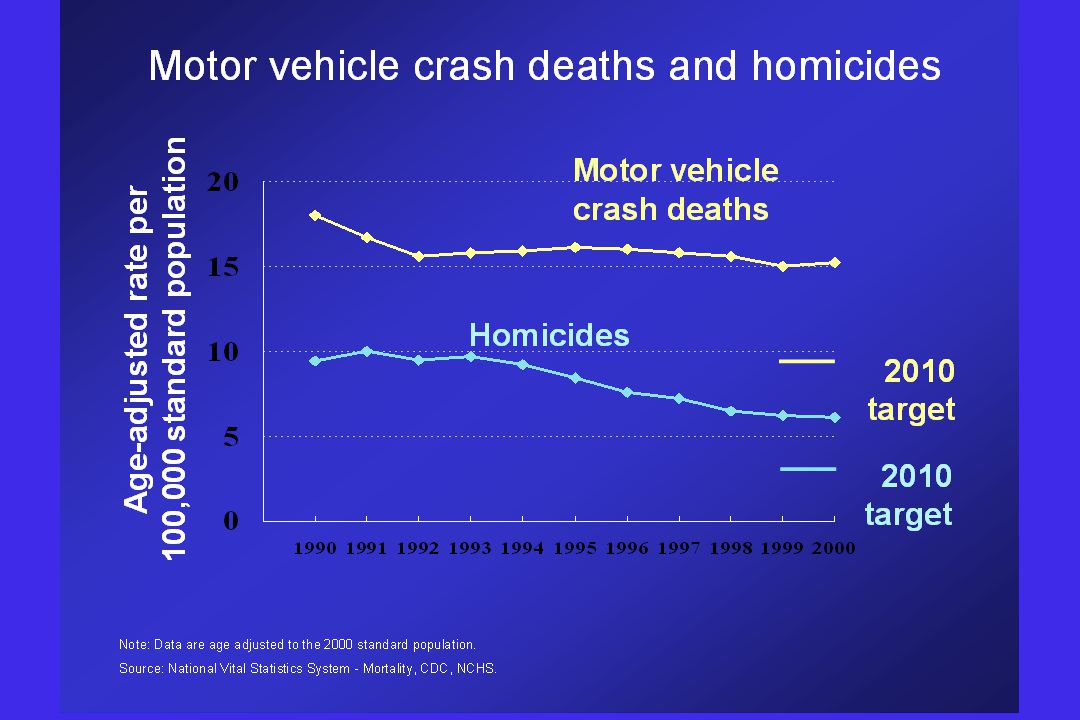
Some Uses of Mortality Data Life expectancy Fetal and Infant mortality Occupational mortality Causes of death National Death Index (for mortality ascertainment)
")
31
Life Expectancy at Birth, by Race and Year Source: National Vital Statistics System - Mortality, CDC, NCHS. Source: Arias E (2002). United States Life Tables, 2000. Nat’l Vital Statistics Reports 51(3). Hyattsville, MD: NCHS.
. United States Life Tables, Nat’l Vital Statistics Reports 51(3). Hyattsville, MD: NCHS..")
33
Revised Death Certificate Multiple race Education Marital status Place of death Pregnancy status If transportation injury, decedent’s role with respect to vehicles Tobacco use

34
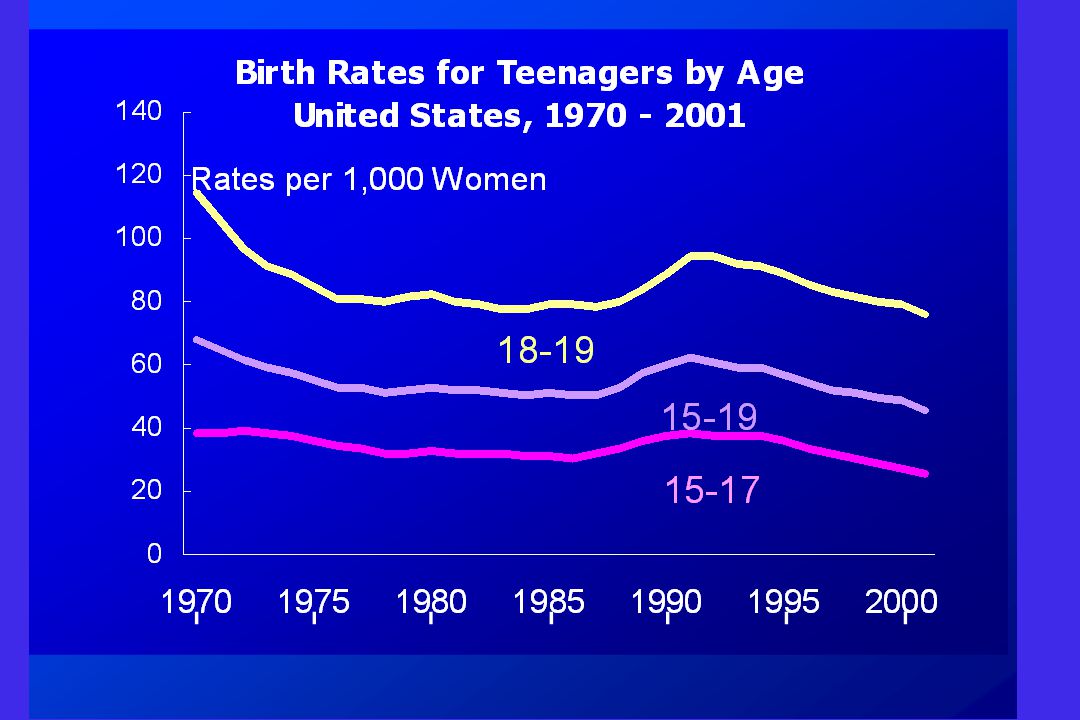
Some Uses of Natality Data Birth rates Nonmarital births Births to teens Prenatal care and birthweight Cesarean delivery Obstetric complications Timing of births (incl. delayed childbearing) Pregnancy rates (along w/other data)
 Pregnancy rates (along w/other data).")
36
Pregnancy, Live Birth, Induced Abortion & Fetal Loss Rates, 1990 & 1995 Rate per 1,000 Women 1990 1995 Source: Ventura et al, 2000

37
Revised Birth Certificate More detail on cigarette smoking Method of delivery More height & weight info Congenital anomalies Infertility treatment WIC Infections during preg Maternal morbidity Breast feeding Payment for delivery Separate worksheets for mother & for facility, to encourage collection from best data sources.

38
Certificate Revision Website (birth & death) For everything you always wanted to know about the revision but were afraid to ask… www.cdc.gov/nchs/vital_certs_rev.htm
 For everything you always wanted to know about the revision but were afraid to ask…")
39
Other Datasets for Perinatal Health Research In addition to the annual National Natality Datasets: Linked Birth/Infant Death Files Matched Multiple Birth File (through RDC) Fetal Death Files
 Fetal Death Files")
40
National Survey of Family Growth

41
Uses of NSFG data Collect periodic data on the “intermediate variables” “Snapshot” of U.S. fertility, family formation, and reproductive health Complement vital statistics Track national health objectives Evaluate health & social policies Research: demographic and public health

42
Social factors Intercourse variables: Intermediate variables Timing of first intercourse Percent of women who ever had intercourse Time spent in marriage (separation, divorce) Frequency of intercourse Fertility (live births) Race/ethnicity Religion Labor force participation Education Income Access to health care Family background Community environment (economic, social, etc.) Pregnancy outcome (gestation) variables: Miscarriage and stillbirth Induced abortion Conception variables: Contraceptive use Sterilization Infertility
 Frequency of intercourse Fertility (live births) Race/ethnicity Religion Labor force participation Education Income Access to health care Family background Community environment (economic, social, etc.) Pregnancy outcome (gestation) variables: Miscarriage and stillbirth Induced abortion Conception variables: Contraceptive use Sterilization Infertility")
43
NSFG sample (Cycles 1-5) Nationally representative sample of women Civilian non-institutionalized population of women 15-44 Multi-stage probability sample Oversample black women and starting in 1995, Hispanic women 1988 & 1995 – based on NHIS sample
 Nationally representative sample of women Civilian non-institutionalized population of women Multi-stage probability sample Oversample black women and starting in 1995, Hispanic women 1988 & 1995 – based on NHIS sample")
44
NSFG Cycles 1-5 119739,797Ever-married 219768,611 Ever-married 319827,969All 419888,450All 4 (Tel)19905,686Reintv of ‘88 & new teens 5199510,847All CycleYearNWomen 15-44
19905,686Reintv of ‘88 & new teens ,847All CycleYearNWomen 15-44")
45
Innovations in 1995 NSFG, Cycle 5 Major changes in questionnaire content and format Changed mode of data collection to CAPI and Audio CASI $20 token of appreciation paid to respondents -- maintain response rates with longer, more sensitive interview

46
Selected Findings from the 1995 NSFG

47
Children Ever Born, by Woman’s Education, 1995 Source: Abma et al, 1997, Table 4

48
Percent of Women 18-29 Who Had a Birth Before 18 Source: 1995 National Survey of Family Growth, Contextual Data Files Median Family Income at Block Level Percent

49
Father Figure During Adolescence: U.S. women 15-44 in 1995 Source: Peterson, poster presented at PAA 1998 Percent Type of Father Figure:

50
Percent Likelihood that 1 st Marriage Dissolves Within Ten Years Percent Source: Bramlett & Mosher, 2002 Age at marriage

51
Type of Contraceptive Used Among Women 15-44 Who Currently Use Contraception: U.S., 1995 Method: Source: Piccinino & Mosher, 1998

52
One-Year Failure Rates by Method: US, 1995 (Chance of Having an Unintended Pregnancy in 1 Year of Using the Method)
")
53
Current contraceptors 20-44 who are using female sterilization Source: Mosher et al., 2003, Table 9

54
Percent of Babies Born 1990-94 who were Breast-fed at all Source: Mosher et al., 2003, Table 15

55
Payment for Delivery for Women’s Most Recent Birth, 1991-5 Mother’s Age at Delivery Source: Abma et al, 1997, Table 69

56
Percent of Recent Births that were Intended at Conception Age at birth Source: Abma et al., 1997, Table 14

57
Use of Family Planning or Medical Services in Past Year Among Women 15-44: U.S., 1995 Percent Source: Abma et al, 1997, Table 74

58
Percent of Women 15-44 Ever Treated for PID Source: Abma et al, 1997, Table 89 Age at first sex Percent

59
Source: 1995 National Survey of Family Growth Percent Percent Uninsured Among Women 15-44

60
Percent of Unmarried Women Reporting 4 or More Male Sexual Partners in Past Year, Interviewer versus Self-administered mode Source: Abma et al, 1997, Table 27 Percent

61
Using the 1995 NSFG Several data files available Common CASEID allows linkage of information across files Access procedures vary due to confidentiality and sensitivity of data

62
1995 NSFG data files available Public Use Files Respondent file Pregnancy (interval) file Omitted Items File Fieldwork File Contextual Data Files
 file Omitted Items File Fieldwork File Contextual Data Files")
63
NSFG - variance estimation Complex sample design must be accounted for to make accurate inferences Requirements for accurate estimation in 1995 NSFG Fully adjusted weight (POST_WT) Collapsed strata variable (COL_STR) Panel identifier (PANEL) For reference and further details: Series 2, #124
 Collapsed strata variable (COL_STR) Panel identifier (PANEL) For reference and further details: Series 2, #124")
64
NSFG Public Use Data Files Available on cartridge tape and CD-ROM (1982 NSFG CDROM coming soon) 1995: extensive documentation (also on web) User’s Guide Codebook CAPI Reference Questionnaire
 1995: extensive documentation (also on web) User’s Guide Codebook CAPI Reference Questionnaire")
65
1995 NSFG - Contextual data files Restricted use (contact NCHS RDC) Community characteristics (over 1000) 4 levels of aggregation (state, county, census tract, block group) 3 points in time (1990, 1993, 1995) Rich potential for descriptive as well as detailed multilevel analyses.
 Community characteristics (over 1000) 4 levels of aggregation (state, county, census tract, block group) 3 points in time (1990, 1993, 1995) Rich potential for descriptive as well as detailed multilevel analyses.")
66
NSFG related files available through NCHS Research Data Center Contextual data files State level indicators (user-supplied) NHIS linked analyses (1988 & 1995) RDC Contact: Kenneth Harris Email:rdca@cdc.gov
 NHIS linked analyses (1988 & 1995) RDC Contact: Kenneth Harris")
67
Cycle 6 and beyond Shorter intervals between Cycles Cycle 6 in 2002 Cycle 7 planned for 2005 or 2006 Sample independent from NHIS Contextual data Inclusion of males 15-44 Moving toward continuous interviewing in Cycle 7

68
Inclusion of males 15-44 Other half of fertility and family formation equation 1996 Welfare Reform Act Fatherhood Initiative (federal interagency effort) Information collected directly
 Information collected directly")
69
Male NSFG will shed light on: Father involvement & activities Child support Male reporting of pregnancies/births sexual partnerships contraceptive behavior infertility Male role in unintended pregnancy STD/HIV risk & transmission

70
Female NSFG in Cycle 6 All core topics maintained from Cycle 5 Expanded Audio CASI Streamlined event histories Other selected enhancements based on questionnaire design research

71
2002 NSFG – Preliminary Counts FemaleMaleTotal Total7,6464,92912,575 15-191,1501,122 2,272 20-241,364 938 2,302 25-445,1322,869 8,001 Data collection ended in March 2003. Final counts will be slightly lower, post-data editing & cleaning.

72
2002 NSFG (Cycle 6) Public use data files & documentation target = Summer 2004 Web-based documentation CDROM for data files Contextual data about a year later Watch our webpage for updates: www.cdc.gov/nchs/nsfg.htm
 Public use data files & documentation target = Summer 2004 Web-based documentation CDROM for data files Contextual data about a year later Watch our webpage for updates:")
73
Quality Control Strategies in 2002 NSFG Full “dress rehearsal” Pretest in 2001 (n=600) Extensive input from research & policy world Cognitive testing of questionnaire components with key subpopulations Rigorous protocol for Spanish translation Interviewer training modules on cultural sensitivity and refusal aversion Verification interviews
 Extensive input from research & policy world Cognitive testing of questionnaire components with key subpopulations Rigorous protocol for Spanish translation Interviewer training modules on cultural sensitivity and refusal aversion Verification interviews")
74
Let’s take a step back and consider other concerns about surveys …

75
All surveys are facing challenges… People are harder to find and talk to People are more reluctant to participate Survey response rates suffer, or they cost more to maintain.

76
All surveys are facing challenges… Computerization of survey instruments can simplify interviewers’ job to some extent, but… Survey questionnaires tend to become more complex Innovative data collection strategies (including ACASI) require considerably higher cost in programming and testing Overall survey costs increase
 require considerably higher cost in programming and testing Overall survey costs increase")
77
All surveys are facing challenges… Controlling survey costs requires Collection and use of process data in directing effort of interviewers in the field Real time modeling to balance cost control with response rate and error reduction goals YOU, as data users, need to be aware of these survey management issues, as they may impact on your research.

78
Questions? Comments?

Similar presentations


 Betty C. Jung, RN, MPH, CHES.>")


 Betty C. Jung, RN, MPH, CHES.>")

 Chris Moriarity National Conference on Health Statistics August 16, 2010>")


