Download presentation
Presentation is loading. Please wait.

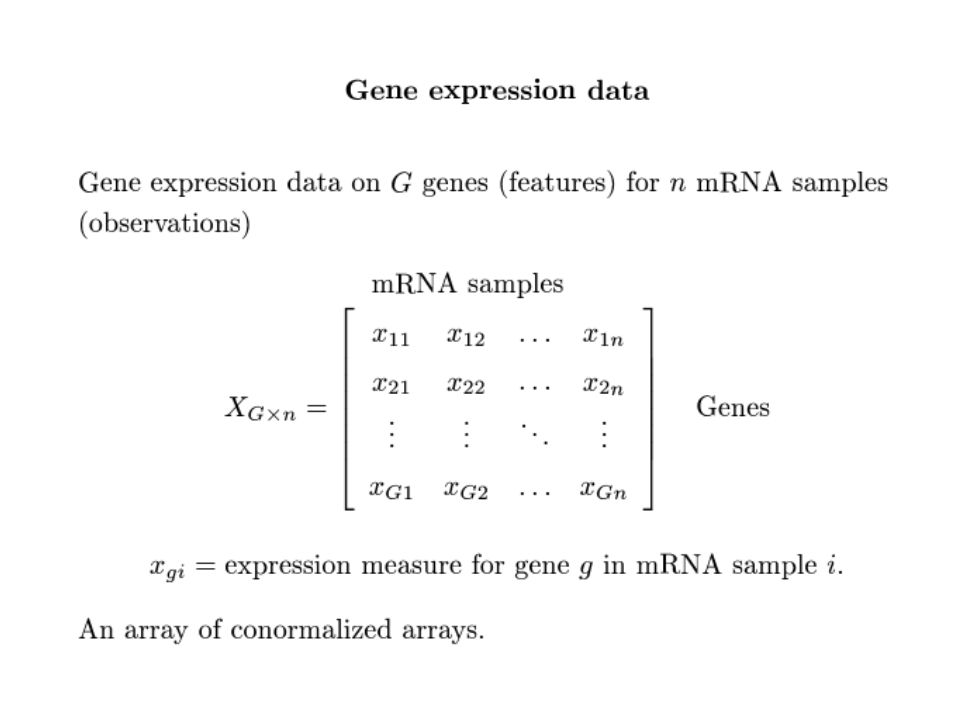
2
Microarray Technology Types Normalization

3
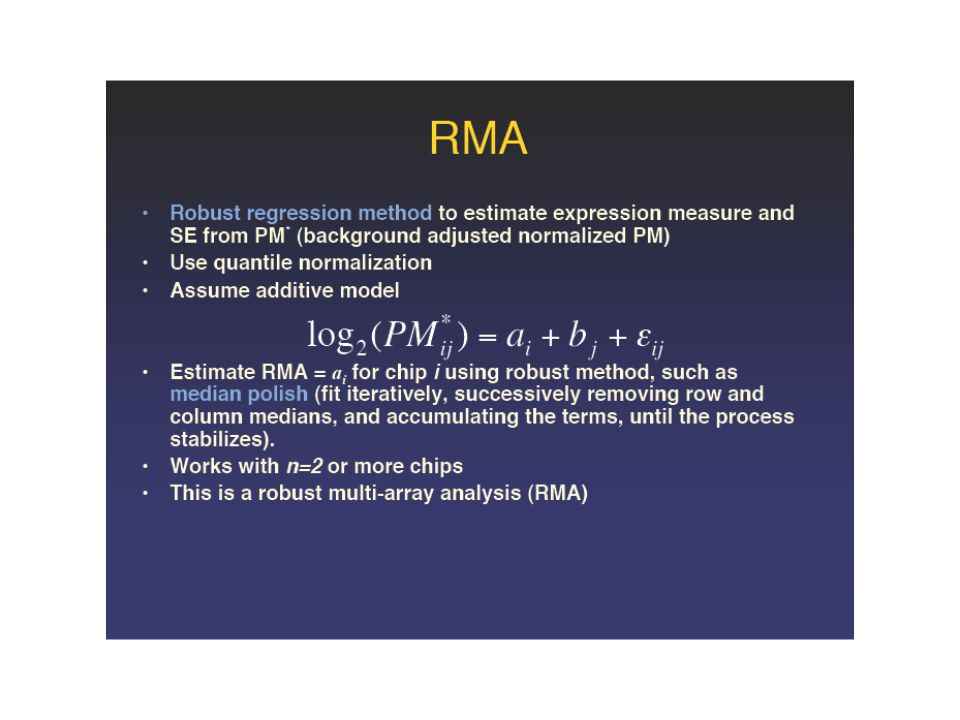
Microarray Technology Microarray: –New Technology (first paper: 1995) Allows study of thousands of genes at same time – Glass slide of DNA molecules Molecule: string of bases (25 bp – 500 bp) uniquely identifies gene or unit to be studied http://kbrin.a-bldg.louisville.edu/CECS694/
 Allows study of thousands of genes at same time – Glass slide of DNA molecules Molecule: string of bases (25 bp – 500 bp) uniquely identifies gene or unit to be studied")
4
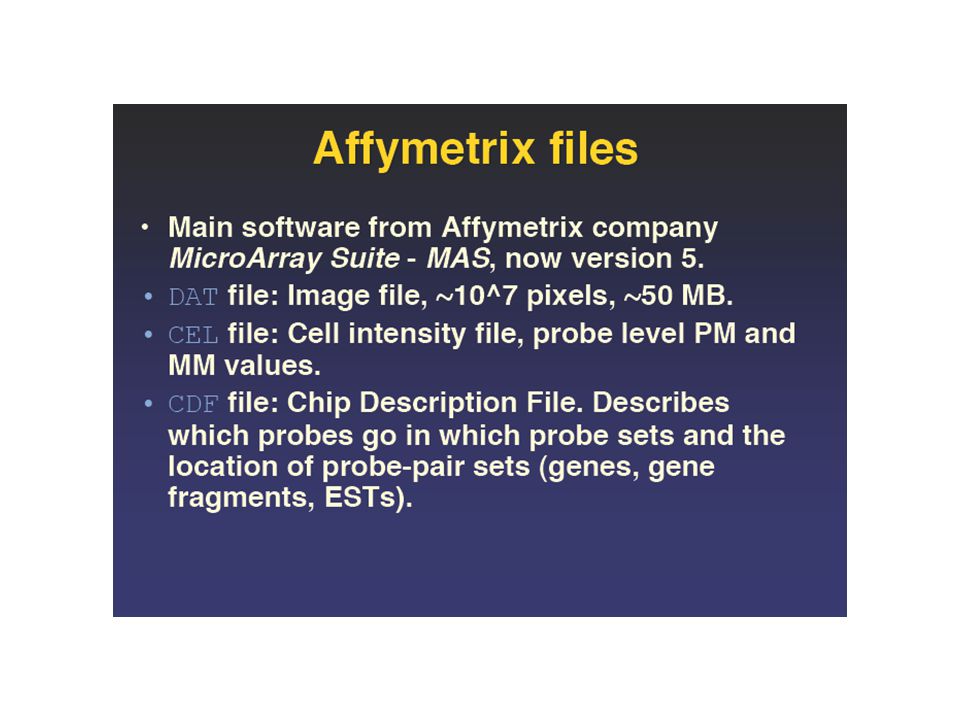
Fabrications of Microarrays Size of a microscope slide Images: http://www.affymetrix.com/

5
Differing Conditions Ultimate Goal: –Understand expression level of genes under different conditions Helps to: –Determine genes involved in a disease –Pathways to a disease –Used as a screening tool

6
Gene Conditions Cell types (brain vs. liver) Developmental (fetal vs. adult) Response to stimulus Gene activity (wild vs. mutant) Disease states (healthy vs. diseased)
 Response to stimulus Gene activity (wild vs. mutant) Disease states (healthy vs. diseased).")
7
Expressed Genes Genes under a given condition –mRNA extracted from cells –mRNA labeled –Labeled mRNA is mRNA present in a given condition –Labeled mRNA will hybridize (base pair) with corresponding sequence on slide
 with corresponding sequence on slide")
8
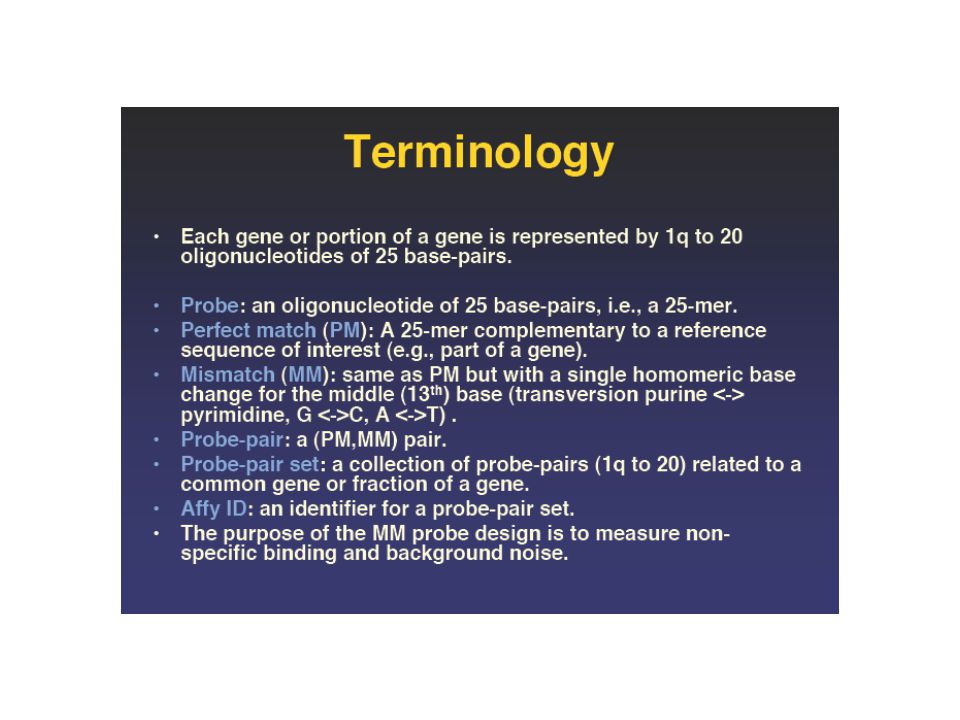
Two Different Types of Microarrays Custom spotted arrays (up to 20,000 sequences) –cDNA –Oligonucleotide High-density (up to 100,000 sequences) synthetic oligonucleotide arrays –Affymetrix (25 bases) –SHOW AFFYMETRIX LAYOUT
 –cDNA –Oligonucleotide High-density (up to 100,000 sequences) synthetic oligonucleotide arrays –Affymetrix (25 bases) –SHOW AFFYMETRIX LAYOUT")
9
Custom Arrays Mostly cDNA arrays 2-dye (2-channel) –RNA from two sources (cDNA created) Source 1: labeled with red dye Source 2: labeled with green dye
 –RNA from two sources (cDNA created) Source 1: labeled with red dye Source 2: labeled with green dye")
10
Two Channel Microarrays Microarrays measure gene expression Two different samples: –Control (green label) –Sample (red label) Both are washed over the microarray –Hybridization occurs –Each spot is one of 4 colors
 –Sample (red label) Both are washed over the microarray –Hybridization occurs –Each spot is one of 4 colors")
11
(Slide source: http://www.bsi.vt.edu/)

12
Microarray Image Analysis Microarrays detect gene interactions: 4 colors: –Green: high control –Red: High sample –Yellow: Equal –Black: None Problem is to quantify image signals

13
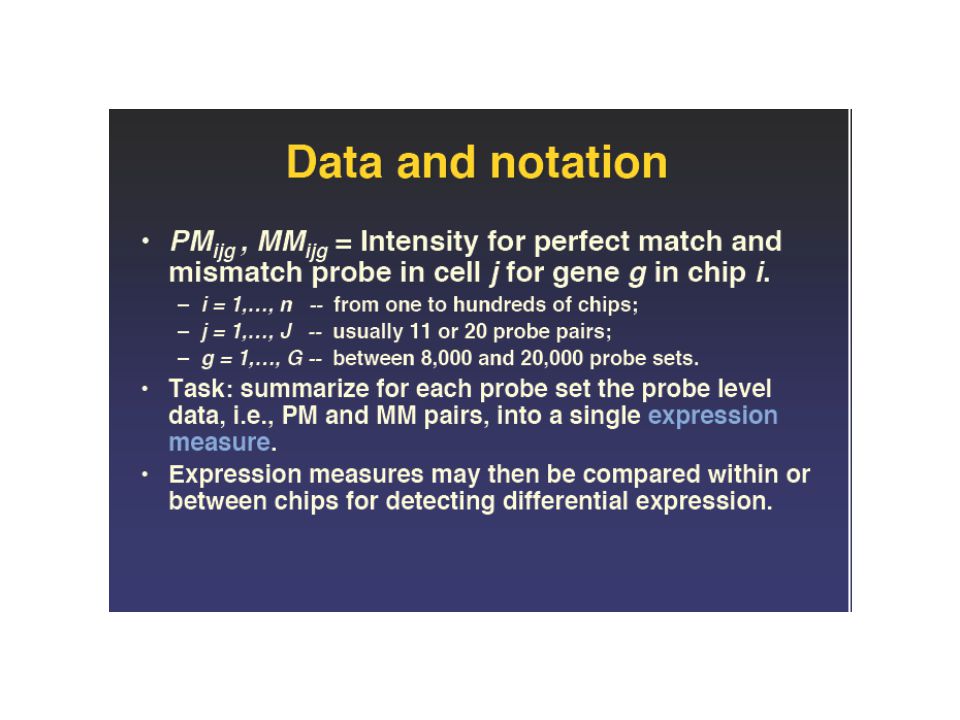
Information Extraction —Spot Intensities —mean (pixel intensities). —median (pixel intensities). —Background values —Local —Morphological opening —Constant (global) —None —Quality Information Take the average Speed Group Microarray Page http://stat-www.berkeley.edu/users/terry/zarray/Html/image.html Signal Background
. —Background values —Local —Morphological opening —Constant (global) —None —Quality Information Take the average Speed Group Microarray Page Signal Background.")
14
Single Color Microarrays Prefabricated –Affymetrix (25mers) Custom –cDNA (500 bases or so) –Spotted oligos (70-80 bases)
 Custom –cDNA (500 bases or so) –Spotted oligos (70-80 bases)")
15
Single Color Microarrays Expressed sequences washed over chips Expressed genes hybridize Light passed under to see intensity (or hybridized oligos show dark color)
")
16
Single Color Microarrays Image: http://www4.nationalacademies.org/

17
Affymetrix Technology DESOKY, 2003

18
Affymetrix Technology DESOKY, 2003

19
Lithography It is a printing technology. Lithography was invented by Alois Senefelder in Germany in 1798. The printing and non-printing areas of the plate are all at the same level, as opposed to intaglio and relief processes in which the design is cut into the printing block. Lithography is based on the chemical repellence of oil and water.

20
Lithography Designs are drawn or painted with greasy ink or crayons on specially prepared limestone. The stone is moistened with water, which the stone accepts in areas not covered by the crayon. An oily ink, applied with a roller, adheres only to the drawing and is repelled by the wet parts of the stone. The print is then made by pressing paper against the inked drawing.

21
Affymetrix Array Construction STROMBERG, 2003

22
Affymetrix Technology Biotin (one dye) instead of 2 colors One treatment per chip 11, 16, or 20 gene markers pairs per gene DESOKY, 2003
 instead of 2 colors One treatment per chip 11, 16, or 20 gene markers pairs per gene DESOKY, 2003")
23
Affymetrix Data Each gene labeled as “present”, “marginal”, or “absent.” –Present: gene expressed and reliably detected in the RNA sample Label chosen based on a p-value

24
PM to maximize hybridization MM to ascertain the degree of cross-hybridization Affymetrix Design of probes

25
PM MM Probe set Probe pair STROMBERG, 2003

51
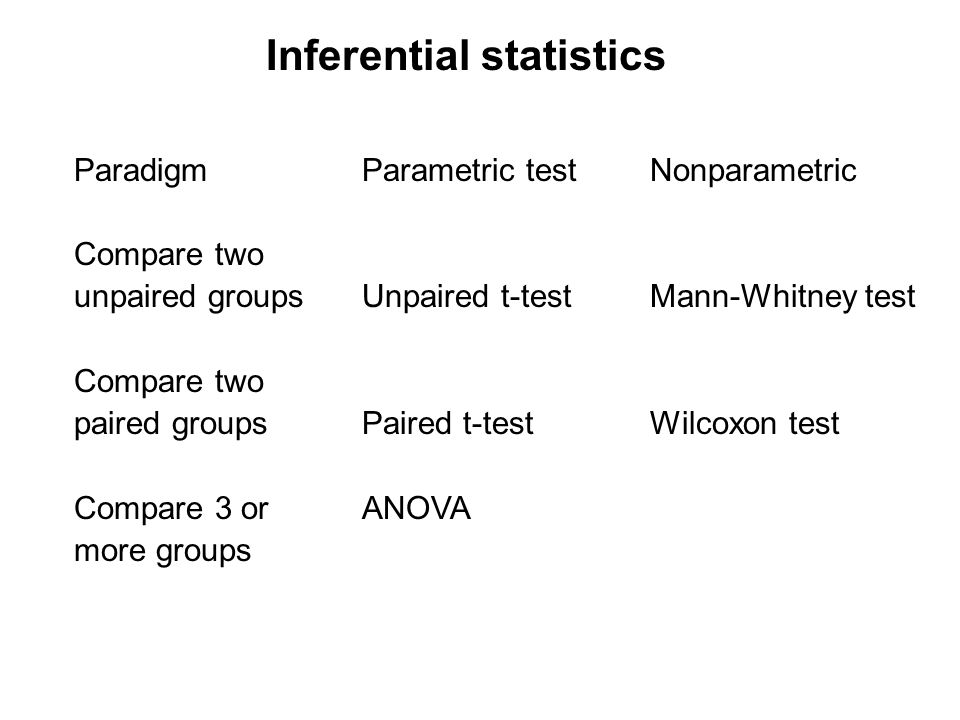
Inferential statistics ParadigmParametric testNonparametric Compare two unpaired groupsUnpaired t-testMann-Whitney test Compare two paired groupsPaired t-testWilcoxon test Compare 3 orANOVA more groups

52
Inferential statistics Is it appropriate to set the significance level to p < 0.05? If you hypothesize that a specific gene is up-regulated, you can set the probability value to 0.05. You might measure the expression of 10,000 genes and hope that any of them are up- or down-regulated. But you can expect to see 5% (500 genes) regulated at the p < 0.05 level by chance alone. To account for the thousands of repeated measurements you are making, some researchers apply a Bonferroni correction. The level for statistical significance is divided by the number of measurements, e.g. the criterion becomes: p < (0.05)/10,000 or p < 5 x 10 -6
 regulated at the p < 0.05 level by chance alone. To account for the thousands of repeated measurements you are making, some researchers apply a Bonferroni correction. The level for statistical significance is divided by the number of measurements, e.g. the criterion becomes: p < (0.05)/10,000 or p < 5 x")
53
Data matrix (20 genes and 3 time points from Chu et al.)
")
Similar presentations


 transcripts.>")


>")
 A microarray may contain thousands of ‘spots’. Each spot contains many copies of the same DNA sequence that uniquely represents a gene from.>")


