Download presentation
Presentation is loading. Please wait.

1
OBESITY AND THE REGULATION OF BODY WEIGHT

2
OBESITY: A Huge Public Health Problem Definition of obesity: BMI>30 Definition of overweight: BMI >25 BMI = weight (kg)/ height 2 (m)
/ height 2 (m)")
3
Obesity Trends* Among U.S. Adults BRFSS, 1985 (*BMI ≥30, or ~ 30 lbs overweight for 5’ 4” person) No Data <10% 10%–14% www.cdc.gov
 No Data <10% 10%–14%")
4
Obesity Trends* Among U.S. Adults BRFSS, 1986 (*BMI ≥30, or ~ 30 lbs overweight for 5’ 4” person) No Data <10% 10%–14%
 No Data <10% 10%–14%.")
5
Obesity Trends* Among U.S. Adults BRFSS, 1987 (*BMI ≥30, or ~ 30 lbs overweight for 5’ 4” person) No Data <10% 10%–14%
 No Data <10% 10%–14%.")
6
Obesity Trends* Among U.S. Adults BRFSS, 1988 (*BMI ≥30, or ~ 30 lbs overweight for 5’ 4” person) No Data <10% 10%–14%
 No Data <10% 10%–14%.")
7
Obesity Trends* Among U.S. Adults BRFSS, 1989 (*BMI ≥30, or ~ 30 lbs overweight for 5’ 4” person) No Data <10% 10%–14%
 No Data <10% 10%–14%.")
8
Obesity Trends* Among U.S. Adults BRFSS, 1990 (*BMI ≥30, or ~ 30 lbs overweight for 5’ 4” person) No Data <10% 10%–14%
 No Data <10% 10%–14%.")
9
Obesity Trends* Among U.S. Adults BRFSS, 1991 (*BMI ≥30, or ~ 30 lbs overweight for 5’ 4” person) No Data <10% 10%–14% 15%–19%
 No Data <10% 10%–14% 15%–19%.")
10
Obesity Trends* Among U.S. Adults BRFSS, 1992 (*BMI ≥30, or ~ 30 lbs overweight for 5’ 4” person) No Data <10% 10%–14% 15%–19%
 No Data <10% 10%–14% 15%–19%.")
11
Obesity Trends* Among U.S. Adults BRFSS, 1993 (*BMI ≥30, or ~ 30 lbs overweight for 5’ 4” person) No Data <10% 10%–14% 15%–19%
 No Data <10% 10%–14% 15%–19%.")
12
Obesity Trends* Among U.S. Adults BRFSS, 1994 (*BMI ≥30, or ~ 30 lbs overweight for 5’ 4” person) No Data <10% 10%–14% 15%–19%
 No Data <10% 10%–14% 15%–19%.")
13
Obesity Trends* Among U.S. Adults BRFSS, 1995 (*BMI ≥30, or ~ 30 lbs overweight for 5’ 4” person) No Data <10% 10%–14% 15%–19%
 No Data <10% 10%–14% 15%–19%.")
14
Obesity Trends* Among U.S. Adults BRFSS, 1996 (*BMI ≥30, or ~ 30 lbs overweight for 5’ 4” person) No Data <10% 10%–14% 15%–19%
 No Data <10% 10%–14% 15%–19%.")
15
Obesity Trends* Among U.S. Adults BRFSS, 1997 (*BMI ≥30, or ~ 30 lbs overweight for 5’ 4” person) No Data <10% 10%–14% 15%–19% ≥20%
 No Data <10% 10%–14% 15%–19% ≥20%.")
16
Obesity Trends* Among U.S. Adults BRFSS, 1998 (*BMI ≥30, or ~ 30 lbs overweight for 5’ 4” person) No Data <10% 10%–14% 15%–19% ≥20%
 No Data <10% 10%–14% 15%–19% ≥20%.")
17
Obesity Trends* Among U.S. Adults BRFSS, 1999 (*BMI ≥30, or ~ 30 lbs overweight for 5’ 4” person) No Data <10% 10%–14% 15%–19% ≥20%
 No Data <10% 10%–14% 15%–19% ≥20%.")
18
Obesity Trends* Among U.S. Adults BRFSS, 2000 (*BMI ≥30, or ~ 30 lbs overweight for 5’ 4” person) No Data <10% 10%–14% 15%–19% ≥20%
 No Data <10% 10%–14% 15%–19% ≥20%.")
19
Obesity Trends* Among U.S. Adults BRFSS, 2001 (*BMI ≥30, or ~ 30 lbs overweight for 5’ 4” person) No Data <10% 10%–14% 15%–19% 20%–24% ≥25%
 No Data <10% 10%–14% 15%–19% 20%–24% ≥25%.")
20
(*BMI ≥30, or ~ 30 lbs overweight for 5’ 4” person) Obesity Trends* Among U.S. Adults BRFSS, 2002 No Data <10% 10%–14% 15%–19% 20%–24% ≥25%

21
Obesity Trends* Among U.S. Adults BRFSS, 2003 (*BMI ≥30, or ~ 30 lbs overweight for 5’ 4” person) No Data <10% 10%–14% 15%–19% 20%–24% ≥25%
 No Data <10% 10%–14% 15%–19% 20%–24% ≥25%.")
22
Obesity Trends* Among U.S. Adults BRFSS, 2004 (*BMI ≥30, or ~ 30 lbs overweight for 5’ 4” person) No Data <10% 10%–14% 15%–19% 20%–24% ≥25%
 No Data <10% 10%–14% 15%–19% 20%–24% ≥25%.")
23
Obesity Trends* Among U.S. Adults BRFSS, 2005 (*BMI ≥30, or ~ 30 lbs overweight for 5’ 4” person) No Data <10% 10%–14% 15%–19% 20%–24% 25%–29% ≥30%
 No Data <10% 10%–14% 15%–19% 20%–24% 25%–29% ≥30%.")
24
Obesity Trends* Among U.S. Adults BRFSS, 2006 (*BMI ≥30, or ~ 30 lbs. overweight for 5’ 4” person) No Data <10% 10%–14% 15%–19% 20%–24% 25%–29% ≥30%
 No Data <10% 10%–14% 15%–19% 20%–24% 25%–29% ≥30%.")
25
Obesity Trends* Among U.S. Adults BRFSS, 2007 (*BMI ≥30, or ~ 30 lbs. overweight for 5’ 4” person) No Data <10% 10%–14% 15%–19% 20%–24% 25%–29% ≥30%
 No Data <10% 10%–14% 15%–19% 20%–24% 25%–29% ≥30%.")
26
Obesity Trends* Among U.S. Adults BRFSS, 2008 (*BMI ≥30, or ~ 30 lbs. overweight for 5’ 4” person) No Data <10% 10%–14% 15%–19% 20%–24% 25%–29% ≥30%
 No Data <10% 10%–14% 15%–19% 20%–24% 25%–29% ≥30%.")
27
www.cdc.gov/nccdphp/dnpa/obesity/trend/index.htm

28
From: Handbook of Obesity: Etiology and Pathophysiology, 2 nd edition, G.A. Bray and C. Bouchard, editors, Marcel Dekker, NY,2004 %

29
Obesity is a risk factor for: 1)Type 2 diabetes 2)Hypertension 3)Atherosclerosis 4)Some types of cancer 5)Asthma 6)Gall bladder problems 7)Fertility problems 8)Osteoarthritis 9)Sleep disordered breathing 10) Gastroesophageal reflux
Type 2 diabetes 2)Hypertension 3)Atherosclerosis 4)Some types of cancer 5)Asthma 6)Gall bladder problems 7)Fertility problems 8)Osteoarthritis 9)Sleep disordered breathing 10) Gastroesophageal reflux")
30
Prevalence of type 2 diabetes by BMI From: Handbook of obesity, Marcel Dekker Inc, 2004

31
Source: Mokdad et al., Diabetes Care 2000;23:1278-83; J Am Med Assoc 2001;286:10. Diabetes Trends* Among Adults in the U.S., (Includes Gestational Diabetes) BRFSS, 1990,1995 and 2001 19901995 2001
 BRFSS, 1990,1995 and")
32
What’s my BMI?

33
About 30.5 (based on height of 1.87 m and weight of 107 kg)
")
34
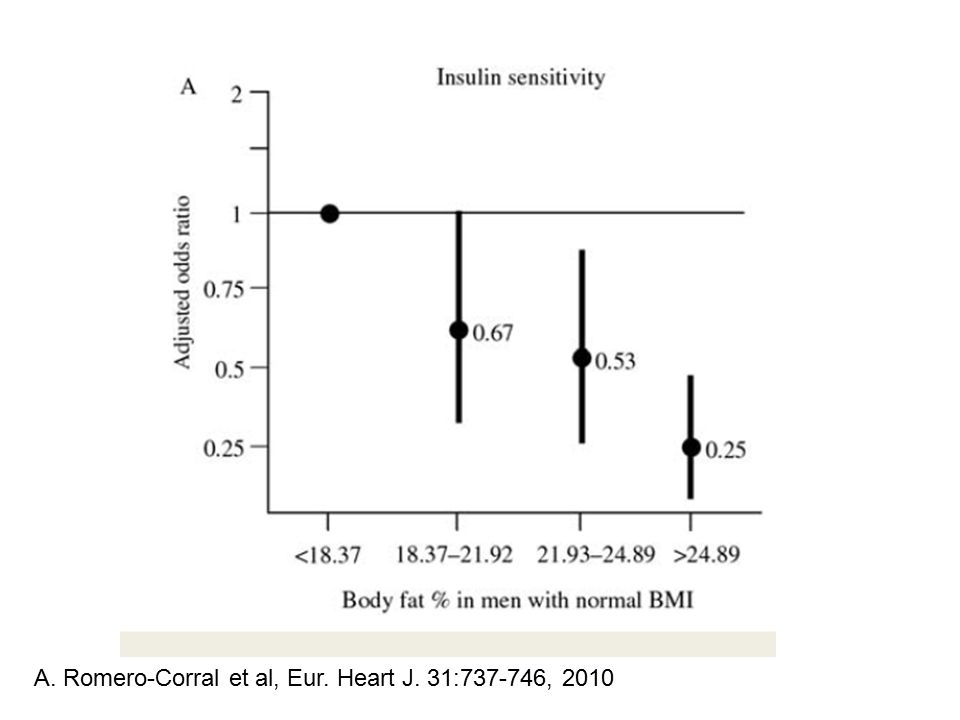
Normal BMI doesn’t necessarily mean normal body fat A. Romero-Corral et al, Eur. Heart J. 31:737-746, 2010

36
Body fat increases disease risk in normal weight subjects A. Romero-Corral et al, Eur. Heart J. 31:737-746, 2010

37
Risk of premature death BMI 20 25 30 3515

38
Risk factors for the development of obesity Genetics animals can be bred for fatness there are inbred strains of mice and rats that are spontaneously obese whole genome wide genetic studies have identified several genes associated with obesity Environment Animals on a high fat diet gain weight Human who live in other cultures gain weight when they move to the US or other places with a Western diet Animals born to obese mothers tend to also become obese Amount of sleep affects weight gain

39
Ob/Ob Wildtype (C57BL/6J)
")
40
Risk factors for the development of obesity Genetics animals can be bred for fatness there are inbred strains of mice and rats that are spontaneously obese whole genome wide genetic studies have identified several genes associated with obesity Environment Animals on a high fat diet gain weight Human who live in other cultures gain weight when they move to the US or other places with a Western diet Animals born to obese mothers tend to also become obese Amount of sleep affects weight gain

42
Risk factors for the development of obesity Genetics animals can be bred for fatness there are inbred strains of mice and rats that are spontaneously obese whole genome wide genetic studies have identified several genes associated with obesity Environment Animals on a high fat diet gain weight Human who live in other cultures gain weight when they move to the US or other places with a Western diet Animals born to obese mothers tend to also become obese Amount of sleep affects weight gain

43
Short sleep duration increases BMI From: Taheri et al, PLoS Med 3:e62, 2004

44
-Elevations of BMI are observed in subjects who sleep fewer than 6 h per night -Childhood sleeping problems predict adult BMI -Experimental acute sleep curtailment increases hunger and appetite especially for energy rich foods -Mice in which circadian rhythms are disrupted become obese -More than 33% of adolescents get less sleep than recommended Sleep and Obesity

45
WHY IS OBESITY INCREASING ? 1) Genetics? Unlikely. It takes thousands of years to change the gene pool that drastically (but could be epigenetic effects). 2) Changes in environment? Diet: more carbohydrates and less fat, also different types of fat Exercise: more sedentary lifestyles 3) Gene environment interactions? Susceptibility genes that are only expressed in conjunction with certain diets
. 2) Changes in environment. Diet: more carbohydrates and less fat, also different types of fat Exercise: more sedentary lifestyles 3) Gene environment interactions. Susceptibility genes that are only expressed in conjunction with certain diets.")
46
Not all fats are created equal: Amount of trans fat in diet is significantly related to waist circumference gain Total amount of fat in diet is not Koh-Banerjee et al, Am J Clin Nutr, 2003

47
Also called “partially hydrogenated” oil Performed to increase shelf life and increase flavor stability Present in most processed foods Makes fat solid at room temperature

48
Consumption of trans fats increases the risk of heart disease Mozaffarian et al NEJM 354:1601-1613, 2007

49
HOW IS BODY WEIGHT REGULATED? Body weight represents a balance between calorie input and calorie expenditure. InputsExpenditures -food eaten- basal metabolic rate - cost of food digestion (liver) - exercise
 - exercise.")
50
(ex: PYY)
")
51
GHRELIN (meal initiation) Peptide hormone produced by the stomach Levels rise just before a meal and fall afterwards Acts in the hypothalamus to stimulate appetite
 Peptide hormone produced by the stomach Levels rise just before a meal and fall afterwards Acts in the hypothalamus to stimulate appetite")
53
Ghrelin is produced in the stomach Normal Gastric Resection

54
PYY (involved in meal termination) Peptide hormone produced by the small intestines and colon Secreted after a meal in proportion to calories ingested Causes satiety and meal termination Fasting levels are reduced in obesity and levels don’t increase to the same extent as in lean subjects even after a large meal
 Peptide hormone produced by the small intestines and colon Secreted after a meal in proportion to calories ingested Causes satiety and meal termination Fasting levels are reduced in obesity and levels don’t increase to the same extent as in lean subjects even after a large meal")
55
Endogenous PYY after a meal in lean and obese subjects Batterham et al.New Engl.J. Med. 349:941-948, 2003

56
Batterham et al. N Engl J Med. 2003 349:941-8. Calorie intake after PYY infusion

57
Daily food intakeWeekly food intake Daily energy expenditure Weekly energy expenditure Longterm energy regulation Data suggest that input is matched to expenditures over long periods of time (weeks to months) but not over shorter periods (days). Suggests something that doesn’t change much acutely, for example, body energy stores are what is regulated. Body fat!

58
An extra 10 calories a day results in an approximate 12 pound weight gain over 10 years!

59
Leptin: Hormone produced in adipocytes in proportion to fat mass Acts in hypothalamus to signal satiety (prevent eating) Also acts in hypothalamus to increase metabolism
 Also acts in hypothalamus to increase metabolism")
60
Ob/Ob Wildtype (C57BL/6J)
")
61
Day Administering leptin to leptin deficient (ob/ob) mice reduces food intake and decreases body weight
 mice reduces food intake and decreases body weight")
64
Farooqi et al, New Engl. J. Med 341:879-884, 1999

65
Genetic defects in leptin are not very common in humans Genetic variations in the leptin receptor also very uncommon Obese humans have increased serum leptin (because they have more fat and fat makes leptin) How come the leptin doesn’t prevent them from eating? - leptin resistance just like insulin resistance in type II diabetes? - leptin doesn’t get across the blood brain barrier Leptin and human obesity

66
From: Taheri et al, PLoS Med 3:e62, 2004 Short sleep duration is associated with increased grelin and decreased leptin leptin ghrelin

67
ADIPOSE TISSUE CYTOKINES TNF IL-6 IL-1 PBEF TGF IL-10 CHEMOKINES IL-8 Eotaxin MCP-1 MIP-1 ENERGY REGULATING HORMONES Leptin Adiponectin Resistin ACUTE PHASE REACTANTS Serum amyloid A C-reactive protein PAI-1 1-acid glycoprotein OTHER FACTORS Angiotensinogen Complement B, C3, D Acylation-stimulating protein VEGF IL-1RA Retinol-binding protein-4

68
Macrophage specific antigen F4/80 in adipose tissue Lean female Lean male Agouti female DIO male Ob/ob Ob/ob male Weisberg et al, JCI 112:1796-1808,2003 Obese adipose tissue is laden with inflammatory cells

69
Weisberg et al, JCI 112:1796-1808,2003 Macrophage specific antigen F4/80 in skeletal muscle Ob/ob Lean muscle liver

70
ADIPONECTIN Produced by adipocytes Most abundant gene product in adipocytes Decreases in obesity and increases during weight loss No effect on body weight Effects on are energy metabolism - causes glucose uptake - promotes fatty acid oxidation - inhibits gluconeogenesis Improves glucose tolerance and increases insulin sensitivity Reduces hyperglycemia in animal models of type II diabetes

71
Mice overexpressing Adiponectin using a Liver specific promoter Yamauchi et al, J. Biol. Chem. 278:2461, 2003

72
Yamauchi et al, J. Biol. Chem. 278:2461, 2003

73
TREATMENT OF OBESITY 1)Liposuction 2)Gastric reduction surgery (side effects) 3)Wiring of the jaw 4)Drugs (side effects) 5)Diet and exercise 6)Behavior modification
Liposuction 2)Gastric reduction surgery (side effects) 3)Wiring of the jaw 4)Drugs (side effects) 5)Diet and exercise 6)Behavior modification")
74
Spread of obesity in social networks

75
Gut microbiome from obese mice has increased capacity for energy harvest

Similar presentations


, and varies with gender and age. Extra metabolic energy is consumed.>")


>")

/ height 2 (m) 30% of.>")


 ◦ Amount of ____________ needed to __________ the temperature of 1 _________ of pure water by 1C ______ calories =>")

