Download presentation
Presentation is loading. Please wait.

1
Tools for understanding the sequence, evolution, and function of the human genome. Jim Kent and the Genome Bioinformatics Group University of California Santa Cruz

2
The Goal Make the human genome understandable by humans.

3
Step 1 Sequence the human genome

4
Idealized Hierarchical Shotgun Sequencing

5
Mapping 300,000 BAC Clones Were Digested and Run on Agarose Gels Cari Soderlund’s FPC and Wash U Pathfinders Made Fingerprint Map Contigs Genetic and radiation hybrid maps placed contigs on chromsomes Bob Waterston escaping management

6
Sequence and Assembly BAC Clones shotgun sequenced at high throughput to 4x ‘draft’. Assembled with Phil Green’s Phrap

7
GigAssembler Jim Kent David Haussler (meanwhile Celera working on whole genome shotgun version)
")
8
The Truth +-?++?+-?--?+-?+-?++?+-?--?+-? Keeping strands straight is the hard part + light - darkness

9
“Finishing” Sequence Using primers to end of contigs close gaps. Checking automatic assembly especially near tandem repeats. Checking in-silico restriction digest of BAC matches actual digest. Time consuming - 1 year to ‘draft’ genome, 2 years to ‘finish’. Human finished. Mouse will be finished (currently half finished). Other genomes may stay at draft stage, though draft stage can be very good these days.
. Other genomes may stay at draft stage, though draft stage can be very good these days..")
10
Now What? TGGCTTTTGAAGGGAGTTCTGTTTATATATACGTCAACATCCAGTTGGAGGTGAAAAGGTTAGCACTTGACCCAGGAAGTATCCATGTTTGTTTCAAAAA TAAATCTGCTTCATAAATTTCTTCATCAGTCTTTTTTTCCATTATGAGCTTTGATTATAATAAAGGAGCTGTTATTAACTTTTATTCAAGAAAAGGCCCA TCTCTTTGAAAATATTTACCACCCTTCTCCCTTTCCCCTCATGAAATGTGCCAACTTCATAGGAATTAACAAATTGTAGCCCAGCCAAATACACGGATGC TTAAGCATACCTGAAACTTGAGTATATTTATTTATTACAGACATCCTAAGACCCGTAAACTCTGCTCTGGATCATATCACTCCAGGATCTCAGAGCTGTT CATGATTGTACAGGAAATGGGGAATATCATAGGCTCACAAAGGATAACTGATAGAACTCAGTGTGGTACTTTGGGGACATCAAACATTGTGCGACATGCA AAAGACTATTCACGAATAACACAAAATATACATTCATTGTGCCATCCATCACATTAACAATTGAGCTGAAAATACATTATATCCAGCTAAGATAACTGTG GAAGGAAGAAATTGGTTTGAATAATACTTTTAGGTTCTGAATAACCCAGCACAAATTTTAAACAGAGGGTGGCCCGAGAAGAAAGGGGTAGAGATTGGGA AAGACTTAGCACAGGAAGCCGGGTTTCTGAAGTTTGTGCTCTGCAGGGCTTCTTAACTGTAAGAACAAATCAAGGCTACCCTCTGAGGCATCTGATTGGG TTTAAATGAGGGAATTTTTTCTTTCACCTATAAAATTGTACCAGTTTAGAGAGTTTGCCCACCCTGTTTTAGTAACCTAAACATTTCTAGAAAATCTGTA TAAAGATAAATCTCTTAGGACAAAGTATTTACAACCAGCAAACTCACACACATGAAAATGACTTAAATTAAGGGATGAATTAATTGTGTAAACATATAGT GCATCTCTTCTTCCTGAGCTCCTGGACTCGCCTTTCGCTATATCCTACTTTCAAGGACAAGGGAGGGGAGAGCTGTACATATAGTTAGATAAAAGATGAG AAGATTCCTTCTGGCATGTTTCTGTTGGCAAAGGGAACTATTTTCCAAAAGGTCATCTGAAAGGAACAGTAGGTTCTGTGAATTCTCCTAAAAGCAGGAG GGATGTTAAGGCCCACCAGAAAATGTATGCTGGCACCCAATCTGGATGAAGGTGTTAACCCCGCACCAAGTCTCTGGTCCAGAATTATCTGCAAATATAT TATCCTGGCCAGGAGCTCCCCAGATAGGATTAGAAAGGAAGAAAGAGACTGTAAATGGAAAGAAAGATAAGCTAAGCATGTGCTTTGGGTAAGAAGTCCC AGCCCAAGGAGATGCCTGGGCTGTTGTCTGGGGCTGGAGCCGCCTCAGTGGGAGGTAGTCAGAGTGTCTGAGGTAGAAGACCCCGGGGAAGGAACGCAGG GCGAAGAGCTGGACTTCTCTGAGGATTCCTCGGCCTTCTCGTCGTTTCCTGGCGGGGTGGCCGGAGAGATGGGCAAGAGACCCTCCTTCTCACGTTTCTT TTGCTTCATTCGGCGGTTCTGGAACCAGATCTTCACTTGGGTCTCGTTGAGCTGCAGGGATGCAGCGATCTCCACCCTGCGGGCGCGCGTCAGGTACTTG TTGAAGTGGAACTCCTTCTCCAGTTCCGTGAGCTGCTTGGTAGTGAAGTTGGTGCGCACCGCGTTGGGTTGACCCAGGTAGCCGTACTCTCCAACTTTCC CTGGGGCAAAGTGGGAAGCCATGAGACGGAAATGTAAAAATTTTTAAATCGACTTGAGATTCCCCACACGCTTCATGGCAACACTCAGGTAAAGAAAAGA TCAAGAACTCAGCACAAATCGGGCTGTGGAGGGTGAGTGATGAGGTGTAAAGTGTTAACCTGATGTAAACCATTAGCATGGTCAGACCGGTGATTAATGG AGCCTCAAGATATTAACAGAACACTACCGTCACAATAACCACCCCCACATACTTCCTATTTCCCAAATGTATAAAATCCTTGAAAACACACCAATCCCTG AGACTTCTTTGCCCCAACACCTCTGGGCACCCTCTCCATGCACTACAACACTAGTCTGATACAAAAGCCTTTTAAAAAAAAGATCATTATTAATTTCCTT GGAAATTAAGCATACCAGCTCCTTCCAGAATAATCAAGGAGCATCCACCAACCAGCAGGACTGACCTGTTTTGGGAGGGTTTCTTTTGACTTTCATCCAG TCAAAAGTCTGCGCTGGAGAAGATGTCTCCGATGCGGGGGAGCGACAGGCTTCTTGGTGGCTGGCGTGGAGAGGGGACAAGGAGTTATTATACGTAGCCA GGGCCAGGCTCTGGTGCTCCTGTCCATATGAGTGGTGAATGTATTGAGGCGAGCCCACCGCGCCCCCAGCATAACCCTGGTGGTGGTGGTGATGCTGGAC CATGGGAGATGAGAGATTTCCAGAGTAAACAGCGGGAGCGCACTGGGGGTACCCACCACTTACGTCTGCTTCCTGATTTAACGCGTAGGGGCTGTAAGGC GCACTGAAGTTCTGTGAGCCATAGCTTGGACCACAACTTGAGTGGGAGTAGGACACCCCCAGGTTCCCGGAAGTCTGGTAGGTAGCCGGCTGGGGGTGGC GATGGTGGTGGTGGTGGTGGTGGTGGGGCGAACCGATCTGCACCCCCCTGCCCACTAGGAAGCGGTCGTCGCCGCCGCAACTGTTGGCGCTGACCGCGCA CGACTGGAAAGTTGTAATCCTATGGTCCGAGGGGTAGGCTCGGGCTGAGCAGGTCCCCGAGTCGCCACTGCTAAGTATGGGGTATTCCAGGAAGGAGTTC ATTCTTGCATTGTCCATCTGTCACTGAGTGACCTGGTCCTGCGAAGCCCGGCGTGACTGTGCCAACTTTCTCACTTCCTC

11
Finding the Genes Dr. Blat helping a gene find itself.

12
SIGLEC7 - a gene with some transcriptional complexity. Sialic Acid Binding/Ig-like Lectin 7 displayed in UCSC Genome Browser

13
Genes: Lines of Evidence Full length human mRNA (the best!) Protein homology with other species. EST evidence - 1st step for much mRNA. Evidence from genome/genome alignments HMM based gene finders

14
Transferrin Receptor in UCSC Genome Browser

15
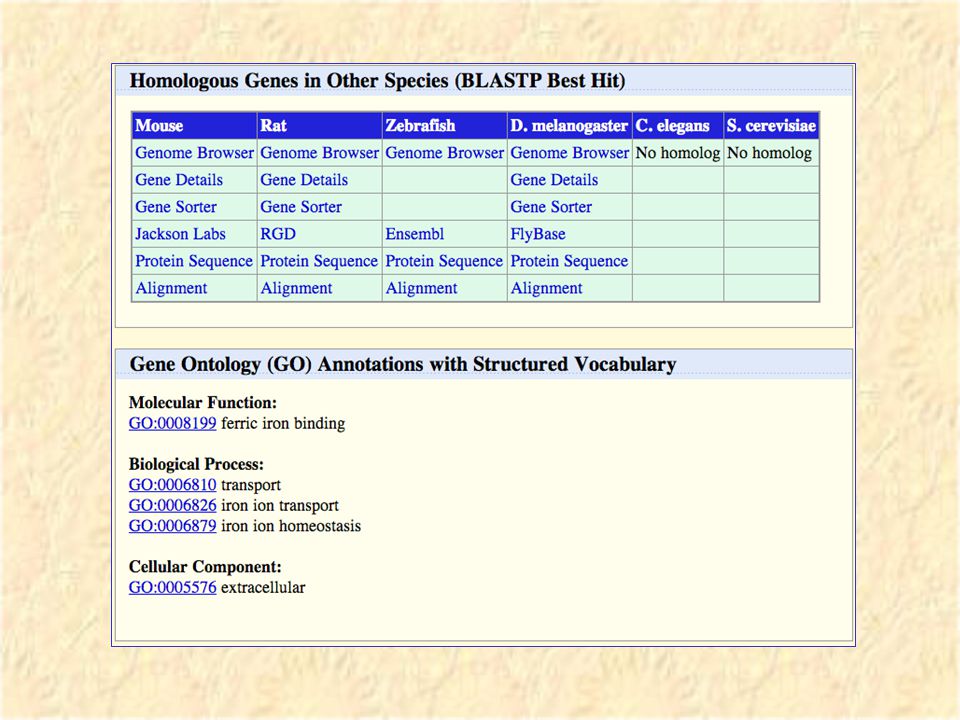
Clicking on a “known gene” brings up a large page of information on the gene. Transferrin

20
Current state of human genome ~99% of human genome sequenced. Last 1% will still be a challenge. ~85% of human genes located. Substantial resources are being devoted to last 15%. ~20% of human genes with any depth of functional annotation. Curation and integrated database are key to progress. <1% of human regulatory regions located.

21
Transferrin Receptor Note peaks of conservation in 3’ UTR. These include iron response elements which regulate translation of this gene.

22
Comparative Genomics Webb Miller

23
Comparative Genomics at BMP10

24
Conservation of Gene Features Conservation pattern across 3165 mappings of human RefSeq mRNAs to the genome. A program sampled 200 evenly spaced bases across 500 bases upstream of transcription, the 5’ UTR, the first coding exon, introns, middle coding exons, introns, the 3’ UTR and 500 bases after polyadenylatoin. There are peaks of conservation at the transition from one region to another.

25
Chaining Alignments Chaining bridges the gulf between syntenic blocks and base-by-base alignments. Local alignments tend to break at transposon insertions, inversions, duplications, etc. Global alignments tend to force non-homologous bases to align. Chaining is a rigorous way of joining together local alignments into larger structures.

26
Chains join together related local alignments Protease Regulatory Subunit 3

27
Affine penalties are too harsh for long gaps Log count of gaps vs. size of gaps in mouse/human alignment correlated with sizes of transposon relics. Affine gap scores model red/blue plots as straight lines.

28
Before and After Chaining

29
Chaining Algorithm Input - blocks of gapless alignments from blastz Dynamic program based on the recurrence relationship: score(B i ) = max(score(B j ) + match(B i ) - gap(B i, B j )) Uses Miller’s KD-tree algorithm to minimize which parts of dynamic programming graph to traverse. Timing is O(N logN), where N is number of blocks (which is in hundreds of thousands) j<i
, where N is number of blocks (which is in hundreds of thousands) j<i.")
30
Netting Alignments Commonly multiple mouse alignments can be found for a particular human region, particularly for coding regions. Net finds best match mouse match for each human region. Highest scoring chains are used first. Lower scoring chains fill in gaps within chains inducing a natural hierarchy.

31
Net Focuses on Ortholog

32
Net highlights rearrangements A large gap in the top level of the net is filled by an inversion containing two genes. Numerous smaller gaps are filled in by local duplications and processed pseudo-genes.

33
Useful in finding pseudogenes Ensembl and Fgenesh++ automatic gene predictions confounded by numerous processed pseudogenes. Domain structure of resulting predicted protein must be interesting!

34
Mouse/Human Rearrangement Statistics Number of rearrangements of given type per megabase excluding known transposons.

35
A Rearrangement Hot Spot Rearrangements are not evenly distributed. Roughly 5% of the genome is in hot spots of rearrangements such as this one. This 350,000 base region is between two very long chains on chromosome 7.

36
Reconstructed ancestral (boreutherian) genome for one chromosome
 genome for one chromosome")
37
Finding Function We’ve located 85% of the genes, on track for 95% in a year or two. We have SOME idea of what 30% of the genes do. We have virtually NO idea of what the rest do.

38
How to Find Function Homology - guilt by association. Orthologs very valuable. Genetics/knockouts - what happens when a gene gets broken? –RNAi is speeding this up amazingly in worms and other model organisms. Expression - when and where is gene used? –Microarrays, in situs, GFP fusions. Interactions - what molecules are touching? –Yeast 2 hybrid, Immunoprecipitations Literature - finding out what we already know.

39
Data Mining

40
Gene Sorter - info on sets of genes

41
Sorted by homology

42
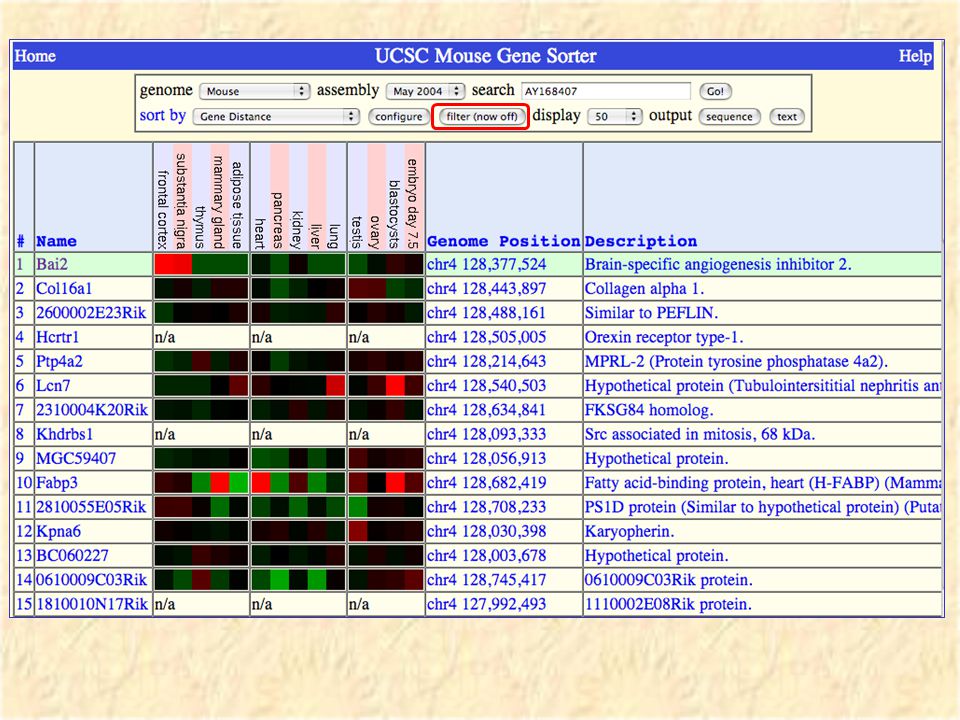
Sorted by genome distance

43
Coping with Bioinformatics Tower of Babel

45
Up in Testes, Down in Brain

46
Encode Project ENCyclopedia Of DNA Elements Pilot phase: detailed experimental analysis of 1% of genome in ~40 different regions. Many types of experiments –CHIP/CHIP –DNAse hypersensitivity –Tiling microarrays –Deep comparative genomics Data available at genome.ucsc.edu via ENCODE link.

47
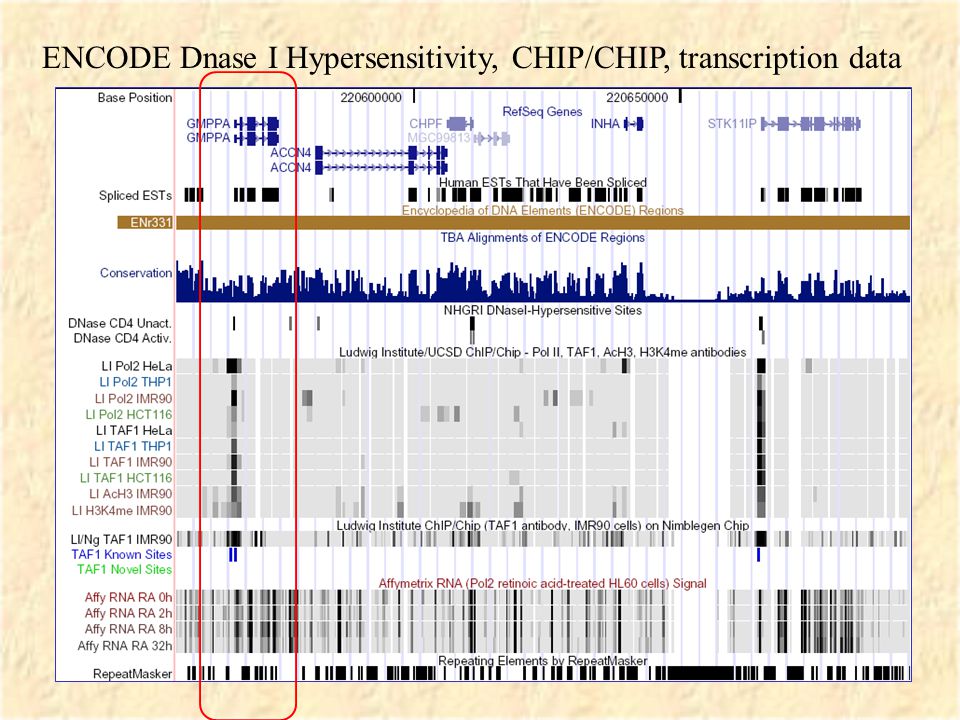
ENCODE Dnase I Hypersensitivity, CHIP/CHIP, transcription data

49
Close up of region

50
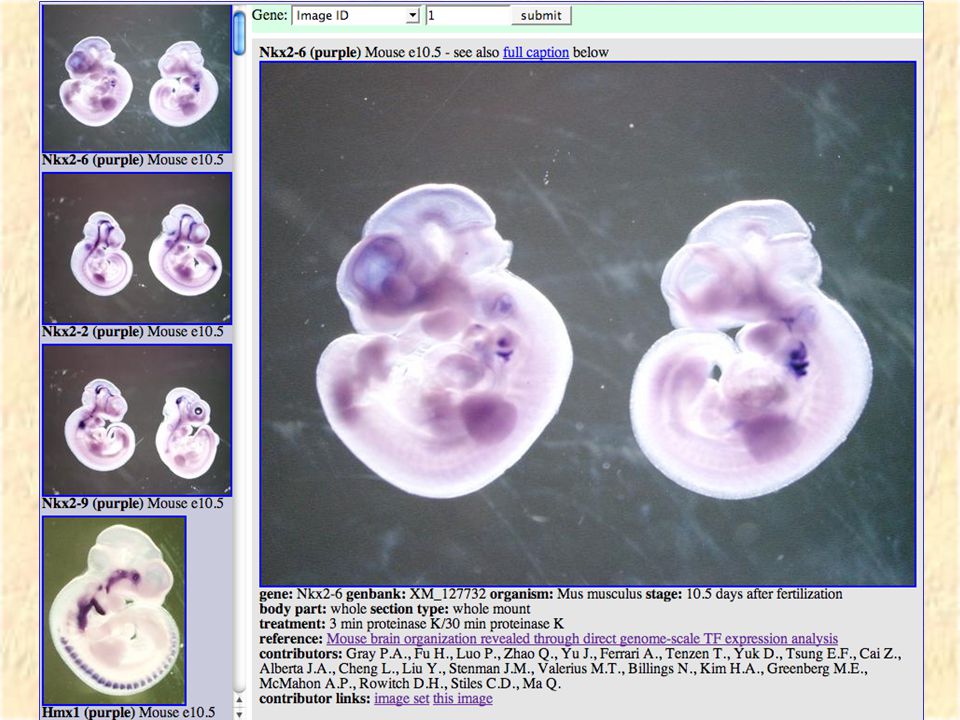
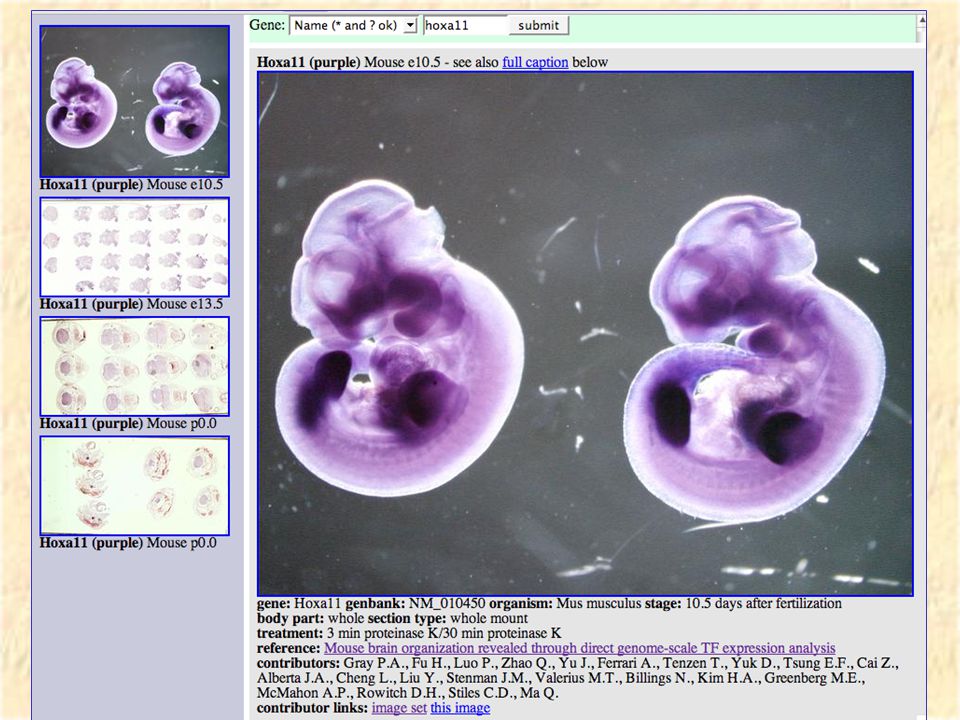
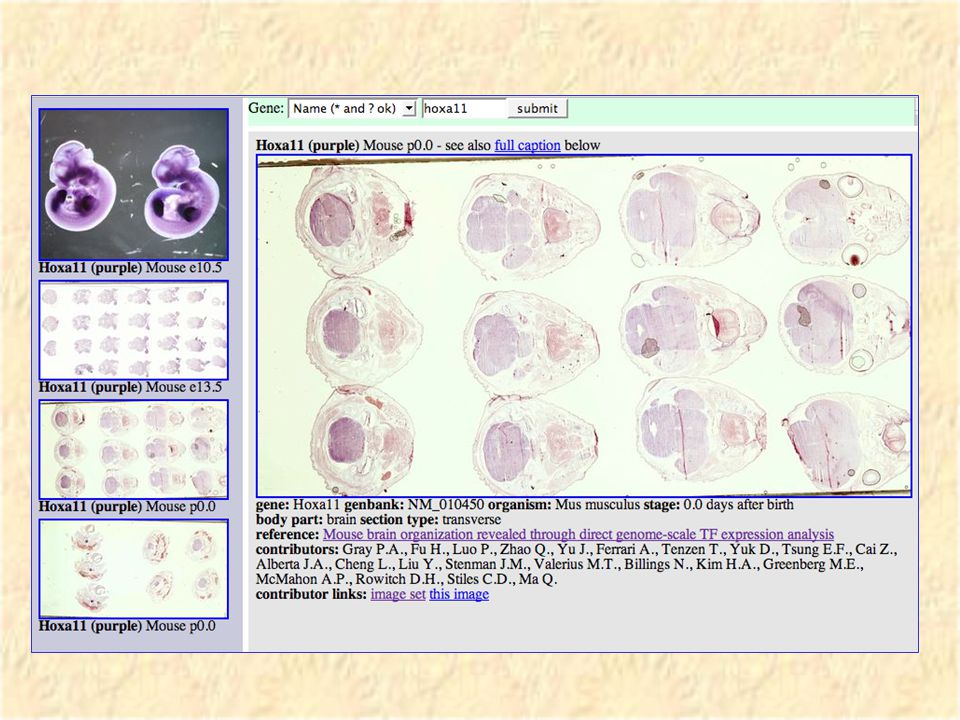
VisiGene Image browser for in-situ and other gene- oriented pictures Hopefully in the long run will have a million images covering almost all vertebrate genes. Currently has 6000 images covering 1000 mouse transcription factors courtesy of Paul Gray et al.

54
Gene Browser Staff Programming: Hiram Clawson, Mark Diekhans, Rachel Harte, Angie Hinrichs, Fan Hsu, Andy Pohl, Kate Rosenbloom, Chuck Sugnet, Docs, quality, support: Gill Barber, Ron Chao, Jennifer Jackson, Donna Karolchik, Bob Kuhn, Crystal Lynch, Ali Sultan- Qurraie, Heather Trumbower Computer systems: Jorge Garcia, Patrick Gavin, Paul Tatarsky

55
Comparative Genomics UCSC - Robert Baertsch, Gill Bejerano, Yontoa Lu, Jacob Pedersen, Katie Pollard, Adam Siepel, Daryl Thomas, David Haussler PSU - Laura Elnitski, Belinda Giardine, Ross Hardison, Minmei Hou, Scott Schwartz, Webb Miller,

56
Data Contributors Human Genome Project Genbank/DDJ/EMBL contributors Novartis GNF foundation Affymetrix, Perlegen, SNP Consortium SwissProt, Ensembl, EBI and NCBI Jackson Labs, RGD, Wormbase, Flybase Many contributors of gene prediction and other tracks.

57
Funding National Human Genome Research Institute Howard Hughes Medical Institute Taxpayers in the USA and California

58
THE END

59
Confounded Pseudogenes! Pseudogenes confound HMM and homology based gene prediction. Processed pseudogenes can be identified by: –Lack of introns (but ~20% of real genes lack introns) –Not being the best place in genome an mRNA aligns (be careful not to filter out real paralogs) –Being inserted from another chromosome since dog/human common ancestor (breaking synteny). –High rate of mutation (Ka/Ks ratio). Robert Baertsch at UCSC has produced a processed pseudogene track. Yontoa Lu working on a non-processed pseudogene track.
 –Not being the best place in genome an mRNA aligns (be careful not to filter out real paralogs) –Being inserted from another chromosome since dog/human common ancestor (breaking synteny). –High rate of mutation (Ka/Ks ratio). Robert Baertsch at UCSC has produced a processed pseudogene track. Yontoa Lu working on a non-processed pseudogene track..")
60
Close up of two processed pseudogenes

61
Detail Near Translation Start Note the relatively conserved base 3 before translation Start (constrained to be a G or an A by the Kozak Consensus sequence, and the first three translated bases (ATG).
.")
62
Normalized eScores

63
Table browser - text-oriented browsing and data analysis of genome browser database.

Similar presentations


![[BejeranoWinter12/13] 1 MW 11:00-12:15 in Beckman B302 Prof: Gill Bejerano TAs: Jim Notwell & Harendra Guturu CS173 Lecture 12:](/13/3992763/big_thumb.jpg "[BejeranoWinter12/13] 1 MW 11:00-12:15 in Beckman B302 Prof: Gill Bejerano TAs: Jim Notwell & Harendra Guturu CS173 Lecture 12:>")

 A rapid and reliable display of any requested portion of genomes.>")


![[Bejerano Aut08/09] 1 MW 11:00-12:15 in Beckman B302 Profs: Serafim Batzoglou, Gill Bejerano TA: Cory McLean.](/16/5007573/big_thumb.jpg "[Bejerano Aut08/09] 1 MW 11:00-12:15 in Beckman B302 Profs: Serafim Batzoglou, Gill Bejerano TA: Cory McLean.>")


 and Ensembl (EBI, UK)>")
![[Bejerano Fall09/10] 1 This Friday 10am Beckman B-200 Introduction to the UCSC Browser.](/17/5310704/big_thumb.jpg "[Bejerano Fall09/10] 1 This Friday 10am Beckman B-200 Introduction to the UCSC Browser.>")

![[Bejerano Spr06/07] 1 TTh 11:00-12:15 in Clark S361 Profs: Serafim Batzoglou, Gill Bejerano TAs: George Asimenos, Cory McLean.](/17/5323646/big_thumb.jpg "[Bejerano Spr06/07] 1 TTh 11:00-12:15 in Clark S361 Profs: Serafim Batzoglou, Gill Bejerano TAs: George Asimenos, Cory McLean.>")

