Download presentation
Presentation is loading. Please wait.

1
Efficient Estimation of Emission Probabilities in profile HMM By Virpi Ahola et al Reviewed By Alok Datar

2
Index 1. Motivation 2. Introduction 3. Method 4. Simulation Results 5. Conclusion

3
1. Motivation Drawbacks of HMM is that conserved amino acids are not emphasized. Signal and noise are treated equally Hence the no. of estimated parameters is enormous. Need to focus on conserved amino acids only, to improve accuracy.

4
2. Introduction Profile HMMs originate from the profile analysis. The essence of the profile analysis is that the information concerning the conservation of the residues is incorporated into the profile, whereby the analysis is able to detect structural similarities and homologies to the sequence family. In HMM models, emission probabilities of all 20 amino acids are estimated in all emitting states, and thus the number of estimated parameters can be enormous.

5
2. Introduction (continued) For example, if the model includes 300 emitting states, the number of emission parameters is 5700. Most of the parameters are however noise, i.e. is unconserved parameters. This paper presents an alternative, likelihood- based approach to the problem of reducing the parameter space in HMMs.
 For example, if the model includes 300 emitting states, the number of emission parameters is Most of the parameters are however noise, i.e. is unconserved parameters. This paper presents an alternative, likelihood- based approach to the problem of reducing the parameter space in HMMs..")
6
2. Introduction (continued) The advantage of the new method is that it explicitly takes into account conservation of the alignment.
 The advantage of the new method is that it explicitly takes into account conservation of the alignment..")
7
3. Methods 3.1 Profile HMM 3.2 Classification Algorithm 3.3 EEP Estimation Method

8
3.1 Profile HMM The profile HMM architecture (Durbin et al., 1998) has three classes of states: match state insert state delete state The match and the insert states always emit a symbol Delete states are silent. The model starts from the begin state and ends with the end state.

9
3.1 Profile HMM (continued) The model length is determined by the number of positions, that is, the number of match–insert–delete state triplets between the begin and the end states. An observation sequence {Yi } is considered to be a stochastic process with a finite set of symbols O ={o1, o2,..., oS}. The state sequence, the path that goes through the model, is a finite-state Markov chain {Xi }. The emitted symbols are assumed to be conditionally independent given the states.

10
3.1 Profile HMM (continued) When the estimation is based on the sequence alignment, the columns of the multiple alignment are assigned as match or insert states before the estimation. Thus, the path that generates the sequence is known. Columns representing conserved positions are chosen as match states Rest of the states as insert states.

11
3.1 Profile HMM (continued) The profile HMM has two sets of parameters: Transition probabilities Emission probabilities
 The profile HMM has two sets of parameters: Transition probabilities Emission probabilities")
12
3.2 Classification Algorithm Basis for the EEP method that in match states the emission probability distributions are conserved on some residues. Other residues occur relatively seldom. In practice, the determination of conserved residues is variable.

13
3.2 Classification Algorithm (continued)
")
14
In the above algorithm At each iteration step, the residue with the largest relative frequency with respect to its background probability was defined as effective or ineffective depending on a fixed threshold value. Remaining probabilities were updated so that they again summed to one.

15
3.2 Classification Algorithm (continued) The renormalizing step is necessary because otherwise those residues with low background probability tend to be chosen as effective more often than those with high background probability.
 The renormalizing step is necessary because otherwise those residues with low background probability tend to be chosen as effective more often than those with high background probability.")
16
3.3 EEP Estimation Method EEP is constructed by the log likelihood function of multinominal distribution. Where nj is a frequency of an amino acid j.

17
3.3 EEP Estimation Method (continued) Constraints of log likelihood function defined as Where are constants
 Constraints of log likelihood function defined as Where are constants")
18
3.3 EEP Estimation Method (continued) First constraint ensures that the mutual ratios of the ineffective residues remains same as in background distribution. Second constraint ensures that total proportion of effective residues to ineffective residues does not increase too much w.r.t to background distribution

19
3.3 EEP Estimation Method (continued) There are two possible sets of solution depending on the above mentioned inequality
 There are two possible sets of solution depending on the above mentioned inequality")
20
3.3 EEP Estimation Method (continued) If the inequality is true then rescaled optimal probabilities are calculated as mentioned below The probabilities of the ineffective residues are estimated by dividing the sum of the remaining probability in proportion to the background probability.
 If the inequality is true then rescaled optimal probabilities are calculated as mentioned below The probabilities of the ineffective residues are estimated by dividing the sum of the remaining probability in proportion to the background probability.")
21
3.3 EEP Estimation Method (continued) If the inequality is not true then the probabilities are given by the following equations.
 If the inequality is not true then the probabilities are given by the following equations.")
22
4. Simulation Results In order to study how successfully the EEP method classifies the residues as effective or ineffective, the percentages of misclassified residues were calculated. The accuracy and variance of the EEP estimates were compared to the ML estimates. Finally, the robustness of the EEP method for the choice of the threshold value was examined.

23
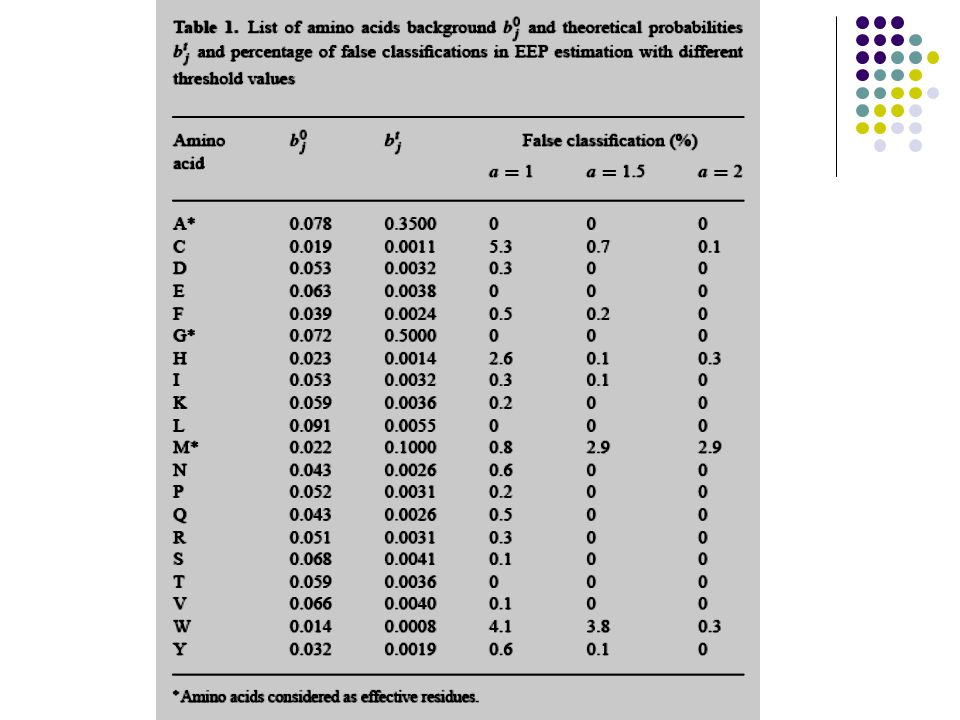
4. Simulation Results The theoretical simulation set was composed of three effective residues: alanine (35%), glycine (50%),and methionine (10%). The other residues were ineffective and were assigned by sharing the remaining probability in the same proportion as their background probabilities
, glycine (50%),and methionine (10%). The other residues were ineffective and were assigned by sharing the remaining probability in the same proportion as their background probabilities.")
25
4.1 False effective and Ineffective Residues Among the effective residues, alanine and glycine were correctly classified through all simulations. The number of misclassified methionine residues increased from 0.8 to 2.9% as the threshold value was increased from 1 to 2. As the threshold value increases, the classification of effective residues whose probabilities are relatively low might fail. This problem, however, disappears as the number of estimated sequences increases.

26
4.1 False Effectives and Ineffective residue (continued) When the threshold value was set to 1, cysteine, histidine, and tryptophan were misclassified in 5.3, 2.6 and 4.1% of the simulations, respectively. The variations seem to be closely related to the background distribution. Residues with low background probabilities tend to be more often misclassified than the others.

27
4.2 Accuracy and variance of estimates

28
4.2 Accuracy and variance of estimates (continued) Estimates of effective residues were rather accurate. There was no great difference between ML and EEP as seen from the figure.

29
4.2 Accuracy and variance of estimates (continued)
")
30
Considering the ineffective residue estimates, as can be seen from the figure there is a great difference between ML and EEP estimates. Variance in EEP estimates was clearly lot lesser than in ML estimates.

31
4.3 Choosing the threshold value To examine the effect of threshold value on estimation, data was estimated using incorrect threshold. For threshold value less than true threshold sensitivity improved and specificity worsened Opposite was true for threshold values greater than true threshold. As far as accuracy was concerned sensitivity seemed more important than specificity.

32
5. Conclusion The major advantage is the decrease in the dimension of the parameter space. In protein sequence alignments, the decrease is significant because in conserved positions only a few residues can be considered as effective. The study with 20 well-defined protein families indicates that the EEP method is able to detect sequences on average with 98% sensitivity and 99% specificity.

33
5. Conclusion (continued) As a consequence of the reduction of the parameter space, the variance of the ineffective residues decreases without influencing variance of the effective residues. The major disadvantage is its inability to take into account the physical and chemical characteristics of the amino acids, and thus, it ignores the relationships among the amino acids.
 As a consequence of the reduction of the parameter space, the variance of the ineffective residues decreases without influencing variance of the effective residues. The major disadvantage is its inability to take into account the physical and chemical characteristics of the amino acids, and thus, it ignores the relationships among the amino acids..")
Similar presentations


 Steven Salzberg CMSC 828H, Univ. of Maryland Fall 2010.>")


