Download presentation
Presentation is loading. Please wait.

1
Maryland Climate, Past ~100 yrs Max & Min Surface Air Temperature: Observed Trends in Averages and Variability Dr. Konstantin Vinnikov, Acting State Climatologist for Maryland Prof. Russell Dickerson, Department of Atmospheric and Oceanic Science University of Maryland at College Park, MD Progress Report to MDE February 5, 2009

2
GOAL: Study of century-scale changes in MD’s climate and its variability. Easterling et al. (1997) reported greater trends in T min than in T max from 1950 Less impact on air quality Vose et al. (2004) recently reported these trends are equal from 1979. Is the distribution broadening as predicted by the Harvard group? Greater impact on air quality These critical questions for PM2.5 and O 3. Variables: T max & T min, Daily observations for ~ 100 yrs. Source of Data: NCDC/NOAA. Data Corrections: Correction for Observation Time. Correction for changes of station location, etc. (by Menne & Williams, 2008). Quantify Heat Island Effect (future work).
 reported greater trends in T min than in T max from 1950 Less impact on air quality Vose et al. (2004) recently reported these trends are equal from Is the distribution broadening as predicted by the Harvard group. Greater impact on air quality These critical questions for PM2.5 and O 3. Variables: T max & T min, Daily observations for ~ 100 yrs. Source of Data: NCDC/NOAA. Data Corrections: Correction for Observation Time. Correction for changes of station location, etc. (by Menne & Williams, 2008). Quantify Heat Island Effect (future work)..")
3
Statistical Model for Expected value: y(t)=Y(t)+y’(t), where y(t) is the observed variable, Y(t) is the time dependent expected value of y(t), t - is time. Y(t)=A(t)+B(t)·t, A(t)=A(t+T), B(t)=B(t+T), T = 1 year. B(t) here is the linear trend in the expected value of y(t). Statistical Model for Variance: v(t)=[y’(t)] 2 =V(t)+v’(t). V(t)=C(t)+D(t)·t, C(t)=C(t+T), D(t)=D(t+T). D(t) is the linear trend in variance of y(t).
=A(t)+B(t)·t, A(t)=A(t+T), B(t)=B(t+T), T = 1 year. B(t) here is the linear trend in the expected value of y(t). Statistical Model for Variance: v(t)=[y’(t)] 2 =V(t)+v’(t). V(t)=C(t)+D(t)·t, C(t)=C(t+T), D(t)=D(t+T). D(t) is the linear trend in variance of y(t)..")
4
Maryland and Vicinity: Observed Daily T max & T min are Available for More than 95 yr. Stations Map

6
100 yr Averages (ºC) & Trends (ºC)/100 yr Mean Variances ( ºC) 2 & Trends (ºC) 2 /100 yr What we are looking for: 1.Asymmetry in trends of T max & T min. We expect that: Trend(T min )>Trend(T max ). 2. Trends in Variances. What we see here: 1. An Asymmetry does depend on station. 2. All these three stations display a century scale decreasing trend in variances of T max. Trends in variances of T min are uncertain. T max T min Trends Variances Trends
>Trend(T max ). 2. Trends in Variances. What we see here: 1. An Asymmetry does depend on station. 2. All these three stations display a century scale decreasing trend in variances of T max. Trends in variances of T min are uncertain. T max T min Trends Variances Trends.")
8
100 yr Averages (ºC) & Trends (ºC)/100 yr Mean Variances (ºC) 2 & Trends (ºC) 2 /100 yr 1. The expected asymmetry of trends in T max & T min at Laurel and Oakland. 2. There is century-scale warm seasons decreasing in variance of T max.

10
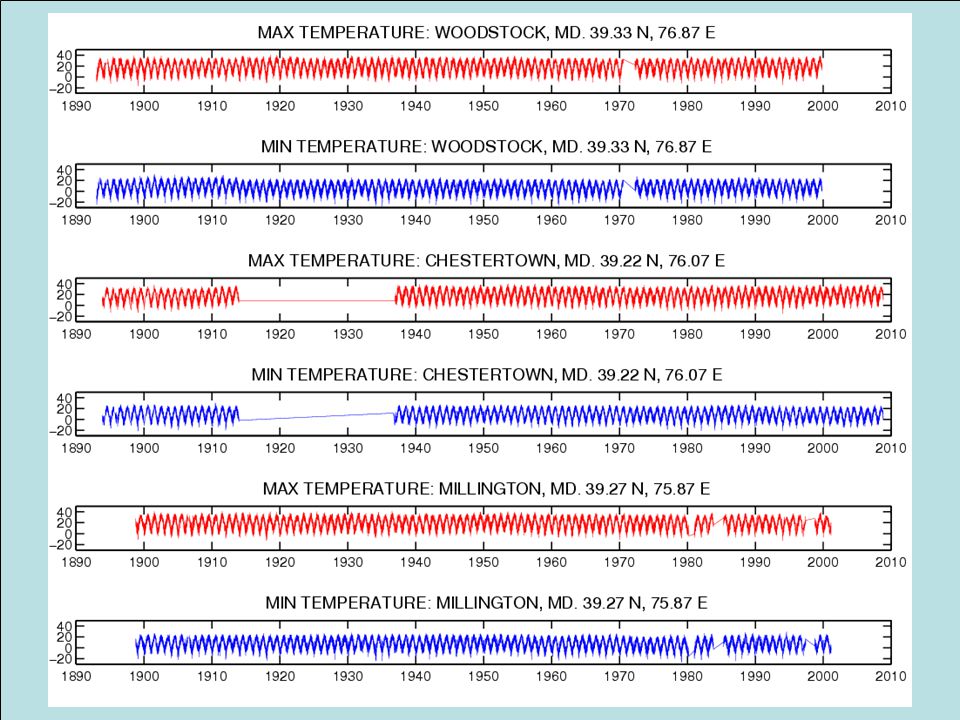
100 yr Averages (ºC) & Trends (ºC)/100 yr Mean Variances (ºC) 2 & Trends (ºC) 2 /100 yr 1.Observed Trends in T max are larger than Trends in T min for these three stations. 2.One of these stations, Chestertown, MD, displays an increasing trend in variance of T max.

11
Preliminary conclusions: A century-scale warming trends can be clearly seen in observations of T max /T min at 5 of 9 chosen meteorological stations at Maryland. An expected asymmetry with Trend(T min )>Trend(T max ) is found in observations of 3 of 9 chosen stations. Five other stations display an opposite Trend(T min )<Trend(T max ). Century-scale decreasing trends in variance of Tmax are found in observations at of 8 of 9 chosen meteorological stations. The work is in progress. Next steps will include analysis of all stations, better trend model, statistics of heat waves occurrence and trends in heat waves occurrence and length.
>Trend(T max ) is found in observations of 3 of 9 chosen stations. Five other stations display an opposite Trend(T min )<Trend(T max ). Century-scale decreasing trends in variance of Tmax are found in observations at of 8 of 9 chosen meteorological stations. The work is in progress. Next steps will include analysis of all stations, better trend model, statistics of heat waves occurrence and trends in heat waves occurrence and length..")
Similar presentations