Download presentation
Presentation is loading. Please wait.

1
The Normal Curve and Sampling A.A sample will always be different from the true population B.This is called “sampling error” C.The difference between a sample and the true population, regardless of how well the survey was designed or implemented D.Different from measurement error or sample bias

2
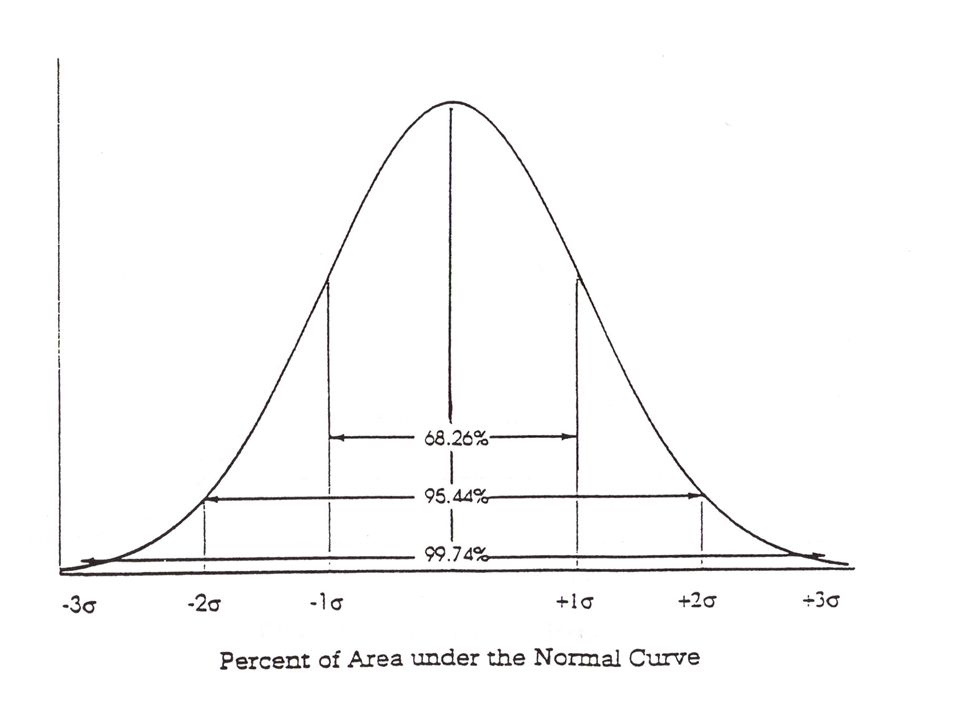
Sampling distribution of Means The existence of sampling error means that if you take a 1000 random samples from a population and calculate a 1000 means and plot the distribution of those means you will get a consistent distribution that has the following characteristics:

4
Characteristics of a Sampling Distribution 1. the distribution approximates a normal curve 2. the mean of a sampling distribution of means is equal to the true population 3. the standard deviation of a sampling distribution is smaller than the standard deviation of the population. Less variation in the distribution because we are not dealing with raw scores but rather central tendencies.

5
Probability and the Normal Curve In chapter 6 – we are not interested in the distribution of raw scores but rather the distribution of sample means and making probability statements about those sample means.

6
Probability and the Sampling Distribution Why is making probabilistic statements about a central tendency important? 1. it will allow us to engage in inferential statistics (later in ch. 7) 2. it allows us to produce confidence intervals
 2. it allows us to produce confidence intervals.")
7
Example of number 1: President of UNLV states that the average salary of a new UNLV graduate is $60,000. We are skeptical and test this by taking a random sample of a 100 UNLV students. We find that the average is only $55,000. Do we declare the President a liar?

8
Not Yet!!!! We need to make a probabilistic statement regarding the likelihood of Harter’s statement. How do we do that? With the aid of the standard error of the mean we can calculate confidence intervals - the range of mean values within with our true population mean is likely to fall.

9
How do we do that? First, we need the sample mean Second, we need the standard deviation of the sampling distribution of means (what’s another name for this?) a.k.a standard error of the mean
 a.k.a standard error of the mean.")
10
What’s the Problem? The problem is… We don’t have the standard deviation of the sampling distribution of means? What do we do?

11
First – let’s pretend Let’s pretend that I know the Standard Deviation of the Sampling Distribution of Means (a.k.a. the standard error of the mean). It’s 3000 For a 95% confidence interval we multiply the standard error of the mean by 1.96 and add & subtract that product to our sample mean Why 1.96?
. It’s 3000 For a 95% confidence interval we multiply the standard error of the mean by 1.96 and add & subtract that product to our sample mean Why")
13
So is the President Lying? CI = Mean + or – 1.96 (SE) = 55,000 +/- 1.96 (3000) = 55,000 +/- 5880 = $49,120 to 60,880
 = 55,000 +/ (3000) = 55,000 +/ = $49,120 to 60,880.")
14
Estimating the SE We Can Estimate the Standard Error of the Mean. –Divide the standard deviation of the sample by √n-1 –For example a sample standard deviation of 29849 would produce a estimate of the SE of around 3000 [29849 divide by √n-1] [remember n = 100] Then multiply this estimate by t rather than 1.96 and then add this product to our sample mean. Why t?

15
The t Distribution Empirical testing and models shows that a standard deviation from a sample underestimates the standard deviation of the true population This is why we use N-1 not N when calculating the standard deviation and the standard error So in reality, we are calculating t-scores, not z-scores since we are not using the true sd.

16
So when we are using a sample and calculating a 95% confidence interval (CI) we need to multiply the standard error by t, not 1.96 How do we know what t is? Table in back of book (Appendix C; Table C) Df = N – 1 100-1 = 99; Use the df of 60 and level of significance of.05 (why?) T = 2
 Df = N – = 99; Use the df of 60 and level of significance of.05 (why ) T = 2.")
17
Confidence Intervals for Proportions Calculate the standard error of the proportion: Sp = 95% conf. Interval = P +/- (1.96)S p
S p.")
18
Example National sample of 531 Democrats and Democratic-leaning independents, aged 18 and older, conducted Sept. 14-16, 2007 Clinton 47%; Obama 25%; Edwards 11% P(1-P) =.47(1-.47) =.47(.53) =.2491 Divide by N =.2491/531 =.000469 Take square root =.0217 95% CI =.47 +/- 1.96 (.0217).47 +/-.04116 or 0.429 to.511
 =.47(1-.47) =.47(.53) =.2491 Divide by N =.2491/531 = Take square root = % CI =.47 +/ (.0217).47 +/ or to.511.")
Similar presentations


, © 2005 Prentice Hall Chapter 6 Hypothesis Tests with Means.>")


