Download presentation
Presentation is loading. Please wait.

1
Indifference Curve Analysis 1. Develop indifference curves 2. Develop budget constraint 3. Some basic analysis: a. changes in prices; b. changes in income; c. the Engels Curve 4. The Food Stamps Problem

2
Indifference curve: A collection of points for which the consumer is indifference between each of them and some reference point. Typically shown in the context of a two good world on a two-dimensional graph.

4
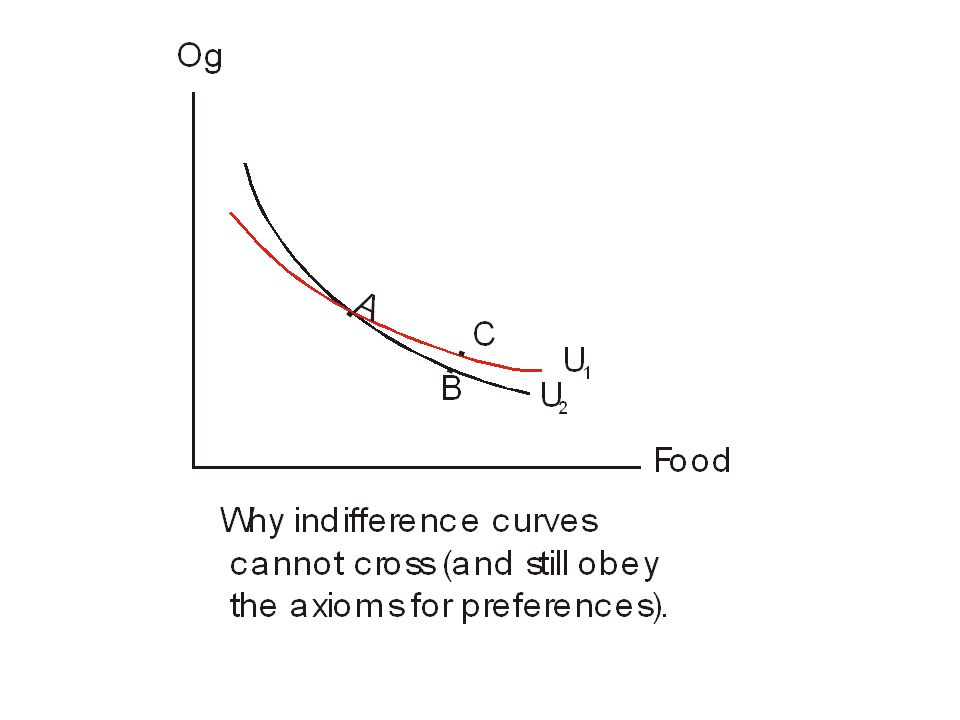
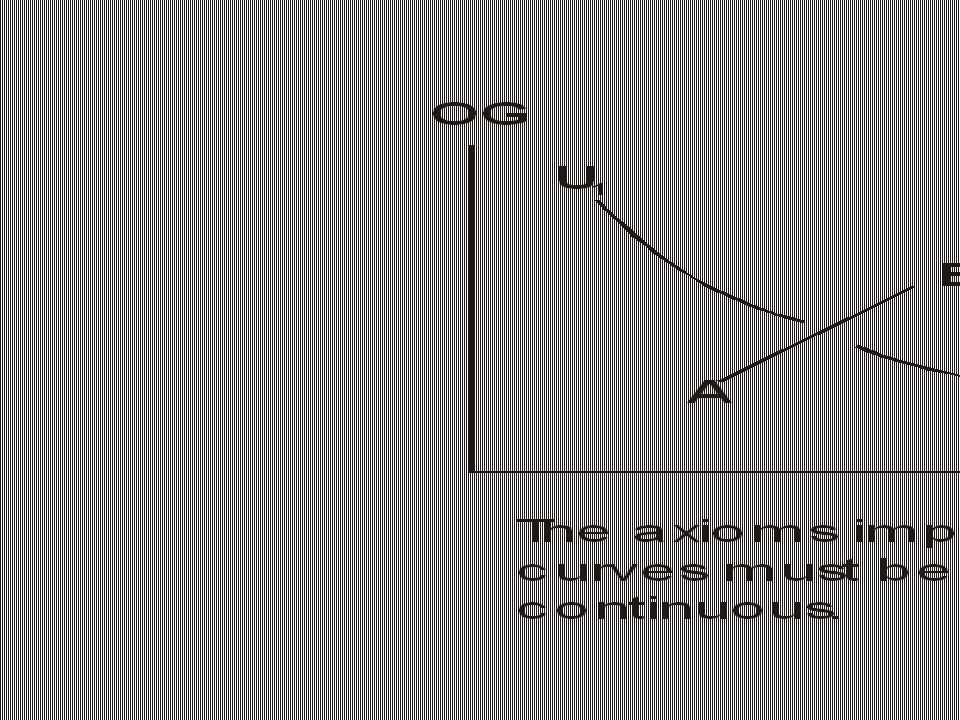
The axiomatic approach to indifference curves is a search for a minimum set of assumptions regarding consumer behavior through which to generate indifference curves. Standard axioms: 1.More is preferred to less—nonsatiation 2.Completeness—all points in a relation 3.Transitivity– A B; B C; A C

7
These two sets of indifference curves represent people who differ in their relative willingness to trade food for medicine. Which one is hungry? Careful.

8
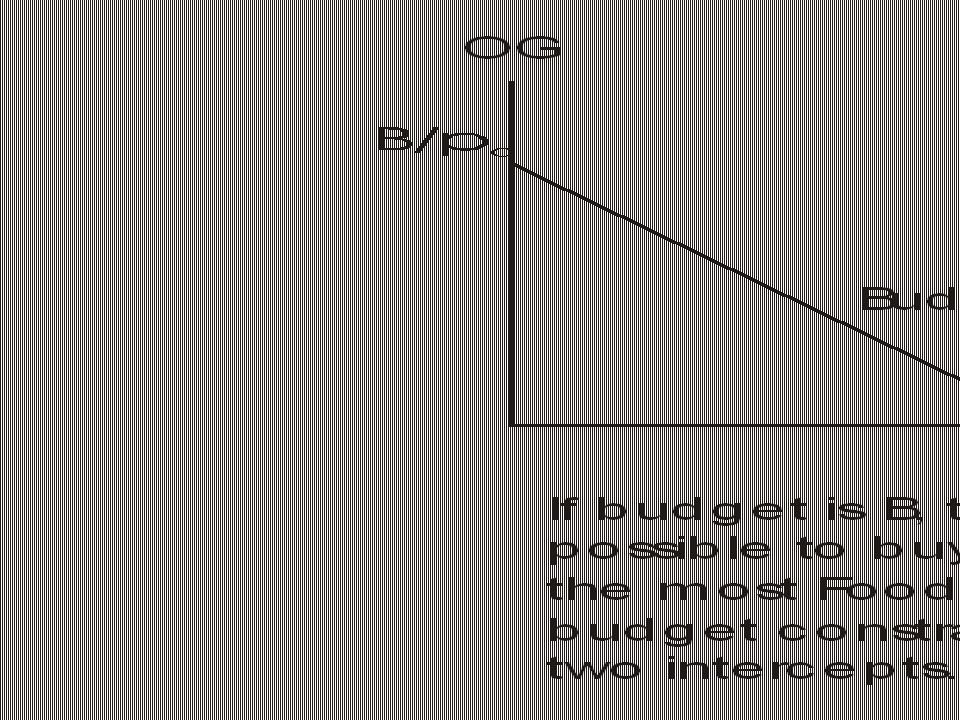
The budget equation: B = p og OG + p f F OG = B/p og – p f /p og F Meaning: The budget equation will depict a curve in OG-Food space that is downward sloping (note: its derivative –p f /p og is negative).
.")
11
Applying calculus to find an expression for the slope of the other curve, the indifference curve: OG/ F = - ( U/ F) /( U/ OG) or, using an equivalent notation: OG/ F = - MU f / MU og
 /( U/ OG) or, using an equivalent notation: OG/ F = - MU f / MU og")
12
At an equilibrium, tangency implies that the slope of the budget constraint equals the slope of the indifference curve: Hence,

13
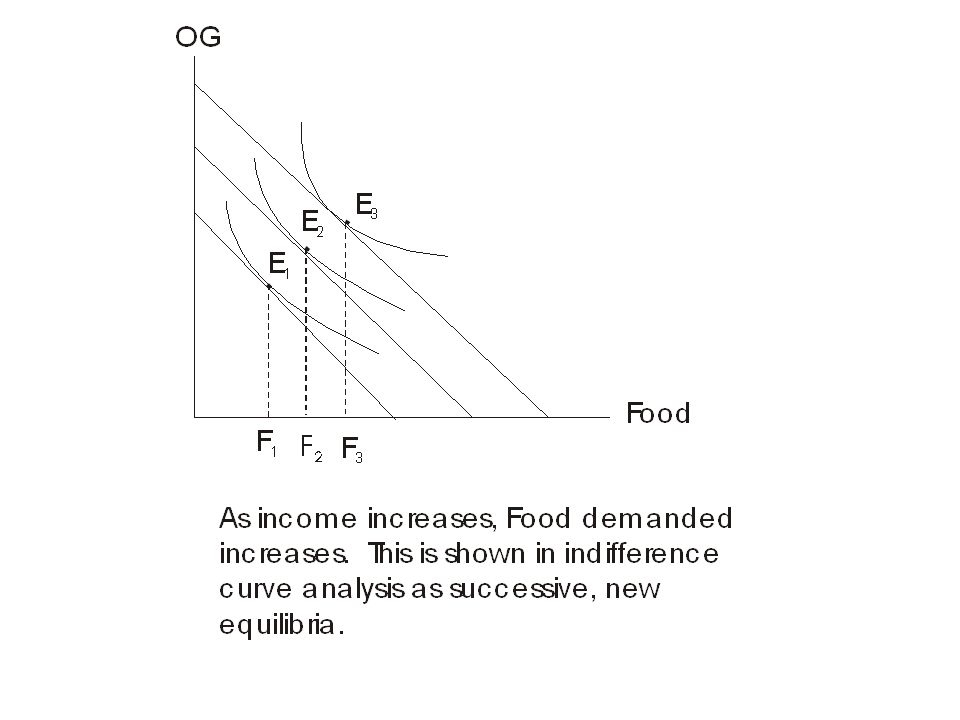
Consumer equilibrium requires that p f /p og = MU f /MU og or MU f /p f = MU og /p og In words: The marginal utility per dollar of expenditure must be equal for each good.

17
End of the portion prior to the Group project on the Food Stamps Problem.

22
Discussion Questions: 1.Would this analysis make good policy? 2.What do we know about the behavior of the poor and how do we know this? 3.If we would say that giving cash would make bad policy, is one’s criticism based on an efficiency argument? An equity argument? A paternalistic argument?

Similar presentations


 Evaluation of alternative consumption bundles.>")
