Download presentation
Presentation is loading. Please wait.

1
Model SEDs of Massive YSOs Barbara Whitney, Tom Robitaille, Remy Indebetouw, Kenny Wood, and Jon Bjorkman

2
Do we need 2-D, 3-D models? 1-D2-D3-D It depends…

3
Do we need 2-D, 3-D models? >100 m: no <100 m: yes Extremely young sources: maybe not (Osorio et al. 1999) (van der Tak et al. 2000)
 (van der Tak et al. 2000).")
4
Low-Mass example: IRAS 04302+2247 L=0.5 L sun NIR 3-color (Padgett et al. 1999) 2-D RT models
 2-D RT models")
5
Outline 2-D SED models –Rotationally flattened envelopes, disks, bipolar cavities 3-D SED models –Clumpy molecular clouds Model grid and fitter Focus on NIR/MIR spectra –Lots of new data in this region (Spitzer) –1-D models work fine for FIR/submm (Hatchell et al. 2000, Buether et al. 2002, Mueller et al. 2002, Hatchell & van der Tak 2003, Williams et al. 2005)
.")
6
Radiative Transfer Models Monte Carlo method 3-D spherical polar grid Calculates radiative equilibrium of dust (Bjorkman & Wood 2001) Non-isotropic scattering + polarization Output: images + SEDs (+ polarization) Not included: PAHs, stochastic heating of small grains, optically thick gas emission (Whitney et al. 2003a,b, 2004)
.")
7
2-D YSO Model Geometry Rotationally-flattened infalling envelope (Ulrich 1976) Flared disk Partially evacuated outflow cavity
 Flared disk Partially evacuated outflow cavity")
8
Some Model SEDs High luminosity (high mass) protostar –Tstar=30000 –Tstar=4000 High luminosity star+disk –Tstar=30000 Low luminosity (M0) protostar –Tstar=4000 Low-luminosity star+disk –Tstar=4000
 protostar –Tstar=30000 –Tstar=4000 High luminosity star+disk –Tstar=30000 Low luminosity (M0) protostar –Tstar=4000 Low-luminosity star+disk –Tstar=4000")
9
L * =40000 T * =4000 M * =17.5 M=10 -4 M d =1 Embedded Massive YSO iAvAv 06 6053 903e4.

10
Embedded Massive YSO - No Cavity iAvAv 045 6068 903e4 L * =40000 T * =4000 M * =17.5 M=10 -4 M d =1.

11
Embedded Massive YSO iAvAv 06 6053 903e4 L * =40000 T * =30000 M * =17.5 M=10 -4 M d =1.

12
Embedded Low-Mass YSO iAvAv 06 6050 904e6 L * =1.1 T * =4000 M * =1 M=10 -5 M d =0.05.

13
Massive Star+Disk iAvAv 00 600.1 903e3 L * =40000 T * =30000 M * =17.5 M d =0.1

14
Low-Mass Star + Disk iAvAv 00 600.1 903e5 L * =40000 T * =4000 M * =17.5 M d =0.01

15
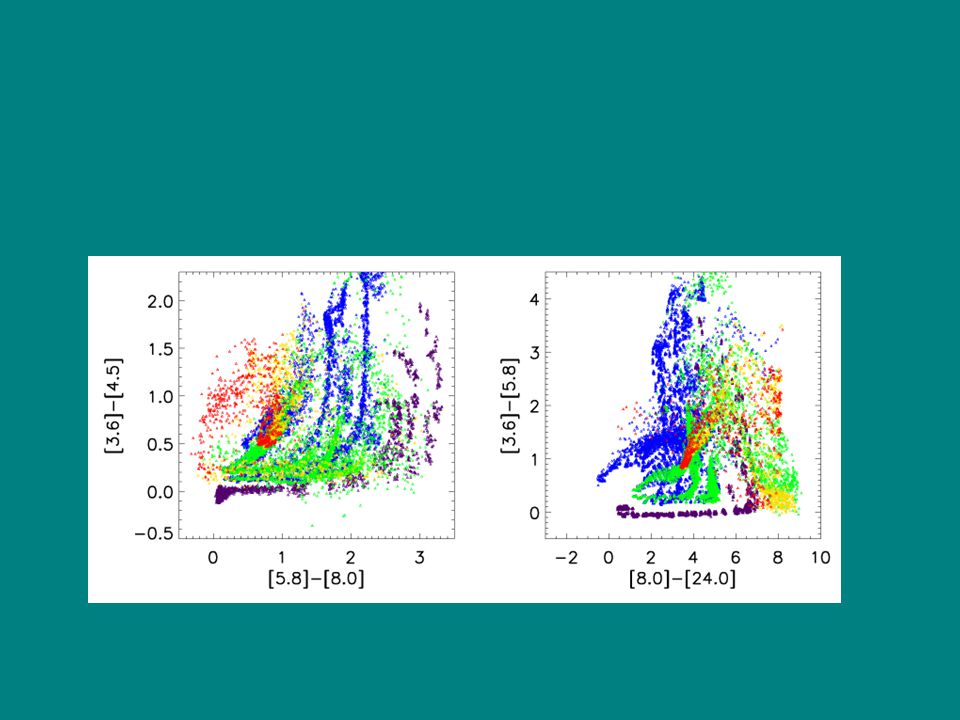
Color-color plots (Spitzer IRAC) o High-mass YSO X High-mass disk o Low-mass YSO x Low-mass Disk Allen et al (2004) disk domain T * =30000 K T * =4000 K Reddening Vectors: A V =30
 o High-mass YSO X High-mass disk o Low-mass YSO x Low-mass Disk Allen et al (2004) disk domain T * =30000 K T * =4000 K Reddening Vectors: A V =30")
16
RCW 49 - Giant H II Region (GLIMPSE)
")
17
Summary of 2-D models Central star + disk spectrum contributes to SED, even in young embedded sources in 2-D geometries. Massive sources are redder in 3-8 m region than low-mass even for the same envelope Av.

18
3-D models Motivation –UCHII regions: 1-D models of mid-IR spectra give too deep 10 m absorption for a given FIR flux, and too steeply rising SED in NIR/MIR (Faison et al. 1998, van der Tak et al. 2000)
.")
19
Example SEDs Faison et al. 1998

20
Model Ingredients O star in a molecular cloud Use fractal ISM structure, D=2.6 (Elmegreen 1997) Average radial density profile is varied from r 0 to r -2.5 Smooth-to-clumpy ratio is varied from 3% to 100% (Indebetouw et al. 2005)
.")
21
Temperature and density in an azimuthal slice

22
Courtesy of Remy Indebetouw IRACMIPS Images & Spectra NIR

23
Clumpy model SEDs Average Smooth (1-D) model 200 sightlines from 1 source (grey lines)
 model 200 sightlines from 1 source (grey lines)")
24
Color-color plots Smooth model 200 sightlines from 1 clumpy model

25
Fits to Data: G5.89-0.39 Best smooth model Best clumpy model Grey lines show other sight lines Mid-IR data: Faison et al. (1998)
.")
26
G5.89 Model parameters T star 41000 K L2.54x10 5 R in 0.0001 pc R out 2.5 pc M env 50000 A v_ave 131 Smooth/Clumpy10% Radial density ave ~r 0 Fractal dimension2.6

27
Best fit for smooth-to-clumpy ratio = 0.03

28
Best fit for smooth-to-clumpy ratio = 0.6

29
Best fit for average radial density ~ -1

30
All the UCHII Observations Grey lines: G5.89 best model Mid-IR data: Faison et al. (1998)
")
31
3-D Model summary UCHII regions may be O-B stars still embedded in their natal molecular clouds but not surrounded by infalling envelopes. Bolometric flux of clumpy models varies by a factor of 2 lower and higher than the true luminosity depending of viewing angle (Indebetouw et al. 2005)
.")
32
2-D/3-D Model grid + Data fitter Motivation: fitting GLIMPSE/2MASS data (7 bands from 1-8 m) of the inner galactic plane. (see Indebetouw talk). GLIMPSE has observed hundreds of massive star formation regions. –24 m data will be available in the future (Robitaille et al. 2005)
. GLIMPSE has observed hundreds of massive star formation regions. –24 m data will be available in the future (Robitaille et al. 2005).")
33
Grid Parameters (current) Stellar Mass0.1-40 M sun Stellar Age10 4 -10 7 yrs Envelope Infall Rate10 -4 -10 -9 M sun /yr*M star Disk Mass10 -1 -10 -8 M sun *M star Disk Radius10-1000 AU Cavity Size10-50 degrees Aperture1000, 5000, 20000 AU Viewing Angles10 1600 models completed in 2 weeks on 8 Mac G5 processors
 Stellar Mass M sun Stellar Age yrs Envelope Infall Rate M sun /yr*M star Disk Mass M sun *M star Disk Radius AU Cavity Size10-50 degrees Aperture1000, 5000, AU Viewing Angles models completed in 2 weeks on 8 Mac G5 processors")
34
Evolutionary Stages* Embedded YSOs:M dot /M star > 5x10 -7 M sun /yr Opaque disks:M dot /M star 5x10 -5 M sun Low-mass disks:M disk /M star < 5x10 -5 M sun *Somewhat arbitrarily defined

37
Model grid: All Embedded YSOs < 2 Msun 2 < Msun < 5 > 5 Msun

38
All Disk (opaque) Sources < 2 Msun 2 < Msun < 5 > 5 Msun Disks with Inner holes Allen et al. Disk domain

39
All Disk (optically thin) Sources < 2 Msun 2 < Msun < 5 > 5 Msun Disks with Inner holes Allen et al. Disk domain

40
Embedded YSOs - 4 kpc* < 2 Msun 2 < Msun < 5 > 5 Msun *Assuming GLIMPSE sensitivities

41
Opaque Disks - 4 kpc < 2 Msun 2 < Msun < 5 > 5 Msun Inner holes Allen et al. Disk domain

42
Optically thin disks - 4 kpc < 2 Msun 2 < Msun < 5 > 5 Msun Inner holes Allen et al. Disk domain

43
All Sources - 4 kpc Embedded YSO Opaque disks Thin disks High mass YSOs; and disks with inner holes High mass (opaque and thin) Disks with inner holes Embedded YSO and disks with no inner holes Embedded YSOs and reddened Disks
 Disks with inner holes Embedded YSO and disks with no inner holes Embedded YSOs and reddened Disks")
44
Fitter Description Uses linear regression to determine best fit to data Convolves models with any desired filter functions Distance and extinction range can be specified Designed to work with large numbers of sources –Fits 100 sources per second Produces statistics on quality and fit parameters (Robitaille et al. 2005)
.")
45
Tests on Taurus Sources Class I Class III Class I Class II FF Tau L1551 IRS5 DI Tau FF Tau

46
Tests on M16 data EmbeddedDiskEmbedded or disk

47
Future work Expand grid –More variations in model parameters –Add 3-D clumpy models –Use info from recent work (e.g., disks: Beuther et al. 2004, Beltran et al. 2005 theory: McKee & Tan 2003), this meeting, and models of individual sources More testing of Model Fitter Make grid & fitter publicly accessible with batch jobs (web access) RT: –add PAHs and stochastic heating of small grains –Multiple emission sources
, this meeting, and models of individual sources More testing of Model Fitter Make grid & fitter publicly accessible with batch jobs (web access) RT: –add PAHs and stochastic heating of small grains –Multiple emission sources.")
Similar presentations


Disks and high-mass star formation: existence and implications 2)The case of G31.41+0.31: characteristics 3)Velocity field in G31.41: rotation or expansion?>")
 Rene Oudmaijer (Leeds) Melvin Hoare (Leeds) Hugh Wheelwright.>")

 Todd Hunter (NRAO/North American ALMA Science Center) Collaborators: Crystal Brogan (NRAO) Ken.>")
 Paul T. P. Ho (CfA),>")


 star formation has improved greatly.>")

 dust emissivity model; only very strong (> 10 3 x avg.) radiation fields contribute.>")
 Tom Megeath (Univ. of Toledo) from Peterson et al. 2007:>")

 ABSTRUCT We have made self-consistent models of the.>")
 23.4 Physical processes, heating and cooling.>")

 Prof. Dr. C. Waelkens (KUL) Academic year 2014-2015.>")