Download presentation
Presentation is loading. Please wait.

1
Bacterial Cell Division
CHAPTER 6 Microbial Growth Bacterial Cell Division Microbial growth involves an increase in the number of cells. Growth of most microorganisms occurs by the process of binary fission.

2
Prokaryotic cell division
by binary fission

3
Fts Proteins, the Cell Division Plane, and Cell Morphology
Cell division and chromosome replication are coordinately regulated, and the Fts proteins are the keys to these processes. Fts proteins interact to form a division apparatus in the cell called the divisome.

4
Rod shaped cells, FtsZ forms a ring around the cell cylinder in the center of the cell and defines the division plane. In E. coli ~10,000 FtsZ polymerize to form the ring. The FtsZ ring attracts other cell division proteins, FtsA and ZipA. FtsA is a an ATPase ZipA is an anchor that attaches the FtsZ ring to the cytoplasmic membrane FtsI is involved in peptidoglycan synthesis and is inhibited by penicillin. FtsK assists in chromosome separation

5
FtsK assists in chromosome separation FtsA is an ATPase
FtsI is peptidoglycon biosynthesis protein ZipA is an FtsZ anchor FtsK assists in chromosome separation FtsA is an ATPase

6
Appearance and breakdown of FtsZ during cell cycle
Phase contrast nucleoid stain Anti-FtsZ Nucleoid stain and specific Ftsz stain

7
Other proteins in prokaryotic cell division
MinC and MinE assist FtsZ MinC is an inhibitor of cell division and prevents the FtsZ ring formation until precise center has been found. MinE is inhibitor of MinC Cell Shape Mre proteins help define cell shape. MreB is a tubulin and actin like protein MreB is present in rod shaped but not coccus-shaped cells

8
Peptidoglycan Synthesis and Cell Division
New cell wall is synthesized during bacterial growth by inserting new glycan units into preexisting wall material (Figure 6.3). After FtsZ ring formation, autolysin (lysozyme like) creates small openings in the cell wall. New cell wall material is then added across the openings.
. After FtsZ ring formation, autolysin (lysozyme like) creates small openings in the cell wall. New cell wall material is then added across the openings.")
10
A process of spontaneous cell lysis called autolysis can occur unless new cell wall precursors are spliced into existing peptidoglycan to prevent a breach in peptidoglycan integrity at the splice point. A hydrophobic alcohol called bactoprenol (C55 alcohol) bonds with peptidoglycan precursors and transport them across the membrane into preplasmic membrane. New glycan units then become part of the growing cell wall (Figure 6.4).
 bonds with peptidoglycan precursors and transport them across the membrane into preplasmic membrane. New glycan units then become part of the growing cell wall (Figure 6.4).")
11
Bactoprenol – highly hydrophobic carries cell wall peptidoglycan precursor through the cytoplasmic membrane

12
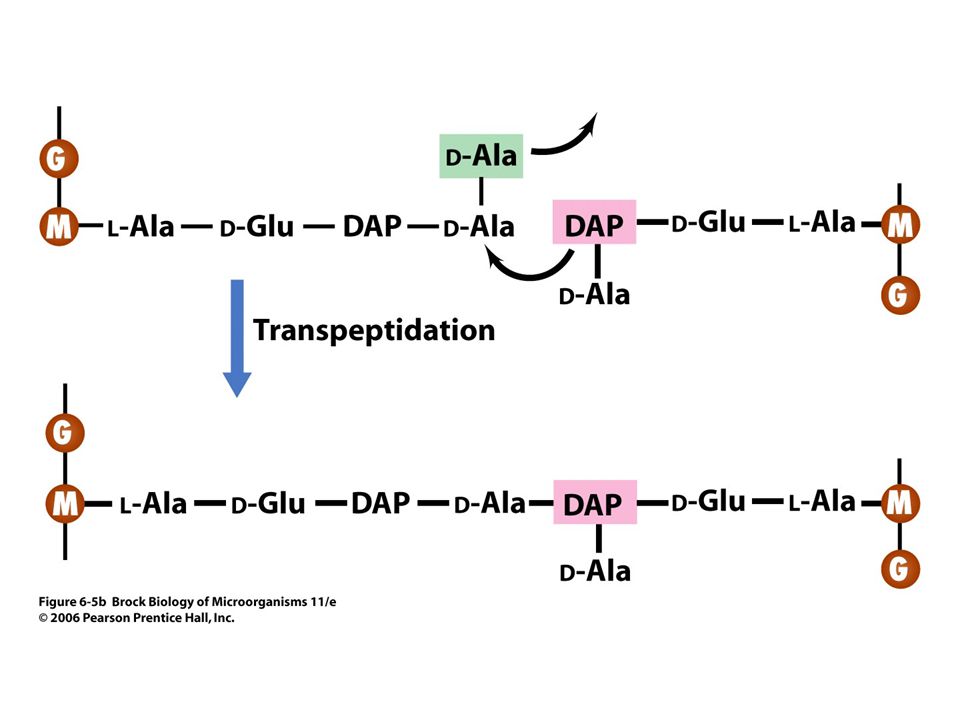
Transpeptidation bonds the precursors into the peptidoglycan fabric (Figure 6.5).
.")
13
Peptidoglycon synthesis

15
Growth of Bacterial Populations
Microbial populations show a characteristic type of growth pattern called exponential growth, which is best seen by plotting the number of cells over time on a semilogarithmic graph (Figure 6.6).
.")
16
Rate of growth of a microbial culture

18
The Mathematics of Exponential Growth
Exponential Growth: N = N02n initial (N0) final (N) cell numbers the number of cell generations (n) Generation times (g) = t/n number of generation (n) in time (t)
 final (N) cell numbers. the number of cell generations (n) Generation times (g) = t/n. number of generation (n) in time (t)")
19
A Typical Growth Curve

20
There is usually a lag phase, then exponential growth commences
There is usually a lag phase, then exponential growth commences. As essential nutrients are depleted or toxic products build up, growth ceases, and the population enters the stationary phase. If incubation continues, cells may begin to die (the death phase).
.")
21
Measuring Microbial Growth, Direct Measurements of Microbial Growth: Total and Viable Counts
Growth is measured by the change in the number of cells over time. Cell counts done microscopically (Figure 6.9) measure the total number of cells in a population, whereas viable cell counts (plate counts) (Figures 6.10, 6.11) measure only the living, reproducing population.
 measure the total number of cells in a population, whereas viable cell counts (plate counts) (Figures 6.10, 6.11) measure only the living, reproducing population.")
22
Microscopic counting procedure using the Petroff-Hausser counting chamber

23
Viable cell counting

24
Viable cell count using serial dilution

25
Plate counts can be highly unreliable when used to assess total cell numbers of natural samples such as soil and water. Direct microscopic counts of natural samples typically reveal far more organisms than are recoverable on plates of any given culture medium.

26
This is referred to as "the great plate count anomaly," and it occurs because microscopic methods count dead cells whereas viable methods do not, and different organisms in even a very small sample may have vastly different requirements for resources and conditions in laboratory culture.

27
Indirect Measurements of Microbial Growth: Turbidity
Turbidity measurements are an indirect but very rapid and useful method of measuring microbial growth (Figure 6.12). However, to relate a direct cell count to a turbidity value, a standard curve must first be established.
. However, to relate a direct cell count to a turbidity value, a standard curve must first be established.")
28
Turbidity measurement using spectrophotometer

31
Continuous Culture: The Chemostat
Continuous culture devices (chemostats) (Figure 6.13) are a means of maintaining cell populations in exponential growth for long periods.
 (Figure 6.13) are a means of maintaining cell populations in exponential growth for long periods.")
32
Continuous cell culture using a chemostat

33
In a chemostat, the rate at which the culture is diluted governs the growth rate and growth yield (Figure 6.14).
.")
35
The population size is governed by the concentration of the growth-limiting nutrient entering the vessel (Figure 6.15).
.")
37
Environmental Effects on Microbial Growth Effect of Temperature on Growth
Temperature is a major environmental factor controlling microbial growth. The cardinal temperatures are the minimum, optimum, and maximum temperatures at which each organism grows (Figure 6.16).
.")
39
Microorganisms can be grouped by the temperature ranges they require (Figure 6.17).
.")
40
Mesophiles, which have midrange temperature optima, a re found in warm-blooded animals and in terrestrial and aquatic environments in temperate and tropical latitudes. Extremophiles have evolved to grow optimally under very hot or very cold conditions.

41
Microbial Growth at Cold Temperatures
Organisms with cold temperature optima are called psychrophiles, and the most extreme representatives inhabit permanently cold environments. Psychrophiles have evolved biomolecules that function best at cold temperatures but that can be unusually sensitive to warm temperatures. Organisms that grow at 0ºC but have optima of 20ºC to 40ºC are called psychrotolerant.

42
Microbial Growth at High Temperatures
Organisms with growth temperature optima between 45ºC and 80ºC are called thermophiles, and those with optima greater than 80°C are called hyperthermophiles. These organisms inhabit hot environments up to and including boiling hot springs, as well as undersea hydrothermal vents that can have temperatures in excess of 100ºC.

43
Thermophiles and hyperthermophiles produce heat-stable macromolecules, such as Taq polymerase, which is used to automate the repetitive steps in the polymerase chain reaction (PCR) technique.
 technique.")
44
Table 6.1 shows upper temperature limits for growth of living organisms.

45
Environmental Effects on Microbial Growth: pH, Osmolarity, and Oxygen,
The acidity or alkalinity of an environment can greatly affect microbial growth.

46
Figure 6.22 shows the pH scale.

47
Some organisms have evolved to grow best at low or high pH, but most organisms grow best between pH 6 and 8. The internal pH of a cell must stay relatively close to neutral even though the external pH is highly acidic or basic. Organisms that grow best at low pH are called acidophiles; those that grow best at high pH are called alkaliphiles.

48
Osmotic Effects on Microbial Growth
Water activity becomes limiting to an organism when the dissolved solute concentration in its environment increases. At high solute conc. water activity decreases

50
Some microorganisms (halophiles) have evolved to grow best at reduced water potential, and some (extreme halophiles) even require high levels of salts for growth. Halotolerant organisms can tolerate some reduction in the water activity of their environment but generally grow best in the absence of the added solute (Figure 6.23).
.")
52
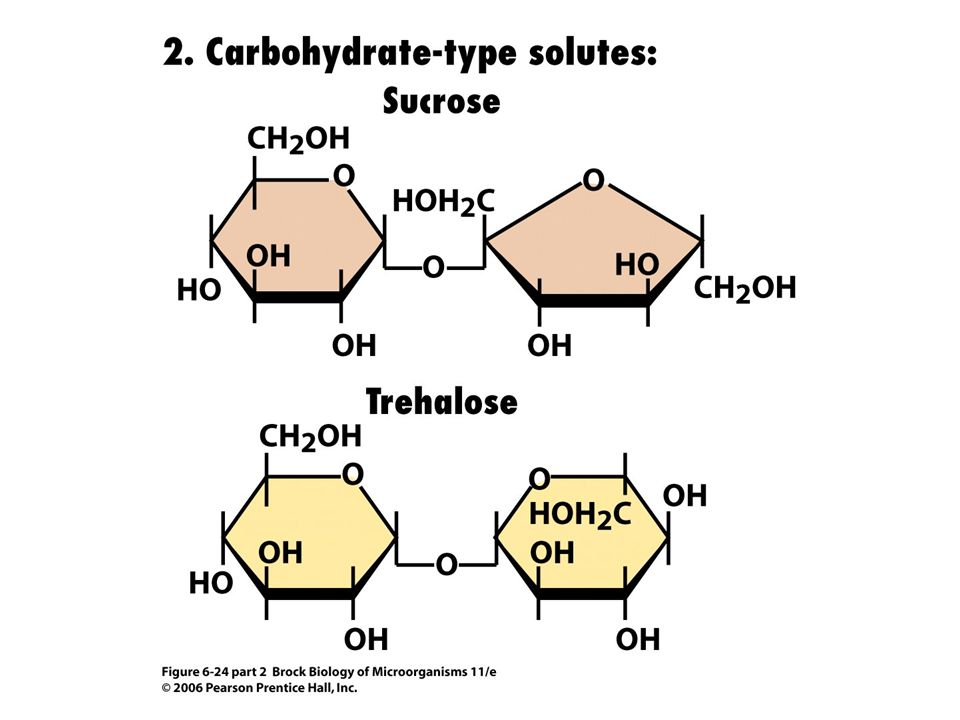
Xerophiles are able to grow in very dry environments.
Water activity becomes limiting to an organism when the dissolved solute concentration in its environment increases. To counteract this situation, organisms produce or accumulate intracellular compatible solutes (Figure 6.24; Table 6.3) that maintain the cell in positive water balance.
 that maintain the cell in positive water balance.")
53
Soluble solutes in microorganisms

57
Oxygen and Microbial Growth
Table 6.4 shows the relationships of some microorganisms to oxygen.

58
Aerobes require oxygen to live, whereas anaerobes do not and may even be killed by oxygen.
Facultative organisms can live with or without oxygen. Aerotolerant anaerobes can tolerate oxygen and grow in its presence even though they cannot use it. Microaerophiles are aerobes that can use oxygen only when it is present at levels reduced from that in air.

59
A reducing agent such as thioglycolate can be added to a medium to test an organism's requirement for oxygen (Figure 6.25).
.")
61
Special techniques are needed to grow aerobic and anaerobic microorganisms

63
Toxic Forms of Oxygen Several toxic forms of oxygen can be formed in the cell, but enzymes are present that can neutralize most of them (Figure 6.28). Superoxide in particular seems to be a common toxic oxygen species.
. Superoxide in particular seems to be a common toxic oxygen species.")
Similar presentations


>")
 Lecture 4 Nutrition and Growth (Text Chapters: 5.1-5.3; 6.1; 6.4-6.8; 6.10-6.15)>")


 Microbes obtain nutrients.>")
 Exercise 9: Aseptic Technique>")