Download presentation
Presentation is loading. Please wait.

1
C ombined A erosol T rajectory T ool, CATT Transport Analyzer for RPO Analysts R. B. Husar and K. Höijärvi, Washington University, St. Louis R.L. Poirot, Vermont DEC AP, Waterbury, Vermont S. Kayin, MARAMA, Baltimore, K.A. Gebhart, B.A. Schichtel, W.C. Malm NPS/ CIRA, Fort Collins AWMA, Asheville, NC October 26, 2004 Trajectory BrowserKitty: Simple CATT CATT Transport Analyzer

2
Next Process Why? How? When? Where? CATT: A Community Tool! Part of an Analysis Value Chain Aerosol Data Collection IMP. EPA Aerosol Sensors Integration VIEWS Integrated AerData AEROSOL Weather Data Assimilate NWS Gridded Meteor. Trajectory ARL Traject. Data TRANSPORT TrajData Cube Aggreg. Traject. AerData Cube CATT Aggreg. Aerosol CATT-In CAPITA There! Not There! Further Analysis GIS Grid Processing Emission Comparison

3
Scientist Science AQS Current info systems are project/program oriented and provide end-to-end solutions Info UsersData ProvidersInfo System AIRNow Public VIEWS Traj Compliance Manager ‘Stovepipe’ and Federated Usage Architectures Landscape Part of the data resources of any project can be shared for re-use through DataFed Through the Federation, the data are homogenized into multi-dimensional cubes Data processing and rendering can then be performed through web services Each project/program can be augmented by Federation data and services

4
Acknowledgements The CATT Tool is the result of an effective CIRA-CAPITA collaboration to create a sequential value-adding chain. CIRA has opened the VIEWS and the ATAD databases for use by CAPITA. In fact the current CATT ensemble trajectory browser is accessing the VIEWS database for chemical data in real time! CAPITA added the trajectory browser code and the user interface. The result is a textbook illustration of the new distributed computing paradigm! It is hoped that the values that the CATT project added to the chain will be accessed and utilized by others and continue the value-adding process. The opportunities for mutual empowerment are truly endless The functionality of CATT was strongly influenced by the dynamic infusion of ideas from Rich Poirot. Beyond setting the initial goal of the CATT-Tool project, he also supplied continuous feedback on both the initial CATT design as well as on other features that we have added for our own reasons. Serpil Kayin of MARAMA made sure that we actually finished this un-finishable 'project'. The entire DataFed/CATT code was written by Kari Höijärvi of CAPITA

5
CATT Components Trajectory Aggregator Tool (TAT). Receives date-location pairs Performs the trajectory extraction Aggregation (e.g. residence time) Outputs spatial transport pattern Chemical Filter Tool (CFT). Queries to chemical data sets. Outputs “qualified” date-location pairs. Chemical Filter Tool Trajectory Aggregator Tool
 Outputs spatial transport pattern Chemical Filter Tool (CFT). Queries to chemical data sets. Outputs qualified date-location pairs. Chemical Filter Tool Trajectory Aggregator Tool.")
6
Kitty – Simple CATT All the VIEWS chemical parameters available for filtering Guadalupe Soilf > 5

7
Fine SOIL transport at decreasing concentration limit Weight by 1 Calc high Percent days Dust > 30 ug/m3 Dust > 1.8 ug/m3Dust > 3.7 ug/m3Dust > 1.8 ug/m3 Dust > 15 ug/m3Dust > 7.5 ug/m3

8
Origin of Sodium (Sea Salt): Oceans
: Oceans")
11
Incremental Transport Probability Analysis (Poirot) Red - regions of high transport probability Blue - regions of low transport probability Upper Buffalo IMPROVE Site Backtrajectories for top 10 percentile Soil, Jun, Jul, Aug Backtrajectories for all days, Jun, Jul, Aug Incremental Transport Probability, Jun, Jul, Aug 1.Trajectories for top 10 percent SOILf are calculated 2.Trajectories for all days are calculated 3.Trajectory endpoints gridded A B (A-B)
 Red - regions of high transport probability Blue - regions of low transport probability Upper Buffalo IMPROVE Site Backtrajectories for top 10 percentile Soil, Jun, Jul, Aug Backtrajectories for all days, Jun, Jul, Aug Incremental Transport Probability, Jun, Jul, Aug 1.Trajectories for top 10 percent SOILf are calculated 2.Trajectories for all days are calculated 3.Trajectory endpoints gridded A B (A-B)")
12
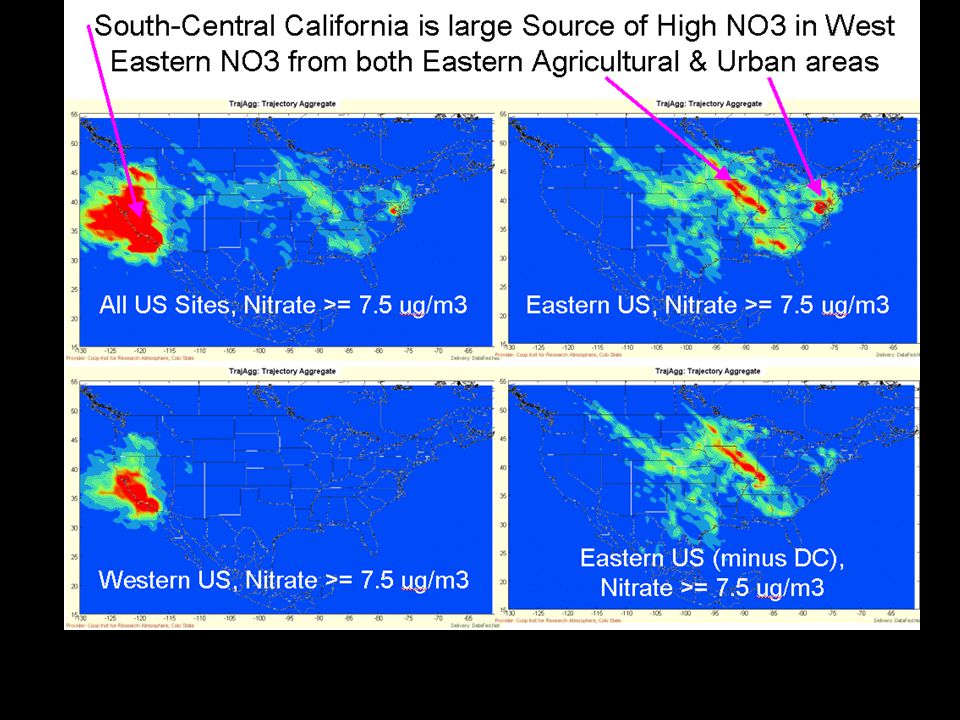
Big Bend Incremental Probability Maps Upper 10 percentile, Big Bend, Jun, Jul Aug Incremental Transport for Big Bend indicate southerly transport of species, except sulfate Conspicuously, in the summer, nitrate is also transported from the south PMFineammSO4 SOILf OCfECfammNO3

13
Brigantine Incremental Probability Maps Upper 10 percentile, Brigantine, Jun, Jul Aug Incremental Transport Probabilities for Brigantine indicate westerly transport of species Soil is preferentially transported from southwest; nitrate is transported from the northwest PMFine ammSO4 SOILf OCfECfammNO3

14
CATT Status: Trajectory Browser, Aggregator, Kitty is functional now Full CATT ready for testing/tutorial/use in November CATT Future: Add Additional Ensemble Trajectory Metrics Update as new Traj & Aerosol data (Kristi Gebhart has just updated ATADs to 2003 Add more aerosol (STN) & trajectory data (Kristi cranked out ATADs for STN– triple site density)!! Continue cooperation of RPOs with & other DataFed.Net Partners (NSF, NASA, EPA, etc.)
.")
Similar presentations


 Nov 20, 2001, RBH St. Louis Midwest Supersite Project.>")
 –Real-time monitoring and data delivery (1 slide) –Characterization of pollutant in.>")


 CAPITA Web-based Tool for Ensemble Trajectory Analysis, MANE-VU & MW RPO funding support, Currently functional.>")
 to 1991-99 IMPROVE Aerosol Data from Brigantine.>")

