Download presentation
Presentation is loading. Please wait.

2
Metrics

3
Following a Recipe A Rocket to the Moon Raising a Child Formulae are critical and necessary Sending one rocket increases assurance that next will be ok High level of expertise in many specialized fields + coordination Rockets similar in critical ways High degree of certainty of outcome Optimism re results Formulae have only a limited application Raising one child gives no assurance of success with the next Expertise can help but is not sufficient Every child is unique Uncertainty of outcome remains Optimism re results ComplicatedComplex The recipe is essential Recipes are tested to assure replicability of later efforts No particular expertise; knowing how to cook increases success Recipes produce standard products Certainty of same results every time Optimism re results Simple

4
Model of the NHS as a system

5
Most Organizations Fail Average life of S&P firms has fallen from 65 years (1920 to 1930) to 12 years (2000). In the last 55 years only 17 firms survived the period, but all but 1 had a return on investment less than the overall market gain. It seems that companies either fail rapidly or, if successful, create an identity and lock into it. Usually, after some time as a successful company, performance weakens, the company is acquired or it simply ceases operation. Average Time in S&P List (Years) S&P = Standard & Poor’s. Source: Cranfield University School of Management. Graphic courtesy of Prof Peter M Allen, Complex Systems Research Centre, School of Management, Cranfield University. 60 50 40 30 20 10 19201940196019802000
 S&P = Standard & Poor’s. Source: Cranfield University School of Management. Graphic courtesy of Prof Peter M Allen, Complex Systems Research Centre, School of Management, Cranfield University")
6
Evolution as creative destruction Paul Ormerond modelled the life expectancy of firms under different hypotheses about their capacity to learn. He found that the model that fits best corresponds to random extinction and very little learning. The good thing about markets is that they allow extinction Intelligence lies at the periphery; the role of hierarchy is different. Example: Infosys

14
Improving performance with TARGETS: Consider policemen attempting to improve their “performance” –Initially they just patrol randomly and stop and search people involved in suspicious behaviour –But how can we get better value for money? By formulating and acting on “theories” of who to target – we can avoid waste by focusing effort on the most likely sources of crime Policemen must therefore make a “conjecture” – and act on it AIMS and MOTIVATION Peter Allen, Cranfield

16
“Performance” measures are relaxed: Now we can check out how this works….. Let us look at the EXCEL program - Low Targeting Pink and Blue people are Equally suspect! Peter Allen, Cranfield

17
But under “performance pressure” - Policemen must “theorize” and target….. With random probability one population is revealed as criminal!!!!! Targeting parameter Peter Allen, Cranfield

18
Hey, WE are being targeted! It isn’t fair! Shall we: 1)Learn the National Anthem? 2)Beat up and steal from non-blue people Hey nobody ever checks up on us… We can make millions ENRON… Peter Allen, Cranfield
Beat up and steal from non-blue people Hey nobody ever checks up on us… We can make millions ENRON… Peter Allen, Cranfield.")
19
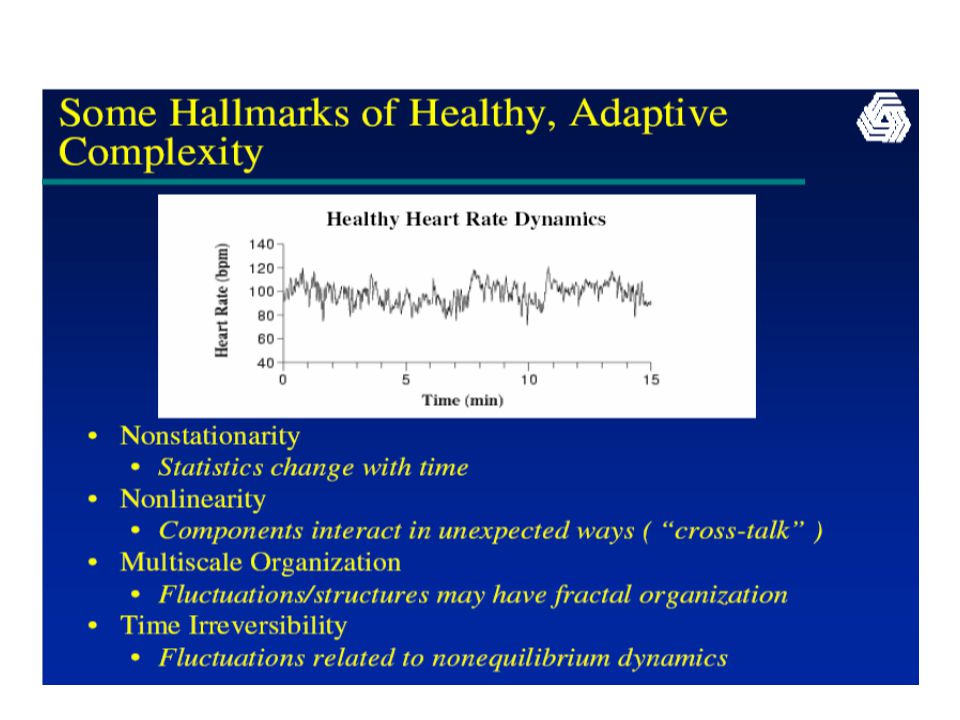
Is Your World Linear or Nonlinear? Linear Process: –Simple rules simple behaviors –Things add up –Proportionality of input/output –High predictability, no surprises Nonlinear Process: –Simple rules complex behaviors –Small changes may have huge effects –Low predictability & anomalous behaviors –Whole sum of parts (“emergent” properties) Ary Goldberger, Harvard
 Ary Goldberger, Harvard.")
20
Centre for Innovation in Health Management Is ‘IT’ Working? So – what’s healthy?

29
Ary Goldberger, Harvard 1) Which is the healthy signal? & 2) What is the clinical diagnosis in the other case?
 What is the clinical diagnosis in the other case .")
40
Centre for Innovation in Health Management Using Performance Management to foster Emergence -Working with your rules of thumb -Amplifying perspectives……

41
Centre for Innovation in Health Management Metrics Offer They can ‘sort’ Help understand perspective Generate understanding and responsibility Understand ‘better’ ‘improvement’ A way of judging/ taking decisions Explore what’s going on Uncover unpredictability and irregularity Rigour in working with ‘what is’ Conversations for possibility

42
Centre for Innovation in Health Management Challenges Metrics static Tempting to look for averages Designed from assumptions You need lots of data points Time matters How do you measure ‘connectedness’

43
Centre for Innovation in Health Management Fit For Purpose What is performance management for? What questions do you want the answers to/want to know about? What are we trying to measure? How can you measure/what can we do to measure the questions?

44
Centre for Innovation in Health Management Experimenting… What is the research question? Hypothesis? Or different type of question? If hypothesis need to prove or disprove for instance How could you ‘experiment’ to find the answer or knowledge? Observe, ask, conduct, get people to do ‘x’, discuss, try actual experiments or examples?

45
Centre for Innovation in Health Management Experimenting… Qualitative or quantitative data? How will you cluster or code the data/what will you do with the data? How will you get underneath the data? Ethics? Risks? Resources required? Stakeholders? Sign up? Timescales? (longitudinal, or short?) Critical appraisal ….
 Critical appraisal …..")
46
Centre for Innovation in Health Management Over to you … Fit for purpose? What is performance management for? What questions do you want the answers to/do you want to know about? What are you (and/or your organisation) ‘trying’ to measure? (what needs a metric?) How can you measure/what can you do to measure the questions themselves? Where do you already have data?
 ‘trying’ to measure. (what needs a metric ) How can you measure/what can you do to measure the questions themselves. Where do you already have data .")
47
Centre for Innovation in Health Management Peer Review – critical thinking and feeling as peers about : What are their questions like? Is it clear what is to be ‘measured’? Is it clear how they will ‘measure’? If you were set the task to go out and do the ‘work’ based on the questions and what’s to be measured – could you? Do you have enough information? Is it clear enough? Limitations? Analysis to avoid action?

Similar presentations


 stage of the public health nutrition (PHN) intervention.>")
 Homework 4 due Friday. JMP instructions for question 15.41 are actually for.>")
