Download presentation
Presentation is loading. Please wait.

1
Financial Analysis, Planning and Forecasting Theory and Application By Alice C. Lee San Francisco State University John C. Lee J.P. Morgan Chase Cheng F. Lee Rutgers University Chapter 7 Risk Estimation and Diversification

2
Outline 7.1Introduction 7.2 Risk classification 7.3Portfolio analysis and applications 7.4The market rate of return and market risk premium 7.5Determination of commercial lending rates 7.6The dominance principle and performance evaluation 7.7Summary Appendix 7A. Estimation of market risk premium Appendix 7B. Normal distribution and Value at Risk Appendix 7C. Derivation of Minimum-Variance Portfolio Appendix 7D. Sharpe Performance Approach to Derive Optimal Weight

3
7.1 Risk classification Business risk Financial risk Total risk

4
7.1 Risk classification Table 7-1 State of EconomyState Occurring (p i )ROI (A 1 ) of GM(X AI )ROI (B i ) of Ford (X Bi ) Boom.2015%14% Normal.6012%11% Recession.204%3%
ROI (A 1 ) of GM(X AI )ROI (B i ) of Ford (X Bi ) Boom.2015%14% Normal.6012%11% Recession.204%3%")
5
7.1 Risk classification (7.1) (7.2) (7.3)
 (7.2) (7.3)")
6
7.1 Risk classification IntervalChance of Occurrence GM.11 –.037 < X <.11 +.037 68.27%.11 –.074 < X <.11 +.074 95.45%.11 –.111 < X <.11 +.111 99.73% Ford.10 –.037 < X <.10 +.037 68.27 %.11 –.074 < X <.11 +.074 95.45%.11 –.111 < X <.11 +.111 99.73%

7
7.1 Risk classification Figure 7-1 Relationship of Total Risk to Financial Leverage

8
7.2Portfolio analysis and applications Expected rate of return on a portfolio Variance and standard deviations of a portfolio The efficient portfolios Corporate application of diversification

9
7.3 Portfolio Analysis and Application (7.4) (7.5)
 (7.5)")
10
7.3Portfolio Analysis and Applications (7.6) (7.7)
 (7.7)")
11
7.3Portfolio analysis and applications Figure 7-2

12
7.3Portfolio analysis and applications (7.8) (7.9) (7.10) (7.11)
 (7.9) (7.10) (7.11)")
13
7.3Portfolio analysis and applications Figure 7-3

14
7.3Portfolio analysis and applications Efficient Portfolios E(A) > E(B) and var(A) = var(B) Or E(A) = E(B) and var(A) < var (B).
 > E(B) and var(A) = var(B) Or E(A) = E(B) and var(A) < var (B).")
15
7.3Portfolio analysis and applications Figure 7-4 Efficient Frontier in Portfolio Analysis

16
7.3Portfolio analysis and applications Table 7-2 Variance-Covariance Matrix MRKJNJ MRK.006206.001069 JNJ.001069.001645

17
7.3Portfolio analysis and applications

18
7.4 The market rate of return and market risk premium Table 7-3 Market Returns and T-bill Rates by Quarters YearQuarter S & P 500 Index (A) Market Return Annualized 3- month T-bill Rates (B) Quarterly 3- month T-bill Rates (A-B) Quarterly Rates Premium 034164.92 041159.17-3.499.522.38-5.87 2153.17-3.779.872.47-6.24 3166.09 8.4410.372.59 5.84 4167.23.69 8.062.02-1.33 051180.65 8.02 8.522.13 5.89 2191.84 6.196.951.74 4.46
 Market Return Annualized 3- month T-bill Rates (B) Quarterly 3- month T-bill Rates (A-B) Quarterly Rates Premium")
19
7.4 The market rate of return and market risk premium Table 7-3 Market Returns and T-bill Rates by Quarters (Cont’d) YearQuarter S & P 500 Index (A) Market Return Annualized 3- month T-bill Rates (B) Quarterly 3- month T-bill Rates (A-B) Quarterly Rates Premium 3182.07-5.097.101.78-6.87 4211.2716.047.101.7814.26 061238.9013.086.561.6411.44 2250.84 5.006.211.553.45 3231.32-7.785.211.30-9.08 4242.17 4.695.531.383.31 Mean195.36 3.507.581.901.61
 YearQuarter S & P 500 Index (A) Market Return Annualized 3- month T-bill Rates (B) Quarterly 3- month T-bill Rates (A-B) Quarterly Rates Premium Mean")
20
7.5Determination of commercial lending rates Table 7.4 Economic conditionRtRt (A) Probability (B) EBIT (C) Probability (D) R p Boom10%.25$2.5m 1.5.5.40.30 2% 3 5 Normal9.50$2.5m 1.5.5.40.30 235235 Poor8.25$2.5m 1.5.5.40.30 235235
 Probability (B) EBIT (C) Probability (D) R p Boom10%.25$2.5m % 3 5 Normal9.50$2.5m Poor8.25$2.5m")
21
7.5Determination of commercial lending rates Table 7-5 Economic condition (A) R t (B) Probability (C) R p (D) Probability (B X D) Probability of Occurrence (A + C) Lending Rate Boom10%.252% 3 5.40.30.100.075 12% 13 15 Normal9.50235235.40.30.200.150 11 12 14 Poor8.25235235.40.30.100.075 1.000 10 11 13
 R t (B) Probability (C) R p (D) Probability (B X D) Probability of Occurrence (A + C) Lending Rate Boom10%.252% % Normal Poor")
22
7.5Determination of commercial lending rates

23
7.6 The dominance principle and performance evaluation Figure 7-5

24
7.6 The dominance principle and performance evaluation Figure 7-6

25
7.6 The dominance principle and performance evaluation Sharpe Performance Measure

26
7.6 The dominance principle and performance evaluation Table 7-6 Smith FundJones Fund Average return ( ) 18%16% Standard deviation (σ)20%15% Risk-free rate = R f = 9.5%
 18%16% Standard deviation (σ)20%15% Risk-free rate = R f = 9.5%")
27
7.7Summary In Chapter 7, we defined the basic concepts of risk and risk measurement. Based on the relationship of risk and return, we demonstrated the efficient portfolio concept and its implementation, as well as the dominance principle and performance measures. Interest rates and market rates of return were used as measurements to show how the commercial lending rate and the market risk premium are calculated.

28
Appendix 7A. Estimation of market risk premium Table 7A-1 Summary Statistics of Annual Returns (1926-2006) Series Geometric Mean Arithmetic Mean Standard Deviation S&P 500 Index6.02%7.90%19.39% U.S. Treasury Bills (3 Month)3.79%3.83%3.45% Long-Term Corporate Bonds (20 Year)6.44%7.04%3.05% Long-Term Government Bonds (20 Year)5.24%5.60%9.04% Sources: (1) The Center for Research in Security Prices, Wharton School of Business, The University of Pennsylvania. (2) Federal Reserve Economic Data, The Federal Reserve Bank of St. Louis.
 Series Geometric Mean Arithmetic Mean Standard Deviation S&P 500 Index6.02%7.90%19.39% U.S. Treasury Bills (3 Month)3.79%3.83%3.45% Long-Term Corporate Bonds (20 Year)6.44%7.04%3.05% Long-Term Government Bonds (20 Year)5.24%5.60%9.04% Sources: (1) The Center for Research in Security Prices, Wharton School of Business, The University of Pennsylvania. (2) Federal Reserve Economic Data, The Federal Reserve Bank of St. Louis..")
29
Appendix 7A. Estimation of market risk premium Exhibit 7A-1: Derived Series: Summary Statistics of Annual Component Returns (1926-2006) SeriesGeometric Mean Arithmetic Mean Standard Deviation Distribution Equity risk premia (stock- bills) 2.13%4.06%19.48% Default premia (LT corps-LT govts.) 1.11.448.13 Horizon premia (LT govts. - bills) 1.341.769.4 Real interest rates (bills – inflation).63.714.03
 SeriesGeometric Mean Arithmetic Mean Standard Deviation Distribution Equity risk premia (stock- bills) 2.13%4.06%19.48% Default premia (LT corps-LT govts.) Horizon premia (LT govts. - bills) Real interest rates (bills – inflation)")
30
Appendix 7A. Estimation of market risk premium Exhibit 7A-2: Simulated Total Return Distributions of Common Stock (1977-2000) by Geometric Average Annual Rates
 by Geometric Average Annual Rates.")
31
Appendix 7B. Normal distribution and Value at Risk Figure 7B-1 Probability Density Function for a Normal Distribution, Showing the Probability That a Normal Random Variable Lies between a and b (Shaded Area)
.")
32
Appendix 7B. Normal distribution and Value at Risk Figure 7B-2 Probability Density Function of Normal Random Variables with Equal Variances: Mean 2 is Greater Than 1.

33
Appendix 7B. Normal distribution and Value at Risk Figure 7B-3 Probability Density Functions of Normal Distributions with Equal Means and Different Variances

34
Appendix 7B. Normal distribution and Value at Risk Table 7B-1 Probability, P, That a Normal Random Variable with Mean and Standard Deviation σ lies between K – σ and K – σ. PK/ σ.50.674.60.842.701.036.801.281.901.645.951.960

35
Appendix 7B. Normal distribution and Value at Risk Figure 7B-4 Probability That a Normal Random Variable is Between -K and +K (Shaded Area)
.")
36
Appendix 7B. Normal distribution and Value at Risk Figure 7B-5 For a Normal Random Variable with Mean 12, Standard Deviation 4.95, the Probability is.5 of a Value between 10.5 and 13.5

37
Appendix 7C. Derivation of Minimum-Variance Portfolio (7.C.1) (7.C.2) (7.C.3)
 (7.C.2) (7.C.3)")
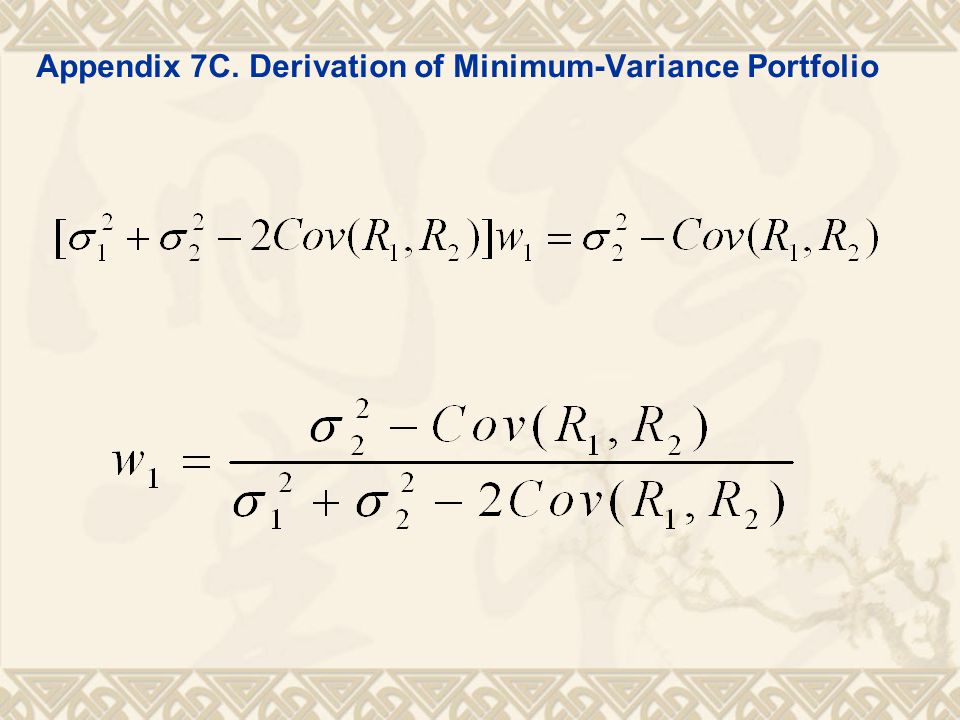
38
Appendix 7C. Derivation of Minimum-Variance Portfolio

40
Appendix 7D. Sharpe Performance Approach to Derive Optimal Weight where = expected rates of return for portfolio P. = risk free rates of return = Sharpe performance measure as defined in equation (7.C.1) of Appendix C
 of Appendix C.")
41
Appendix 7D. Sharpe Performance Approach to Derive Optimal Weight (7.D.1) (7.D.2) (7.D.3) (7.D.4)
 (7.D.2) (7.D.3) (7.D.4)")
42
Appendix 7D. Sharpe Performance Approach to Derive Optimal Weight (7.D.5) (7.D.6) (7.D.7)
 (7.D.6) (7.D.7)")
43
Appendix 7D. Sharpe Performance Approach to Derive Optimal Weight (7.D.8) (7.D.9)
 (7.D.9)")
44
Appendix 7D. Sharpe Performance Approach to Derive Optimal Weight (7.D.10) (7.D.11)
 (7.D.11)")
45
Appendix 7D. Sharpe Performance Approach to Derive Optimal Weight (7.D.12)
")
46
Appendix 7D. Sharpe Performance Approach to Derive Optimal Weight Left hand side of equation (D12):
:")
47
Appendix 7D. Sharpe Performance Approach to Derive Optimal Weight Right hand side of equation (D12)
")
48
Appendix 7D. Sharpe Performance Approach to Derive Optimal Weight (7.D.13) (7.D.14)
 (7.D.14)")
49
Appendix 7D. Sharpe Performance Approach to Derive Optimal Weight

Similar presentations


>")


