Download presentation
Presentation is loading. Please wait.

1
CSCE 641 Computer Graphics: Fourier Transform Jinxiang Chai

2
Outline Aliasing Fourier transform Filtering

3
Image Scaling This image is too big to fit on the screen. How can we reduce it? How to generate a half- sized version?

4
Image Sub-sampling Throw away every other row and column to create a 1/2 size image - called image sub-sampling 1/4 1/8

5
Image Sub-sampling 1/4 (2x zoom) 1/8 (4x zoom) Why does this look so crufty? 1/2
 1/8 (4x zoom) Why does this look so crufty 1/2")
6
With/Without Aliasing

7
Even Worse for Synthetic Images

8
Difference between Lines

9
Really Bad in Video wheel reverse rotation: Click herehere

10
Aliasing occurs when your sampling rate is not high enough to capture the amount of detail in your image Can give you the wrong signal/image—an alias Where can it happen in computer graphics? During image synthesis: –sampling continuous signal into discrete signal –e.g., ray tracing, line drawing, function plotting, etc. During image processing: –resampling discrete signal at a different rate –e.g. Image warping, zooming in, zooming out, etc. As well as other data such animation synthesis To do sampling right, need to understand the structure of your signal/image– signal processing

11
Signal Processing Analysis, interpretation, and manipulation of signals - images, videos, geometric and motion data - sampling and reconstruction of the signals. - minimal sampling rate for avoiding aliasing artifacts - how to use filtering to remove the aliasing artifacts?

12
Outline Aliasing Fourier transform Filtering

13
Periodic Functions A periodic function is a function defined in an interval that repeats itself outside the interval

14
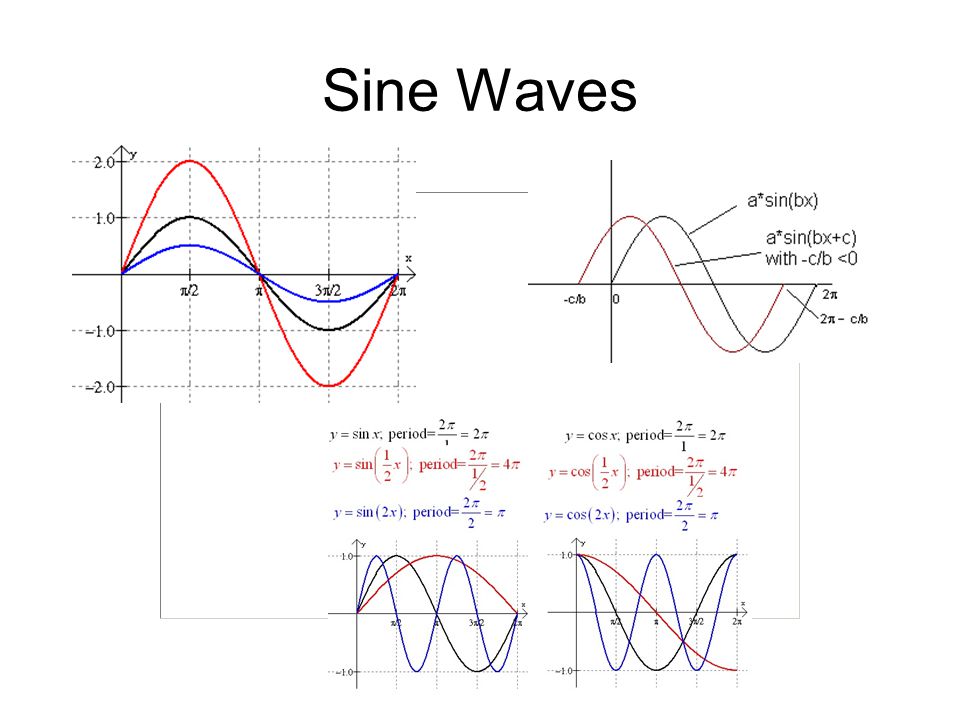
Sine Waves

16
Jean Baptiste Fourier (1768-1830) had crazy idea (1807): Any periodic function can be rewritten as a weighted sum of sines and cosines of different frequencies. Don’t believe it? –Neither did Lagrange, Laplace, Poisson and other big wigs –Not translated into English until 1878! But it’s true! –called Fourier Series

17
A Sum of Sine Waves Our building block: Add enough of them to get any signal f(x) you want!
 you want!")
18
A Sum of Sine Waves Our building block: Add enough of them to get any signal f(x) you want!
 you want!")
19
A Sum of Sine Waves Our building block: Add enough of them to get any signal f(x) you want!
 you want!")
20
A Sum of Sine Waves Our building block: Add enough of them to get any signal f(x) you want!
 you want!")
21
A Sum of Sine Waves Our building block: Add enough of them to get any signal f(x) you want! How many degrees of freedom? What does each control? Which one encodes the coarse vs. fine structure of the signal?

22
How about Non-peoriodic Function? A non-periodic function can also be represented as a sum of sin’s and cos’s But we must use all frequencies, not just multiples of the period The sum is replaced by an integral.

23
Fourier Transform A function f(x) can be represented as a sum of phase-shifted sine waves
 can be represented as a sum of phase-shifted sine waves")
24
Fourier Transform A function f(x) can be represented as a sum of phase-shifted sine waves How to compute F(u)?
 can be represented as a sum of phase-shifted sine waves How to compute F(u)")
25
Fourier Transform A function f(x) can be represented as a sum of phase-shifted sine waves How to compute F(u)?
 can be represented as a sum of phase-shifted sine waves How to compute F(u)")
26
Fourier Transform A function f(x) can be represented as a sum of phase-shifted sine waves How to compute F(u)? Amplitude:Phase angle:

27
Fourier Transform A function f(x) can be represented as a sum of phase-shifted sine waves How to compute F(u)? Amplitude:Phase angle: Inverse Fourier Transform Fourier Transform

28
A function f(x) can be represented as a sum of phase-shifted sine waves How to compute F(u)? Amplitude:Phase angle: Inverse Fourier Transform Fourier Transform Dual property for Fourier transform and its inverse transform

29
Fourier Transform Magnitude against frequency: f(x) |F(u)| How much of the sine wave with the frequency u appear in the original signal f(x)?
 |F(u)| How much of the sine wave with the frequency u appear in the original signal f(x)")
30
Fourier Transform Magnitude against frequency: f(x) |F(u)| How much of the sine wave with the frequency u appear in the original signal f(x)? 5 ?

31
Fourier Transform Magnitude against frequency: f(x) |F(u)| How much of the sine wave with the frequency u appear in the original signal f(x)? 5

32
Fourier Transform f(x) |F(u)|
 |F(u)|")
33
Fourier Transform f(x) |F(u)|
 |F(u)|")
34
Fourier Transform f(x) |F(u)|
 |F(u)|")
35
Fourier Transform f(x) |F(u)|
 |F(u)|")
36
Box Function and Its Transform x f(x)
")
37
Box Function and Its Transform x f(x)
")
38
Box Function and Its Transform x u f(x) |F(u)| If f(x) is bounded, F(u) is unbounded
 |F(u)| If f(x) is bounded, F(u) is unbounded")
39
Another Example If the fourier transform of a function f(x) is F(u), what is the fourier transform of f(-x)?
 is F(u), what is the fourier transform of f(-x)")
40
Another Example If the fourier transform of a function f(x) is F(u), what is the fourier transform of f(-x)?
 is F(u), what is the fourier transform of f(-x)")
41
Dirac Delta and Its Transform x f(x)
")
42
Dirac Delta and Its Transform x 1 u f(x) |F(u)| Fourier transform and inverse Fourier transform are qualitatively the same, so knowing one direction gives you the other
 |F(u)| Fourier transform and inverse Fourier transform are qualitatively the same, so knowing one direction gives you the other")
43
Cosine and Its Transform 1 If f(x) is even, so is F(u)
 is even, so is F(u)")
44
Sine and Its Transform 1 -- If f(x) is odd, so is F(u)
 is odd, so is F(u)")
45
Gaussian and Its Transform If f(x) is gaussian, F(u) is also guassian.
 is gaussian, F(u) is also guassian.")
46
Gaussian and Its Transform If f(x) is gaussian, F(u) is also guassian. what’s the relationship of their variances?

47
Gaussian and Its Transform If f(x) is gaussian, F(u) is also guassian. what’s the relationship of their variances?

48
Properties Linearity:

49
Properties Linearity: Time-shift:

50
Properties Linearity: Time-shift:

51
Properties Linearity: Time-shift:

52
Properties Linearity: Time shift: Derivative: Integration: Convolution:

53
Outline Aliasing Fourier transform Filtering

54
1D Signal Filtering

55
2D Image Filtering

57
Animation Filtering Cartoon animation filter Click herehere

58
Signal Filtering A filter is something that attenuates or enhances particular frequencies

59
Signal Filtering A filter is something that attenuates or enhances particular frequencies Easiest to visualize in the frequency domain, where filtering is defined as multiplication: Spectrum of the function Spectrum of the filter Spectrum of the filtered function

60
Filtering = = = Low-pass High-pass Band-pass FGH

61
Filtering Identify filtered images from low-pass filter, high-pass filter, and band-pass filter?

62
Filtering in Frequency Domain = = = Low-pass High-pass Band-pass FGH So what happens in the spatial domain? Convolution

63
Convolution Compute the integral of the product between f and a reversed and translated version of g

64
Convolution Compute the integral of the product between f and a reversed and translated version of g

65
Convolution Compute the integral of the product between f and a reversed and translated version of g Reversed and translated function g

66
Convolution Compute the integral of the product between f and a reversed and translated version of g Reversed and translated function g

67
Convolution Compute the integral of the product between f and a reversed and translated version of g t=2.5

68
Convolution Compute the integral of the product between f and a reversed and translated version of g t=4.6

69
Convolution Compute the integral of the product between f and a reversed and translated version of g t=4.6 For discrete signals such as images, this is just a weighted sum of all function values in the window - weights and window sizes are filter dependent

70
Convolution For discrete signals such as images, this is just a weighted sum of all function values in the window - weights and window sizes are filter dependent

71
Convolution Theory h(t)
")
72
Convolution Theory

76
Qualitative Property The spectrum of a function tells us the relative amounts of high and low frequencies –Sharp edges imply high frequencies –Smooth variations give low frequencies –The zero frequency term is the average value of function A function is band-limited if its spectrum has no frequencies above a maximum limit –sine, cosine are bandlimited –Box, Gaussian, etc. are not

77
Qualitative Property The spectrum of a function tells us the relative amounts of high and low frequencies –Sharp edges imply high frequencies –Smooth variations give low frequencies –The zero frequency term is the average value of function A function is band-limited if its spectrum has no frequencies above a maximum limit –sine, cosine are bandlimited –Box, Gaussian, etc are not

78
Summary Convert a function from the spatial domain to the frequency domain and vice versa. Interpret a function in either domain, e.g., filtering and correlation. Build your intuition about functions and their spectra.

79
Next lecture Fourier transform for 2D signals (images) Sampling and reconstruction How to avoid aliasing Fourier transform
 Sampling and reconstruction How to avoid aliasing Fourier transform")
Similar presentations


![Reminder Fourier Basis: t [0,1] nZnZ Fourier Series: Fourier Coefficient:](/16/4936498/big_thumb.jpg "Reminder Fourier Basis: t [0,1] nZnZ Fourier Series: Fourier Coefficient:>")


Cipolla & Gee on edge detection Szeliski 3.4.1 – 3.4.2 From Sandlot ScienceSandlot.>")
 all frequencies: F( ) is the spectrum of the function.>")


 COMS 4162, Lecture 3: Sampling and Reconstruction Ravi Ramamoorthi>")


>")

 COMS 4162, Lecture 3: Sampling and Reconstruction Ravi Ramamoorthi>")
