Download presentation
Presentation is loading. Please wait.

1
Technical Analysis, Part 2 Ross Klosterman Common Cents Investment Group

2
Agenda Quick recap of last week More indicators Another interactive activity Conclusion

3
Support/Resistance Support – price level at which demand is thought to be strong enough to prevent the price from declining further Resistance – price level at which selling is thought to be strong enough to prevent the price from rising further

4
RSI/MACD RSI- momentum oscillator that measures the speed and change of price movements Moving Average Convergence/Divergence (MACD) – one of the simplest and most reliable indicators Bollinger Bands – allows users to compare volatility and relative price levels over a period of time.
 – one of the simplest and most reliable indicators Bollinger Bands – allows users to compare volatility and relative price levels over a period of time.")
5
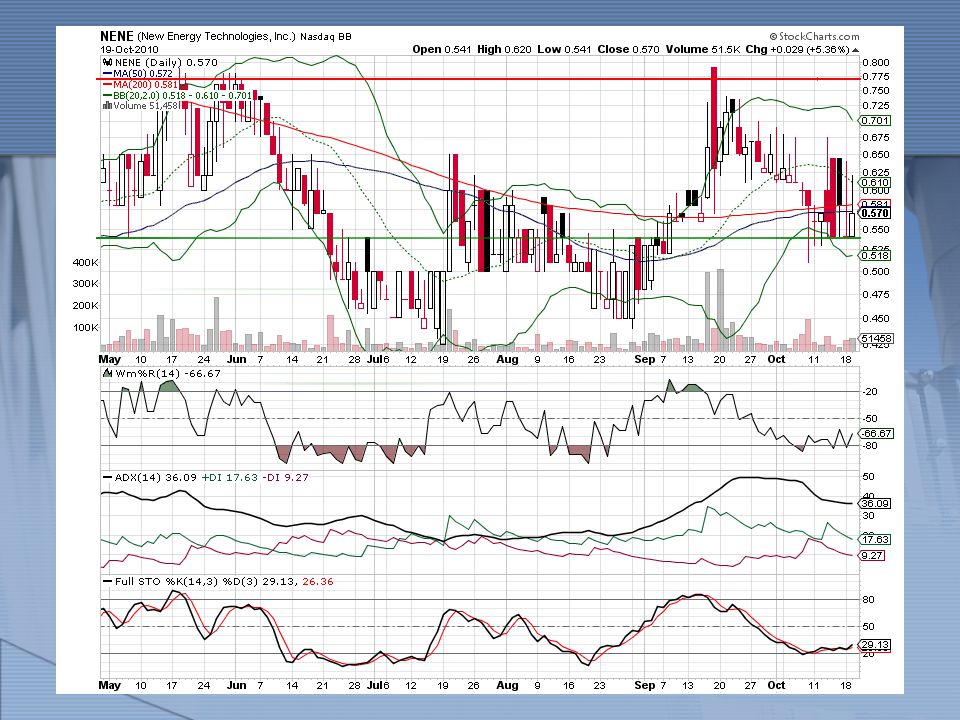
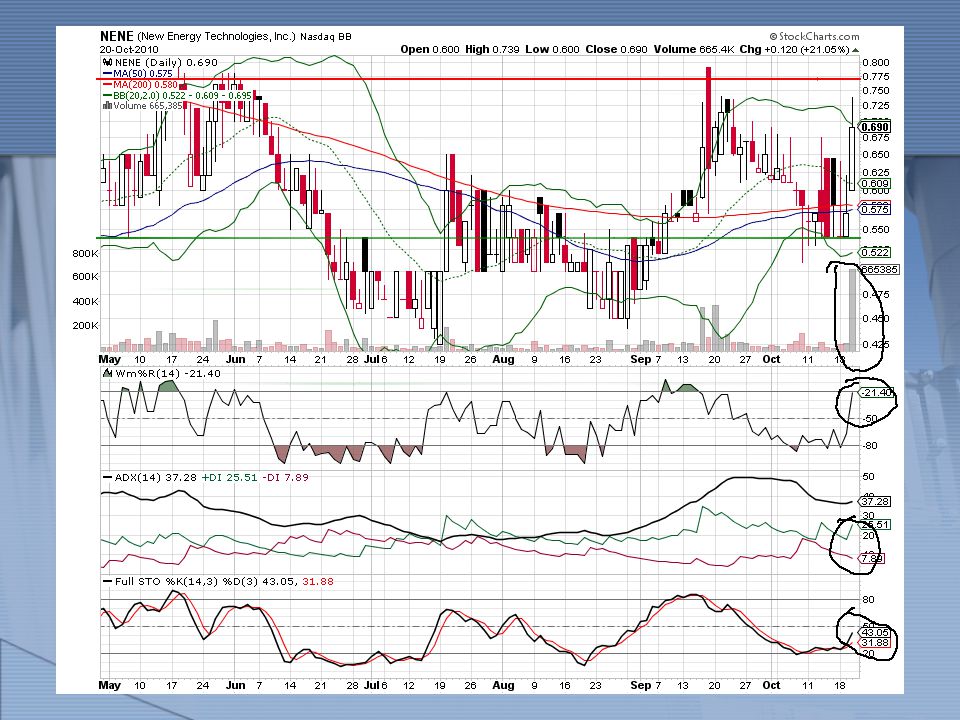
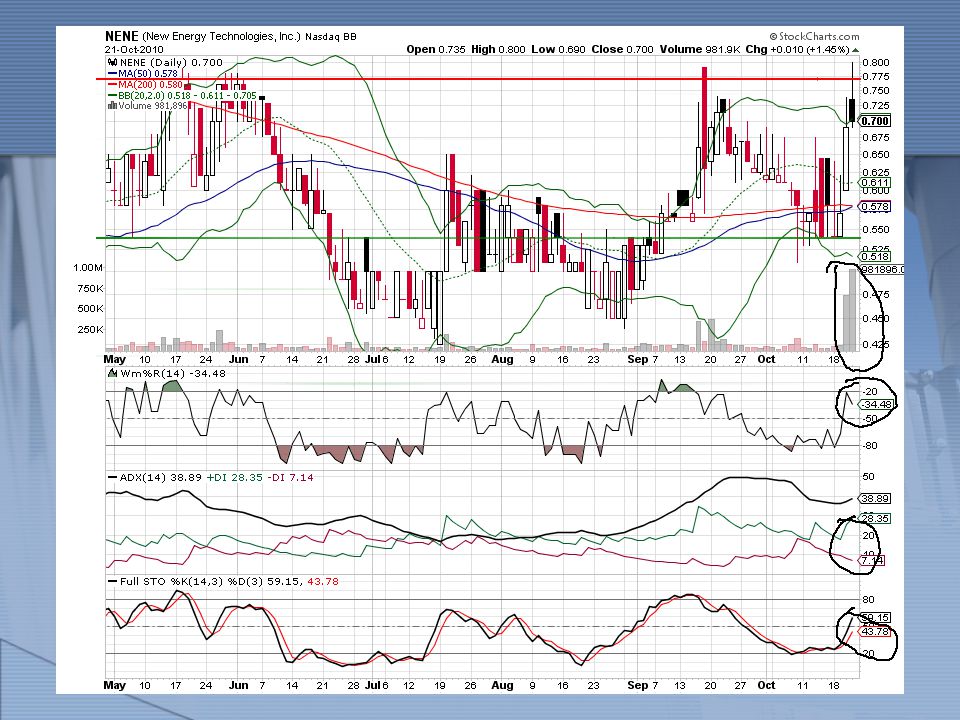
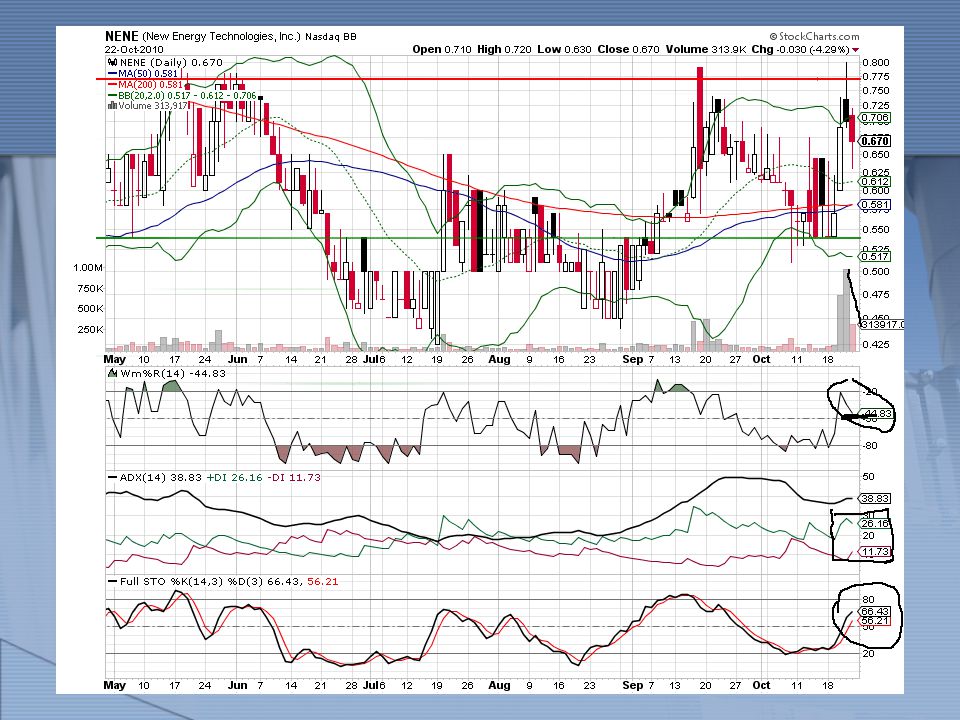
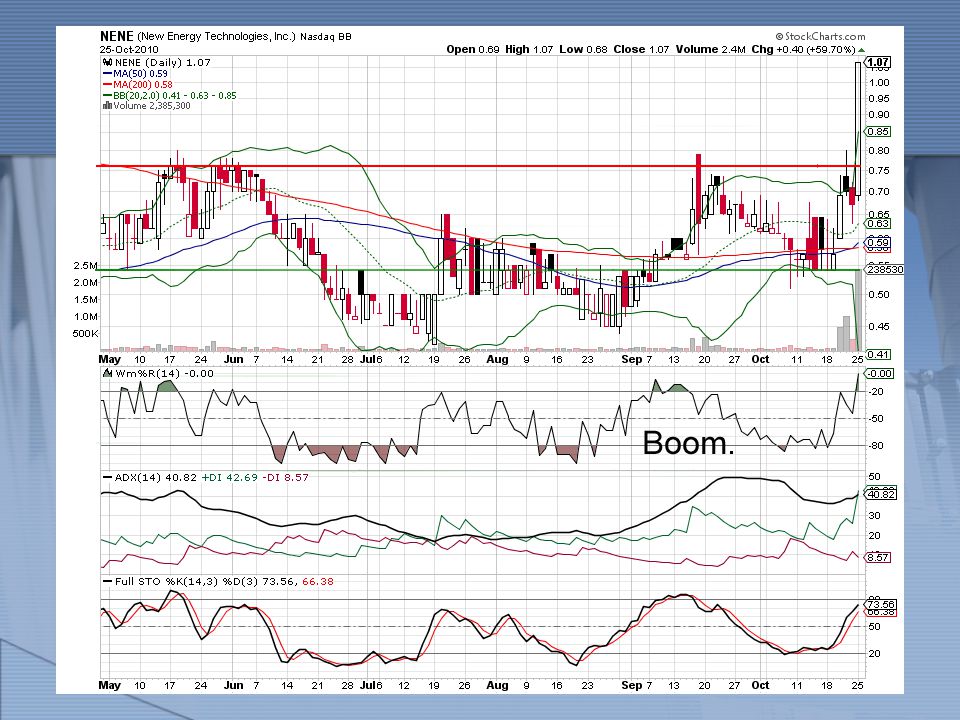
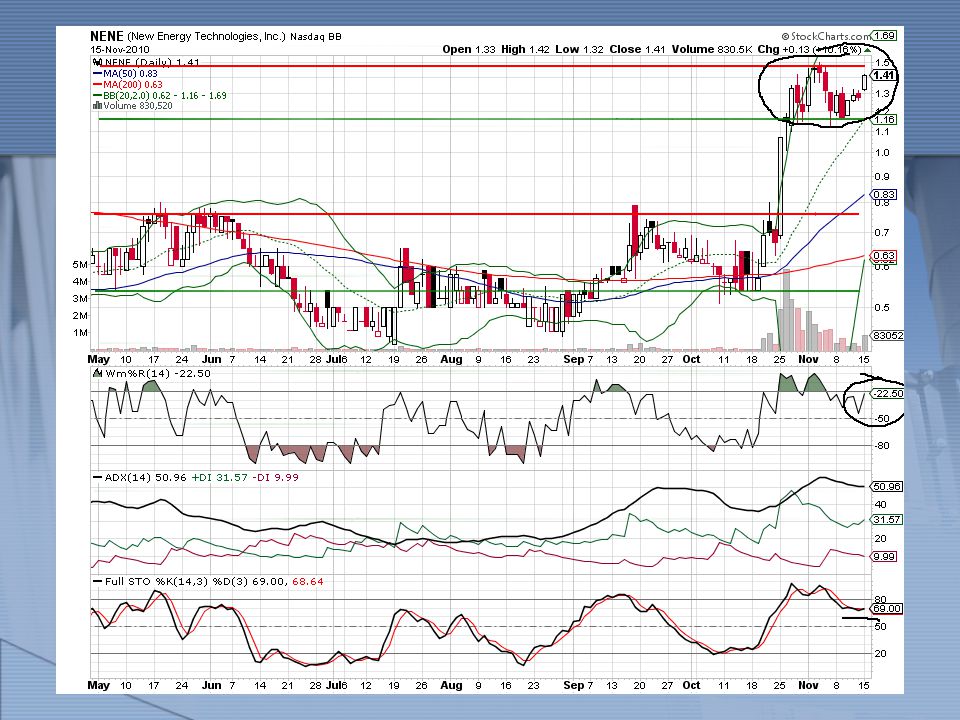
Stock we looked at

7
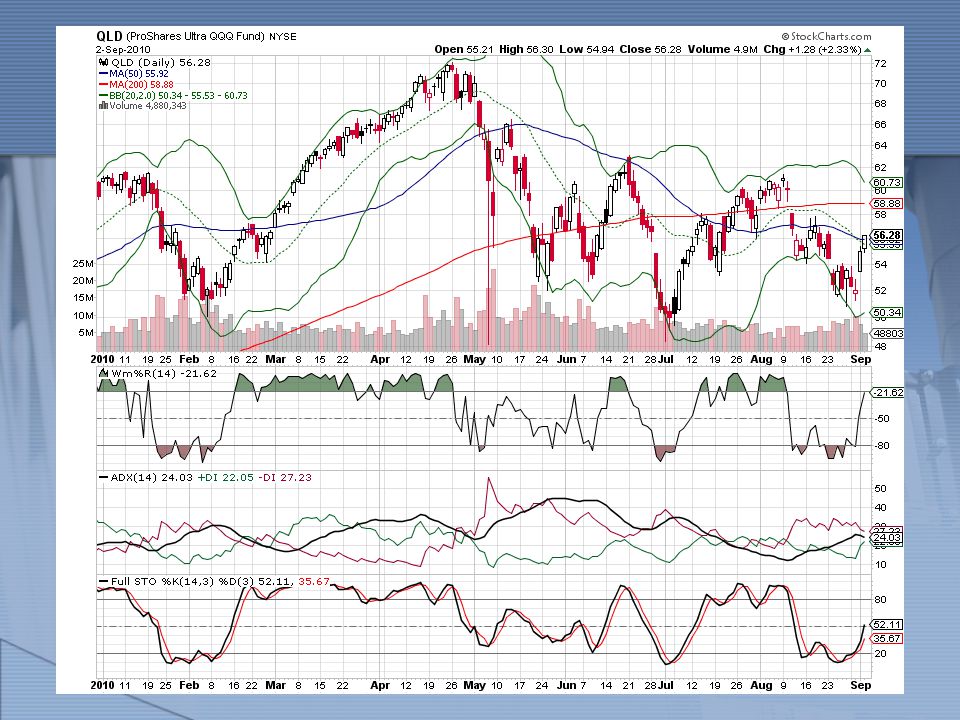
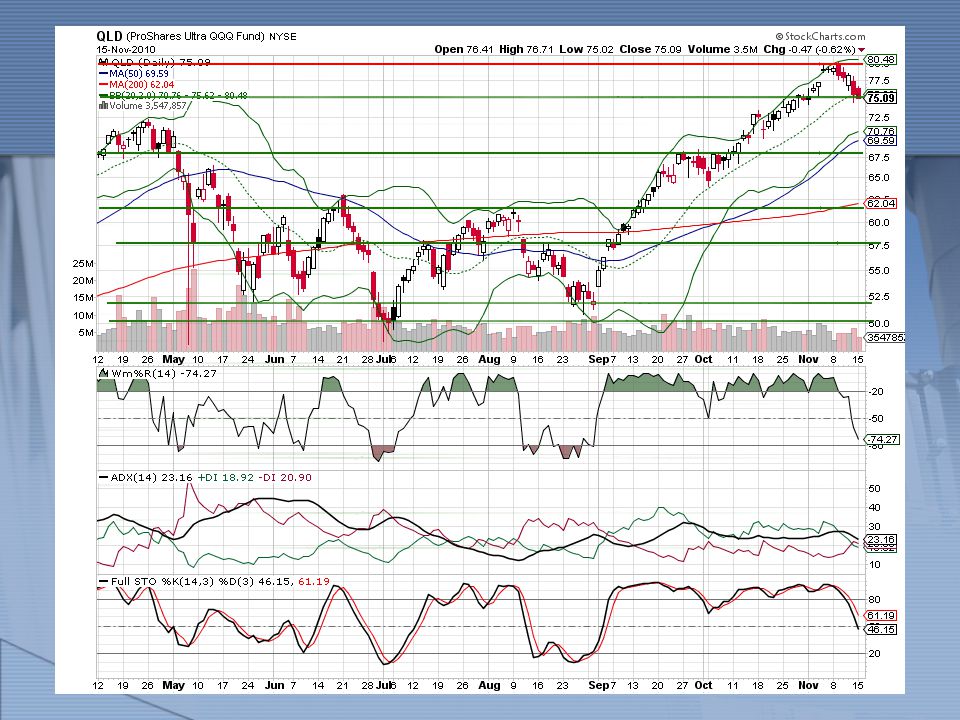
New Indicators! Williams %R-A momentum indicator that works much like the Stochastic Oscillator. It is especially popular for measuring overbought and oversold levels Wilder’s DMI (ADX)-Used to evaluate the strength of a current trend, be it up or down
-Used to evaluate the strength of a current trend, be it up or down.")
8
Stochastics (Full)-The Stochastic Oscillator is a momentum indicator that shows the location of the current close relative to the high/low range over a set number of periods.
-The Stochastic Oscillator is a momentum indicator that shows the location of the current close relative to the high/low range over a set number of periods.")
17
Final Thoughts NOT FOOLPROOF! *cannot be stressed enough Do your FA Questions? Klosterman.53@buckeyemail.osu.edu

Similar presentations


 Fundamental analysis: Analyzing business fundamentals using financial statements, valuation models,>")


 Investment Period 1005 days (2.75 years) Successful.>")


