Download presentation
Presentation is loading. Please wait.

1
Intro to Statistics for the Behavioral Sciences PSYC 1900
Lecture 7: Multiple Regression

2
Bivariate Regression Review
Predicts values of Y as a linear function of X The intercept: a The predicted value of Y when X=0 The slope: b The change in Y associated with a one unit change in X Regression line is one that minimizes errors

3
Partitioning Variance
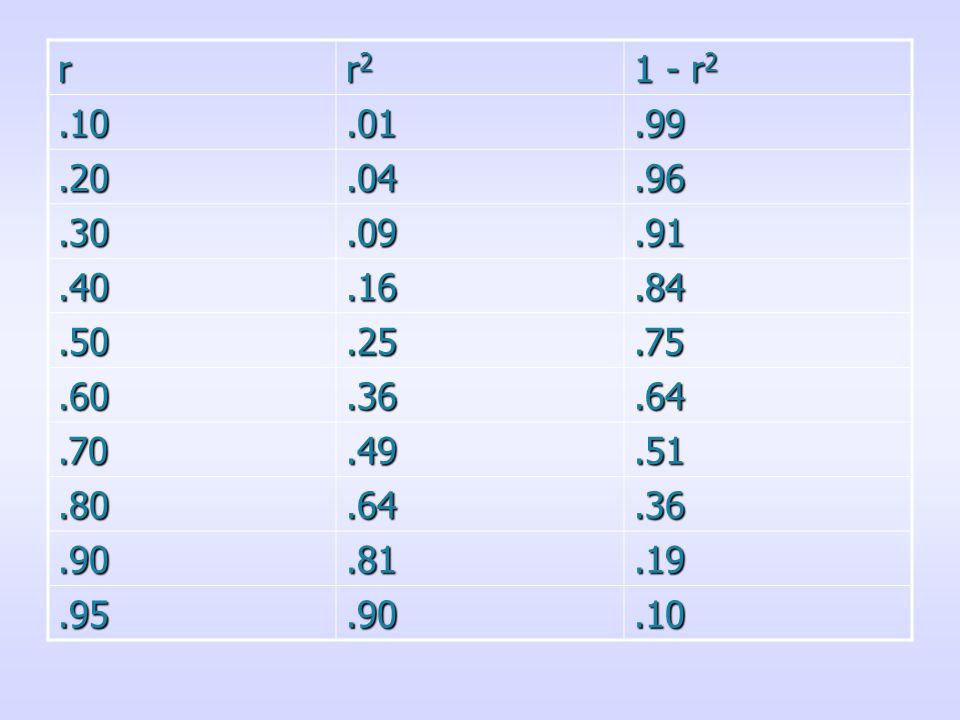
Total variance of Y is partitioned into portion explained by X and error R2 is portion that is explained Standard error of estimate is average deviation around prediction line

4
r r2 1 - r2 .10 .01 .99 .20 .04 .96 .30 .09 .91 .40 .16 .84 .50 .25 .75 .60 .36 .64 .70 .49 .51 .80 .90 .81 .19 .95
5
Hypothesis Testing in Regression
The null hypothesis is simply that the slope equals zero. This is equivalent to testing r=0 in correlation. If the correlation is significant, so must the slope be. The actual significance of the slope is tested using a t-distribution. The logic is similar to all hypothesis testing. We compare the magnitude of the slope (b) to its standard error (i.e., the variability of slopes drawn from a population where the null is true).
 to its standard error (i.e., the variability of slopes drawn from a population where the null is true).")
6
Hypothesis Testing in Regression
The formula to calculate the t value is: Note that standard error of b increases as standard error of the estimate increases We then determine how likely it would be that we found a slope as large as we did using a t distribution (similar to the normal distribution).
.")
7
Multiple Regression Allows analysis of more than one independent variable Explains variance in Y as a function of a linear composite of iv’s Each iv has a regression coefficient which provides an estimate of its independent effects.

8
An Example Suppose we want to examine two factors related to the percentage of low birth weights in an area. Percentage of mothers with low education levels Percentage of mothers not seeking prenatal care

9
Looking at Correlations
Here it appears that both low education and lack of care predict increased lower birth weights. Is it fair to say that both variables might be causes?

10
Example Continued Given that low education and lack of prenatal care are associated, we need to control for one while examining the relation of the other to low birth weights. Multiple regression accomplishes this task.

11
Another Example Let’s examine applicant attractiveness as a function of GREV, Letters of Rec, & Personal Statements Y, letters, & statements are rated on 1-7 scales If all are significant, which variables are “stronger” predictors? Use standardized regression coefficients

12
Standardized Regressions
The use of standardized coefficients allows easier comparisons of the magnitude of effects Coefficients refer to changes in predicted z-scores of Y as a function of z-scores of x What is the relation of b to r here? In multiple regression, b only equals r if all iv’s are uncorrelated.

13
Squared Multiple Correlation Coefficient
In bivariate regression, we saw that r2 provided an estimate of the variance in Y explained by variance in X. In multiple regression, R2 serves this value. Note that capital R refers to the correlation of the linear composite (i.e., the weighted combination of all iv’s) with Y.
 with Y.")
14
Squared Multiple Correlation Coefficient
Returning to the low birth weight example: Here we see that education level and prenatal care explain 67% of the variance in the percentage of low birth weights.

15
Hypothesis Testing There are two types of null hypotheses in multiple regression. Null for the entire model The linear function (i.e., all variables) does not explain any variance in Y. R2 = 0 If you cannot reject this null, the analysis is over. Null for each predictor Any given iv does not explain variance in Y. b = 0
 does not explain any variance in Y. R2 = 0. If you cannot reject this null, the analysis is over. Null for each predictor. Any given iv does not explain variance in Y. b = 0.")
16
Testing Hypotheses for Individual Predictors
Hypothesis testing here is quite similar to that for the single iv in bivariate regression. But note that in multiple regression, the standard error is sensitive to the overlap (i.e., correlation) among coefficients. As the intercorrelation increases, so does the standard error.
 among coefficients. As the intercorrelation increases, so does the standard error.")
17
Testing Hypotheses for the Model
Here, we must determine if R2 differs form zero. This is accomplished using the F-distribution (we’ll see this again in ANOVA). Logic is the same, however. Is R2 in the sample large enough to make the null unlikely in the population? p=.02
. Logic is the same, however. Is R2 in the sample large enough to make the null unlikely in the population p=.02.")
18
Refining a Model When you are building a model, one way to determine if the addition of new variables improves fit is to see if adding them results in a significant change in R2. If so, this means that adding the variable explains a significant amount of previously unexplained variability. Why not just add variables that significantly correlate with Y?

19
Time for Examples

Similar presentations


