Download presentation
Presentation is loading. Please wait.

1
Cyanobacteria Blooms in Upper Klamath Lake
Lauren Senkyr ESR 575 Limnology November 23, 2009

2
Upper Klamath Lake Oregon’s largest lake Oregon’s largest lake:
Volume ~ 536 x 1036 Surface area ~275 km2 Shallow, hypereutrophic Avg. depth 2.2 m Mean depth 2 m Max. depth 15.2 m

3
Management issues Water diversions ESA listed suckers
Agriculture- nutrient inputs + water use Dams along Klamath River

4
Cycle of Water Quality Degradation in Upper Klamath Lake
↑ Algal Blooms ↑ Phosphorus ↑ pH ↑ Nutrient Loading ↑ Unionized Ammonia Fish Die-offs ↓ Dissolved Oxygen ↓ Algal Blooms

5
Cyanobacteria Aphanizomenon flos-aquae dominant June-October
“Blue green algae” Aphanizomenon flos-aquae dominant June-October 1st appearance 1933 Collapse causes anoxic conditions that lead to fish kills Commercially harvested 1 toxic species in UKL (Microcystis aeruginosa)
")
6
Basic Biology of AFA Does not grow in pH < 7.1, water temperature < 11 degrees C Yamamoto and Nakahara, Limnology (2005)
 .")
7
Current Conditions in Upper Klamath Lake Favor AFA
High pH High water temperatures Eilers et. al. 2004

8
Internal P Loading Internal load ~2/3 Total P in Upper Klamath Lake
Decrease in total P in top 2 cm of sediment before/ after bloom (Simon et. al. 2009)
")
9
The Role of Wind Very strong relationship between climate and water quality in Upper Klamath Lake ↑ wind speeds = ↓ water column stability Wind induced mixing of sediments= increased nutrient availability (Kann and Welch 2005)
")
10
Impacts of altered hydrology
Sedimentation Nutrient retention Greater internal loading Wind control accentuated by lower water levels Eilers. Et. al. 2004

11
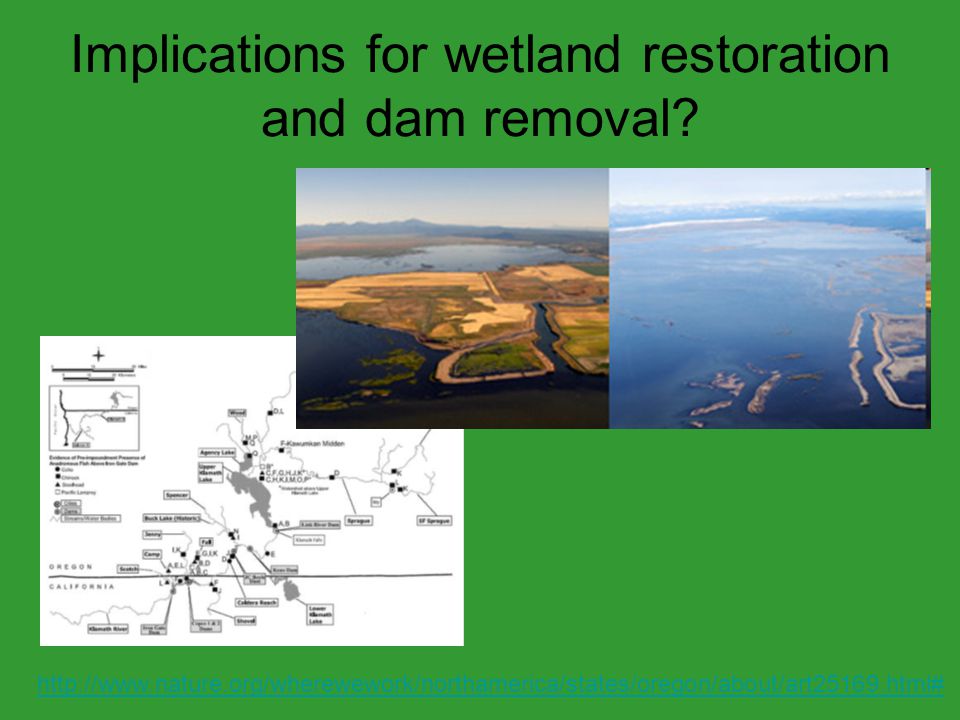
Implications for wetland restoration and dam removal?
Similar presentations


>")


