Download presentation
Presentation is loading. Please wait.

1
Surge: A Network Analysis Tool Crossbow Technology

2
Outline Discussion of 3 improvements to Surge tool Overview of routing protocol performance as captured by Surge Discussion of low-power routing performance

3
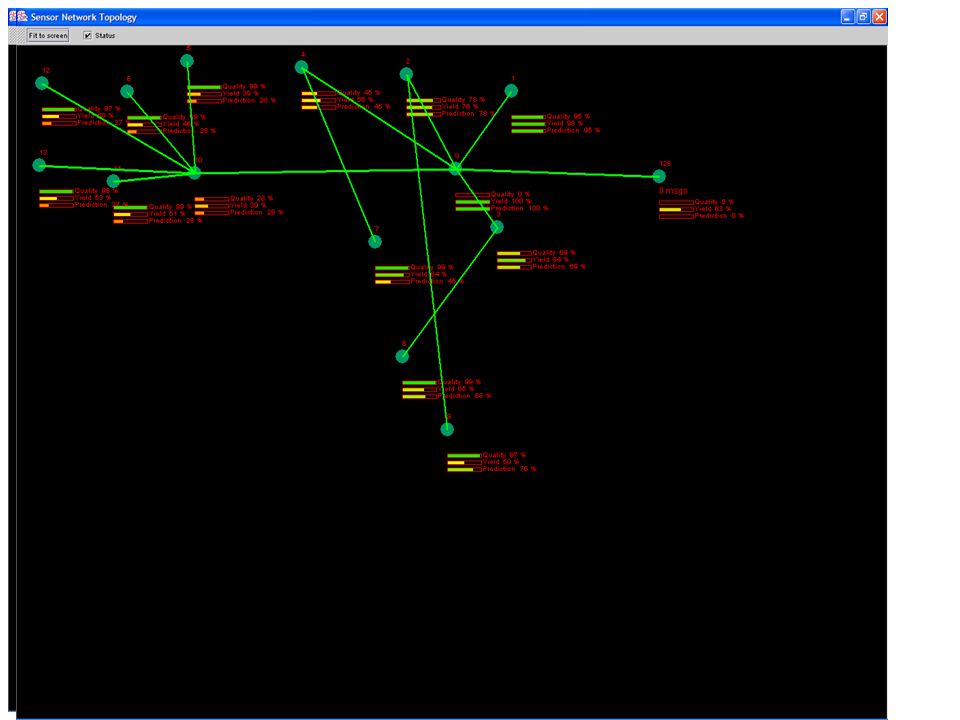
Updated Surge GUI Quality = Link Yield to Parent Yield = % of Data Packets Received Prediction = Product of Quality metrics on all links to base

4
Log File History View Allows one to scroll through log files Shows data yield across time Click on time-line to show network topology at that time Reveals flaws in routing algorithms/performance

6
History Viewer Statistics Reports overall analysis of collected data. Example output of Stats program showing reliable, stable networking.

7
Reliable Mint-Route Routing Algorithm Attempts to optimize expected success rate (Prediction in GUI) Each node monitors up to 16 neighbors Each node reports its receive link quality from each neighbor Cost metric used to represent success rate to base station Each node broadcasts its cost Node cost is parent cost plus link cost to parent Nodes try to minimize total cost Data packets are acknowledged by parents and retransmitted up to 5 times
 Each node monitors up to 16 neighbors Each node reports its receive link quality from each neighbor Cost metric used to represent success rate to base station Each node broadcasts its cost Node cost is parent cost plus link cost to parent Nodes try to minimize total cost Data packets are acknowledged by parents and retransmitted up to 5 times")
8
Mint-Route Results Avoids low-quality links seen in TinyOS 1.1 release version Prevents nodes from incorrectly attracting children In test network, it improved worst-case yield from 63% to 99%. Acknowledgements cost 6 ms of extra activity per message (less than typical MAC delay)
.")
9
Routing Improvement Results

10
Power Reduction Goal: 1 year lifetime, 100 nodes, 1 base, 3 minutes/report Methodology: Analyze current performance Build analytical model to explain current performance Modify algorithm to meet goal using analytical model Confirm on real system

11
Analysis Model Includes: Network reconfiguration operations Data originating from node Data routed by node (ack/no_ack) Data being transmitted in communication range of node Estimate for worst-case node in 100 node network: Route data for 20 nodes, hear over 200 data packets. (no base optimization)
.")
12
Analytical Analysis of Activity by Node

13
11 Months Energy Breakdown 13 Months 10 Months

14
Confirming Performance Can’t wait a year to see if it works… Internal power meter allows one to track power consumption Record milliamp-minute use by radio, CPU and if necessary sensors Report total power usage via multi-hop network

15
Power Visualization Nodes 2, 4 and 7 are “white hot” because they hear and route a lot of traffic. Nodes 9, 12 and 13 are cool because they are leaf nodes at the edge of the network. Analysis must focus on the “hot” nodes. Analytical models predict this network to last 1.5 years reporting every 3 minutes. The base rarely transmits and is the coolest.

16
Final Network Statistics

Similar presentations
 and Radovan Milosevic (MSc student) Mobile Ad-hoc networks.>")


>")


>")

 routing protocol. Dynamic Routing Protocols II OSPF.>")


