Download presentation
Presentation is loading. Please wait.

1
Enzyme Regulation Biochemistry by Reginald Garrett and Charles Grisham
Chapter 15 Enzyme Regulation Biochemistry by Reginald Garrett and Charles Grisham

2
Essential Question What are the properties of regulatory enzymes?
How do regulatory enzymes sense the momentary needs of cells? What molecular mechanisms are used to regulate enzyme activity?

3
Outline of Chapter 15 What Factors Influence Enzymatic Activity?
What Are the General Features of Allosteric Regulation? Can Allosteric Regulation Be Explained by Conformational Changes in Proteins? What Kinds of Covalent Modification Regulate the Activity of Enzymes? Is the Activity of Some Enzymes Controlled by Both Allosteric Regulation and Covalent Modification?

4
15.1 – What Factors Influence Enzymatic Activity?
The activity displayed by enzymes is affected by a variety of factors, some of which are essential to the harmony of metabolism Two of the more obvious ways to regulate the amount of activity are To increase or decrease the number of enzyme molecule (enzyme level) To increase or decrease the activity of each enzyme molecule (enzyme activity)
 To increase or decrease the activity of each enzyme molecule (enzyme activity)")
5
A general overview of factors influencing enzyme activity includes the following considerations
Rate depends on substrate availability Rate slows as product accumulates Genetic controls (transcription regulation) - induction and repression & protein degradation (enzyme level)(chapter 29&31) Enzyme activity can be regulated allosterically Enzyme activity can be regulated by covalent modification Zymogens, isozymes and modulator proteins may play a role
 - induction and repression & protein degradation (enzyme level)(chapter 29&31) Enzyme activity can be regulated allosterically. Enzyme activity can be regulated by covalent modification. Zymogens, isozymes and modulator proteins may play a role.")
6
Figure 15.1 Enzyme regulation by reversible covalent modification.

7
Zymogens Figure 15.2 Proinsulin is an 86-residue precursor to insulin (the sequence shown here is human proinsulin). Proteolytic removal of residues 31 to 65 yields insulin. Residues 1 through 30 (the B chain) remain linked to residues 66 through 87 (the A chain) by a pair of interchain disulfide bridges.
. Proteolytic removal of residues 31 to 65 yields insulin. Residues 1 through 30 (the B chain) remain linked to residues 66 through 87 (the A chain) by a pair of interchain disulfide bridges.")
8
Figure 15.3 The proteolytic activation of chymotrypsinogen.

9
Figure 15. 4 The cascade of activation steps leading to blood clotting
Figure 15.4 The cascade of activation steps leading to blood clotting. The intrinsic and extrinsic pathways converge at Factor X, and the final common pathway involves the activation of thrombin and its conversion of fibrinogen into fibrin, which aggregates into ordered filamentous arrays that become cross-linked to form the clot. Serine protease: Kallikrein VIIa IXa Xa XIa XIIa Thronbin

10
formation of a blood clot.

11
Isozymes

12
15.2 – What Are the General Features of Allosteric Regulation?
Action at "another site" Allosteric regulation acts to modulate enzymes situated at key steps in metabolic pathways A B C D E F F, the essential end product, inhibits enzyme 1, the first step in the pathway This phenomenon is called feedback inhibition or feedback regulation Enz 1 Enz 2 Enz 3 Enz 4 Enz 5

13
Regulatory enzymes have certain exceptional properties
Their kinetics do not obey the Michaelis-Menten equation Their v versus [S] plots yield sigmoid- or S-shaped curve A second-order (or higher) relationship between v and [S] Substrate binding is cooperative
 relationship between v and [S] Substrate binding is cooperative.")
14
Regulatory enzymes have certain exceptional properties
Their kinetics do not obey the Michaelis-Menten equation Inhibition of a regulatory enzyme by a feedback inhibitor does not conform to any normal inhibition pattern- Allosteric inhibition Some effector molecules exert negative effects on enzyme activity, other effectors show stimulatory, or positive, influences on activity Oligomeric organization (more than 1 polypeptide) The regulatory effects exerted on the enzyme’s activity are achieved by comformational changes occurring in the protein when effector metabolites bind
 The regulatory effects exerted on the enzyme’s activity are achieved by comformational changes occurring in the protein when effector metabolites bind.")
15
Symmetry model : Two conformational states
15.3 – Can Allosteric Regulation Be Explained by Conformational Changes in Proteins? Symmetry model : Two conformational states Monod, Wyman, Changeux (MWC) Model: allosteric proteins can exist in two states: R (relaxed) and T (taut) ; R0 T0 In this model, all the subunits in an oligomer must be in the same state (R or T) T-state predominates in the absence of substrate S The substrate and activators bind only to the R-state and inhibitor bind only to T-state
 Model: allosteric proteins can exist in two states: R (relaxed) and T (taut) ; R0 T0. In this model, all the subunits in an oligomer must be in the same state (R or T) T-state predominates in the absence of substrate S. The substrate and activators bind only to the R-state and inhibitor bind only to T-state.")
16
Figure 15.7 Heterotropic allosteric effects: A and I binding to R and T, respectively.

17
S-binding drives the conformation transition, T0 R0
Although the relative [R0] concentration is small, S will bind ‘only’ to R0, forming R1 S binds much tighter to R than to T S-binding drives the conformation transition, T0 R0 Cooperativity is achieved because S binding increases the population of R, which increases the sites available to S K0.5 (Km) : the concentration of ligand giving half-maximal response Ligands such as S are positive homotropic effectors
 : the concentration of ligand giving half-maximal response. Ligands such as S are positive homotropic effectors.")
18
Molecules that influence the binding of something other than themselves are heterotropic effectors
Positive heterotropic effectors or allosteric avtivators (T0 R0) cause a decline in the K0.5 for S negative heterotropic effectors or allosteric inhibitors (R0 T0) raise K0.5 for S The MWC model assumes an equilibrium between conformational states, but ligand binding does not alter the conformation of the protein
 cause a decline in the K0.5 for S. negative heterotropic effectors or allosteric inhibitors (R0 T0) raise K0.5 for S. The MWC model assumes an equilibrium between conformational states, but ligand binding does not alter the conformation of the protein.")
19
The sequential model – proposed by Koshland, Nemethy, and Filmer (the KNF model) relies on the idea that ligand binding triggers a conformation change in a protein If the protein is oligomeric, ligand-induced conformation changes in one subunit may lead to conformation changes in adjacent subunits Ligand-induced conformation changes could cause subunits to shift from a low-affinity state to a high-affinity state The sequential model means subunits undergo sequential changes in conformation due to ligand binding
 relies on the idea that ligand binding triggers a conformation change in a protein. If the protein is oligomeric, ligand-induced conformation changes in one subunit may lead to conformation changes in adjacent subunits. Ligand-induced conformation changes could cause subunits to shift from a low-affinity state to a high-affinity state. The sequential model means subunits undergo sequential changes in conformation due to ligand binding.")
20
Figure 15.8 The KNF sequential model for allosteric behavior.

21
Enzyme activity can be regulated through reversible phosphorylation
15.4 What Kinds of Covalent Modification Regulate the Activity of Enzymes? Enzyme activity can be regulated through reversible phosphorylation This is the most prominent form of covalent modification in cellular regulation Phosphorylation is accomplished by protein kinases Each protein kinase targets specific proteins for phosphorylation Phosphoprotein phosphatases catalyze the reverse reaction – removing phosphoryl groups from proteins Protein kinases and phosphatases work in opposing directions

22
Figure 15.1 Enzyme regulation by reversible covalent modification.

23
Protein kinases: phosphorylate Ser, Thr, and Tyr residues in target proteins (Table 15.2)
")
24
Phosphorylation introduces a bulky group bearing two negative charges, causing conformational changes that alter the target protein’s function In spite of this specificity, all kinases share a common catalytic mechanism based on a conserved core kinase domain of about 260 residues (see Figure 15.9) Protein kinases are classified as Ser/Thr and/or Tyr specific Kinases are often regulated by intrasteric control (see Figure 15.10)
 Protein kinases are classified as Ser/Thr and/or Tyr specific. Kinases are often regulated by intrasteric control (see Figure 15.10)")
25
This complex also includes ATP (red) and two Mn2+ ions (yellow) bound at the active site.
Figure 15.9 Protein kinase A is shown complexes with a pseudosubstrate peptide (orange).
.")
26
Phosphorylation is Not the Only Form of Covalent Modification that Regulates Protein Function
Several hundred different chemical modifications of proteins have been discovered Only a few of these are used to achieve metabolic regulation through reversible conversion of an enzyme between active and inactive forms A few are summarized in Table 15.3 Three of the modifications in Table 15.3 require nucleoside triphosphates (ATP, UTP) that are related to cellular energy status
 that are related to cellular energy status.")
27
Figure 25.16 Covalent modification of GS

28
Phosphorylation Adenylylation ADP-ribosylation

29
15.5 Is the Activity of Some Enzymes Controlled by Both Allosteric Regulation and Covalent Modification? Glycogen phosphorylase (GP) Regulated both by allosteric regulation and by covalent modification Catalyzes the release of glucose units from glycogen A phosphorolysis reaction (Figure 15.11) produces glucose-1-phosphate which is converted to glucose-6-P In muscle, glucose-6-P proceeds into glycolysis, providing needed energy for muscle contraction In the liver, hyrdolysis of glucose-6-P yield glucose, which is exported to other tissues
 Regulated both by allosteric regulation and by covalent modification. Catalyzes the release of glucose units from glycogen. A phosphorolysis reaction (Figure 15.11) produces glucose-1-phosphate which is converted to glucose-6-P. In muscle, glucose-6-P proceeds into glycolysis, providing needed energy for muscle contraction. In the liver, hyrdolysis of glucose-6-P yield glucose, which is exported to other tissues.")
30
Figure 15.11 The glycogen phosphorylase reaction.
Figure The phosphoglucomutase reaction.

31
GP is a homodimer Muscle glycogen phosphorylase is a dimer of two identical subunits (842 residues) Each subunit contains an active site A pyridoxal phosphate cofactor covalently linked (Lys-680) An allosteric effector site near the subunit interface A regulatory phosphorylation site (Ser-14) A glycogen binding site A tower helix (residues 262 to 278)
 An allosteric effector site near the subunit interface. A regulatory phosphorylation site (Ser-14) A glycogen binding site. A tower helix (residues 262 to 278)")
32
GP Activity is Regulated Allosterically
Cooperativity in substrate binding (15.14a) Inorganic phosphate (Pi) is a positive homotropic effector ATP is a feedback inhibitor, and a allosteric inhibitor Glucose-6-P is a negative heterotropic effector (i.e., an allosteric inhibitor) AMP is a positive heterotropic effector (i.e., an allosteric activator)
 Inorganic phosphate (Pi) is a positive homotropic effector. ATP is a feedback inhibitor, and a allosteric inhibitor. Glucose-6-P is a negative heterotropic effector (i.e., an allosteric inhibitor) AMP is a positive heterotropic effector (i.e., an allosteric activator)")
33
Figure 15.14 v versus S curves for glycogen phosphorylase.
The response to the concentration of the substrate phosphate (Pi). ATP is a feedback inhibitor. AMP is a positive effector. It binds at the same site as ATP.
. ATP is a feedback inhibitor. AMP is a positive effector. It binds at the same site as ATP.")
34
AMP and ATP bind to the same site
AMP promotes the conversion to the active state ATP, glucose-6-P, and caffeine favor conversion to the inactive state GP conforms to the MWC model of allosteric transition (T and R conversion) The active form of the enzyme is designated the R state The inactive form of the enzyme is denoted the T state Allosteric controls can be overridden by covalent modiffication of GP
 The active form of the enzyme is designated the R state. The inactive form of the enzyme is denoted the T state. Allosteric controls can be overridden by covalent modiffication of GP.")
35
Figure The mechanism of covalent modification and allosteric regulation of glycogen phosphorylase. The T states are blue and the R states blue-green.

36
Covalent Modification of GP Trumps Allosteric Regulation
In 1956, Edwin Krebs and Edmond Fischer showed that a ‘converting enzyme’ could convert phosphorylase b (inactive) to phosphorylase a (active) Three years later, Krebs and Fischer show that this conversion involves covalent phosphorylation (Figure 15.15)
 to phosphorylase a (active) Three years later, Krebs and Fischer show that this conversion involves covalent phosphorylation (Figure 15.15)")
37
Figure The major conformational change that occurs in the N-terminal residues upon phosphorylation of Ser14. Ser14 is shown in red. N-terminal conformation of unphosphorylated enzyme (phosphorylase b): cyan. N-terminal conformation of phosphorylated enzyme (phosphorylase a): yellow.
: cyan. N-terminal conformation of phosphorylated enzyme (phosphorylase a): yellow.")
38
Enzyme cascades regulate GP Covalent Modification
This phosphorylation of GP is mediated by an enzyme cascade (Figure 15.17) Leads to hormonal stimulation of adenylyl cyclase that converts ATP to cAMP Cyclic AMP is the intracellular agent of extracellular hormones – is known as a second messenger (chap 32)
 Leads to hormonal stimulation of adenylyl cyclase that converts ATP to cAMP. Cyclic AMP is the intracellular agent of extracellular hormones – is known as a second messenger (chap 32)")
39
Figure The hormone-activated enzymatic cascade that leads to activation of glycogen phosphorylase.

40
The hormonal stimulation of adenylyl cyclase is effected by a transmembrane signal pathway
Hormone binding stimulates a GTP-binding protein (G protein; Gabg) G has GTPase activity and binds GDP or GTP Gabg complex has GDP at the nucleotide site When stimulated, GDP dissociates and GTP binds to G G dissociates from Gbg and associates with adenylyl cyclase Binding of G stimulates adenylyl cyclase to make cAMP GTPase activity of G hydrolyzes GTP to GDP, leading to dissociation of G from adenylyl cyclase and reassociation with Gbg to form Gabg cAMP is an essential activator of cAMP-dependent protein kinase (PKA)
 G has GTPase activity and binds GDP or GTP. Gabg complex has GDP at the nucleotide site. When stimulated, GDP dissociates and GTP binds to G G dissociates from Gbg and associates with adenylyl cyclase. Binding of G stimulates adenylyl cyclase to make cAMP. GTPase activity of G hydrolyzes GTP to GDP, leading to dissociation of G from adenylyl cyclase and reassociation with Gbg to form Gabg. cAMP is an essential activator of cAMP-dependent protein kinase (PKA)")
41
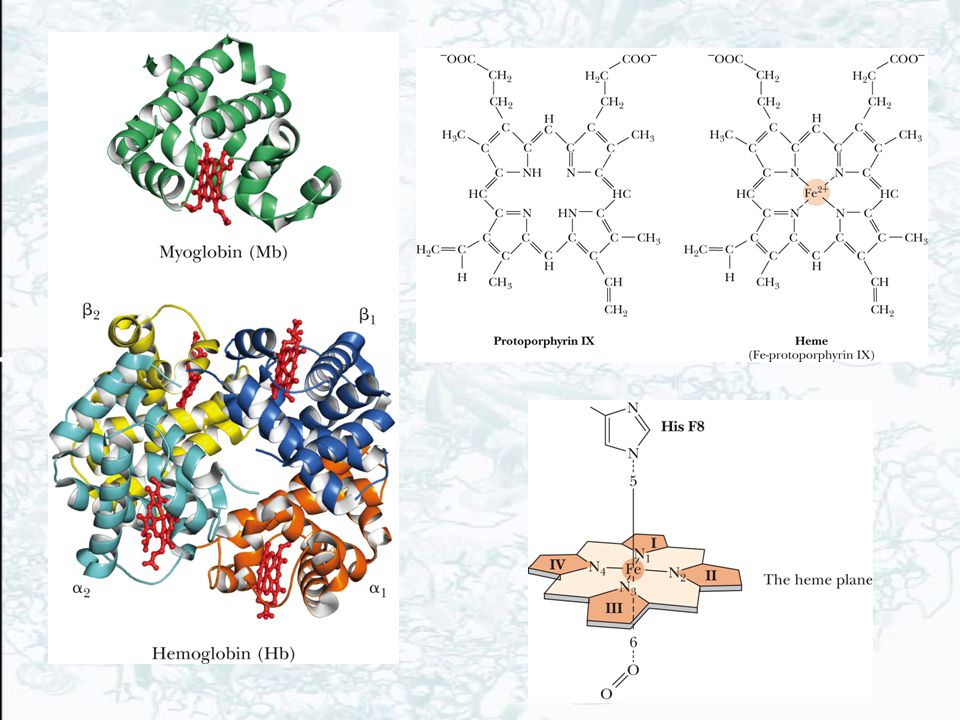
A classic example of allostery
Hemoglobin A classic example of allostery Hemoglobin and myoglobin are oxygen transport and storage proteins Compare the oxygen binding curves for hemoglobin and myoglobin Myoglobin is monomeric; hemoglobin is tetrameric Mb: 153 aa, 17,200 MW Hb: two as of 141 residues, 2 bs of 146 residues

42
Figure 15.20 O2-binding curves for hemoglobin and myoglobin.

44
Hemoglobin Function Hb must bind oxygen in lungs and release it in capillaries
Adjacent subunits' affinity for oxygen increases This is called positive cooperativity

45
Competition between oxygen and H+
The Bohr Effect Competition between oxygen and H+ Discovered by Christian Bohr Binding of protons diminishes oxygen binding Binding of oxygen diminishes proton binding Important physiological significance See Figure 15.33

46
Figure The oxygen saturation curves for myoglobin and for hemoglobin at five different pH values: 7.6, 7.4, 7.2, 7.0, and 6.8.

47
Carbon dioxide diminishes oxygen binding
Bohr Effect II Carbon dioxide diminishes oxygen binding Hydration of CO2 in tissues and extremities leads to proton production These protons are taken up by Hb as oxygen dissociates The reverse occurs in the lungs

48
Figure Oxygen-binding curves of blood and of hemoglobin in the absence and presence of CO2 and BPG. From left to right: stripped Hb, Hb + CO2, Hb + BPG, Hb + BPG + CO2, and whole blood.

49
Fetal hemoglobin has a higher affinity for O2 because it has a lower affinity for BPG

50
Sickle cell anemia

Similar presentations


 Originally isolated from sperm whales 10X abundance greater in aquatic- than terrestrial-mammals Mb knockout.>")


 –Stimulation and inhibition by control proteins –Reversible covalent modification.>")

>")