Download presentation
Presentation is loading. Please wait.

1
Assessing the Nutritional Health of Populations

2
Some Definitions Joint Nutrition Monitoring Evaluation Committee, 1986 Expert Panel on Nutrition Monitoring, 1989

3
Dietary Status The condition of a population’s or an individual’s intake of foods and food components, especially nutrients.

4
Nutrition Assessment Measurement of indicators of dietary status and nutrition related health status to identify the possible occurrence, nature, and extent of impaired nutritional status.

5
Nutrition Monitoring Assessment of dietary or nutrition status at intermittent times with the aim of detecting changes in the dietary or nutritional status of a population

6
Nutrition Surveillance Continuous assessment of nutritional status for the purpose of detecting changes in trend or distribution in order to initiate corrective measures

7
Nutrition Monitoring in the United States

8
Public Health “Revolutions” FocusIntervention Physical Environment Public sanitation, food safety Laws & regulations Individual Behavior Behaviors & Lifestyle Individual behavior change interventions Macro social/economic environments Fundamental determinants of health Social and economic policies

9
Brief Chronology

11
Goals of NNMS Provide foundations for improvement of nutritional status and quality and healthfulness of food supply Collect, analyze, and disseminate timely data on nutrition and dietary status, quality of food supply, food consumption patterns, consumer knowledge and attitudes

12
NNMS Goals, cont... ID high risk groups and geographic areas and trends Establish national baseline data and develop standards for monitoring Provide data for evaluating implications of changes in agricultural policy

13
NNMS - Some Agencies USDA –Food and Nutrition Service –Food Safety and Inspection Service –Agricultural Research Service –Economic Research Service –Extension Service –Cooperative State Research Service

14
Department of Health and Human Services –National Center for Health Statistics –CDC-National Center for Chronic Disease Prevention and Health Promotion –Food and Drug Administration –Heath Resources and Services Administration –Indian Health Services –National Institutes of Health –Substance Abuse and Mental Health Services Administration

15
Others: –Department of Defense –Department of Education –Agency for International Development –Department of Veterans Affairs –Census Bureau –Bureau of Labor Statistics –National Marine Fisheries Service

16
Nutrition and Related Health Measurements National Health and Nutrition Examination Surveys (I-V, and continuous) National Health Interview Survey National Hospital Discharge Survey Pediatric Nutrition Surveillance System
 National Health Interview Survey National Hospital Discharge Survey Pediatric Nutrition Surveillance System")
17
Food and Nutrient Composition Nationwide Food Consumption Survey Continuing Survey of Food Intakes by Individuals – now integrated into What We Eat in America

18
Knowledge, Attitudes, and Behavior Behavioral Risk Factor Surveillance System Youth Risk Behavior Survey Diet and Health Knowledge Survey

19
Food Composition and Nutrient Data Bases National Nutrient Data Bank (NNDB)
")
20
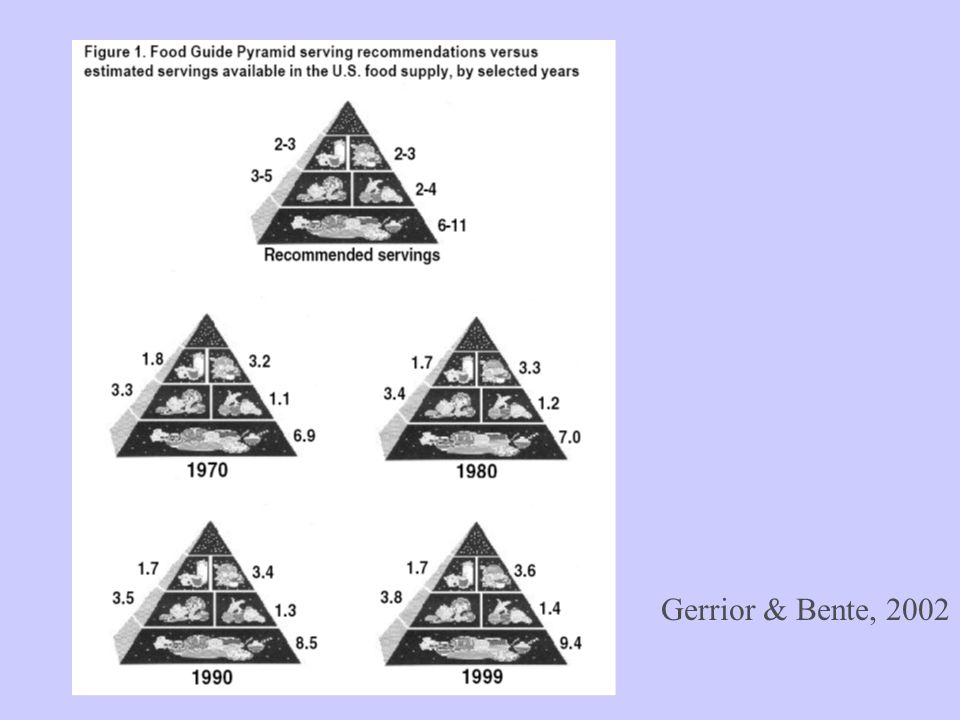
Food Supply Determinations US Food and Nutrition Supply Series –Interactive web site for nutrient content of the US food supply from 1909 to 2006: http://65.216.150.146/ –Gerrior & Bente. Dietary Guidance, 1970 to 1999: Does the U.S. Food Supply Support It? Family Economics and Nutrition Review. 2002

21
Gerrior & Bente, 2002

23
Federal Assessment of Policies and Practices AgencyYears School Health Policies and Programs Study CDC, Division of Adolescent and School Health 1994, 2000, 2006 Survey of Maternity Practices in Infant Nutrition and Care (mPINC) CDC, Division of Nutrition, Physical Activity and Obesity 2007 Nutrition, Physical Activity and Obesity Legislative Database CDC, Division of Nutrition, Physical Activity and Obesity Annual since 2001
 CDC, Division of Nutrition, Physical Activity and Obesity 2007 Nutrition, Physical Activity and Obesity Legislative Database CDC, Division of Nutrition, Physical Activity and Obesity Annual since 2001")
24
Major Public Health Surveys with Nutrition Content

25
Behavioral Risk Factor Surveillance System (BRFSS) CDC, National Center for Chronic Disease Prevention and Health Promotion (NCCDPHP) Annually since 1984 (not all states at first) Telephone interview Data collection is conducted separately by each State. Sample design uses State-level, random-digit- dialed probability samples of the adult (aged 18 years and over) population. State-specific sample sizes ranged from 1,499 to 6,005
 population. State-specific sample sizes ranged from 1,499 to 6,005.")
26
BRFSS - Questions Behavioral risk factors (for example, alcohol and tobacco use), preventive health measures, HIV/AIDS, health status, limitation of activity, and health care access and utilization Core of questions asked in all States Standardized optional questions on selected topics administered at the State’s discretion Rotating core of questions asked every other year in all States State-added questions developed to address State- specific needs
, preventive health measures, HIV/AIDS, health status, limitation of activity, and health care access and utilization Core of questions asked in all States Standardized optional questions on selected topics administered at the State’s discretion Rotating core of questions asked every other year in all States State-added questions developed to address State- specific needs")
27
BRFSS - Data National State Smaller units when local agencies pay for additional surveys Data system homepage: http://www.cdc.gov/brfss/

28
BRFSS - Nutrition Self reported height and weight Trying to loose weight? 6 fruit and vegetable intake questions Activity Food security

29
BRFSS 2008 – percentage of respondents reporting BMI < 24.9

32
The Youth Risk Behavior Surveillance System (YRBSS) National, State, and Local Data
 National, State, and Local Data")
33
Purposes of the YRBSS Focus the nation on behaviors among youth causing the most important health problems Assess how risk behaviors change over time Provide comparable data

34
Behaviors That Contribute to the Leading Causes of Morbidity and Mortality Behaviors that contribute to unintentional injuries and violence Tobacco use Alcohol and other drug use Sexual behaviors Unhealthy dietary behaviors Inadequate physical activity

35
Characteristics of the National, State, and Local School-Based YRBS 2007 sample was 14,041, 9 th – 12th grade students 2007 response rates –School = 81% –Student = 84% –Overall 68% Anonymous, computer-scannable questionnaire or answer sheet Completed in one class period (45 minutes) Conducted biennially usually during the spring
 Conducted biennially usually during the spring")
36
Policy and Program Applications Describe risk behaviors Create awareness Set program goals Develop programs and policies Support health-related legislation Seek funding

37
YRBS - Nutrition Self reported weight and height Dieting behaviors Eating disorder behaviors Fruit and vegetable intake Fat intake

38
Percentage of High School Students Who Ate Fruits and Vegetables Five or More Times/Day,* by Sex** and Race/Ethnicity,*** 2007 * 100% fruit juices, fruit, green salad, potatoes (excluding French fries, fried potatoes, or potato chips), carrots, or other vegetables during the 7 days before the survey. ** M > F *** B, H > W National Youth Risk Behavior Survey, 2007

39
Percentage of High School Students Who Ate Fruits and Vegetables Five or More Times/Day,* 1999 – 2007 National Youth Risk Behavior Surveys, 1999 – 2007 * 100% fruit juices, fruit, green salad, potatoes (excluding French fries, fried potatoes, or potato chips), carrots, or other vegetables during the 7 days before the survey. 1 Decreased 1999-2007, p <.05

40
Percentage of High School Students Who Drank Three or More Glasses/Day of Milk,* by Sex** and Race/Ethnicity,*** 2007 * During the 7 days before the survey. ** M > F *** W > H > B National Youth Risk Behavior Survey, 2007

41
Percentage of High School Students Who Drank Three or More Glasses/Day of Milk,* 1999 – 2007 National Youth Risk Behavior Surveys, 1999 – 2007 * During the 7 days before the survey. 1 Decreased 1999-2007, p <.05

42
Percentage of High School Students Who Drank a Can, Bottle, or Glass of Soda or Pop at Least One Time/Day,* by Sex** and Race/Ethnicity,*** 2007 * Not including diet soda or diet pop, during the 7 days before the survey. ** M > F *** B > H National Youth Risk Behavior Survey, 2007

43
Percentage of High School Students Who Did Not Eat for 24 or More Hours to Lose Weight or to Keep From Gaining Weight,* by Sex** and Race/Ethnicity,*** 2007 * During the 30 days before the survey. ** F > M *** H > W, B National Youth Risk Behavior Survey, 2007

44
Percentage of High School Students Who Vomited or Took Laxatives to Lose Weight or to Keep From Gaining Weight,* by Sex** and Race/Ethnicity,*** 2007 * During the 30 days before the survey. ** F > M *** H > B National Youth Risk Behavior Survey, 2007

45
Percentage of High School Students Who Vomited or Took Laxatives to Lose Weight or to Keep From Gaining Weight,* 1995 – 2007 National Youth Risk Behavior Surveys, 1995 – 2007 * During the 30 days before the survey. 1 No change 1995-2003, decreased 2003-2007, p <.05

46
Rising Rates of Childhood Overweight in Lewis County

47
Continuing Survey of Food Intake by Individuals (CSFII) USDA 1994-1996 in-person interviews 24-hour dietary recall: 2 nonconsecutive days of food intake data collected 3-10 days apart 2 weeks later, one adult from each household asked questions about knowledge and attitudes toward dietary guidance, health, and use of food labels.
 USDA in-person interviews 24-hour dietary recall: 2 nonconsecutive days of food intake data collected 3-10 days apart 2 weeks later, one adult from each household asked questions about knowledge and attitudes toward dietary guidance, health, and use of food labels.")
48
CFSII - Sample Nationally representative stratified multistage area probability sample of U.S. noninstitutionalized civilian population, all ages. Oversampling of low-income households For 1994–96, sample size for 1-day dietary data was 16,103; for 2-day dietary data, it was 15,303.

49
CFSII - Data kinds and amounts of foods consumed sources of foods time, name of each eating occasion food expenditures, shopping practices pregnancy, lactation, nursing status, height and weight income, poverty status, household size, participation in Food Stamp and WIC programs

50
CFSII - Data Availability National; four U.S. Census Bureau regions; Standard Metropolitan Statistical Areas http://www.barc.usda.gov/bhnrc/foodsurvey/home.htm

51
CFSII - Nutrition food intakes in grams of 71 USDA-defined food groups and subgroups nutrient intakes of 28 nutrients and food components nutrient intakes expressed as percentages of the 1989 Recommended Dietary Allowance Pyramid servings from 30 food groups

52
Trends in Beverage Consumption – Youth aged 11-18 years

53
Consumption of cereals, added sugars and fats has gone up (lb per capita) Source: ERS/USDA FoodReview 2002 Note that the major increases was in the cereals category
 Source: ERS/USDA FoodReview 2002 Note that the major increases was in the cereals category")
54
Corn sweeteners have overtaken cane and beet sugar (lb per capita) Source: ERS/USDA FoodReview 2002 Sucrose = 50% fructose; 50% glucose; HFCS = 55% fructose; 45% glucose
 Source: ERS/USDA FoodReview 2002 Sucrose = 50% fructose; 50% glucose; HFCS = 55% fructose; 45% glucose")
55
Less red meat, fewer eggs, and more poultry and fish (lb per capita, edible weight) Source: ERS/USDA FoodReview 2002
 Source: ERS/USDA FoodReview 2002")
56
Oranges, apples, and bananas account for 50% of all fruit servings (lb per capita) Source: ERS/USDA FoodReview 2002
 Source: ERS/USDA FoodReview 2002")
57
Iceberg lettuce, frozen potatoes, and potato chips account for 33% of vegetable servings (lb per capita) Starchy vegetables: corn, carrots, peas, sweet potatoes, beans Fresh vegetables: tomatoes, onions, cucumbers, peppers, cabbage, celery Dark green leafy: Leaf lettuce, broccoli, spinach, squash Source: ERS/USDA FoodReview 2002
 Starchy vegetables: corn, carrots, peas, sweet potatoes, beans Fresh vegetables: tomatoes, onions, cucumbers, peppers, cabbage, celery Dark green leafy: Leaf lettuce, broccoli, spinach, squash Source: ERS/USDA FoodReview 2002")
58
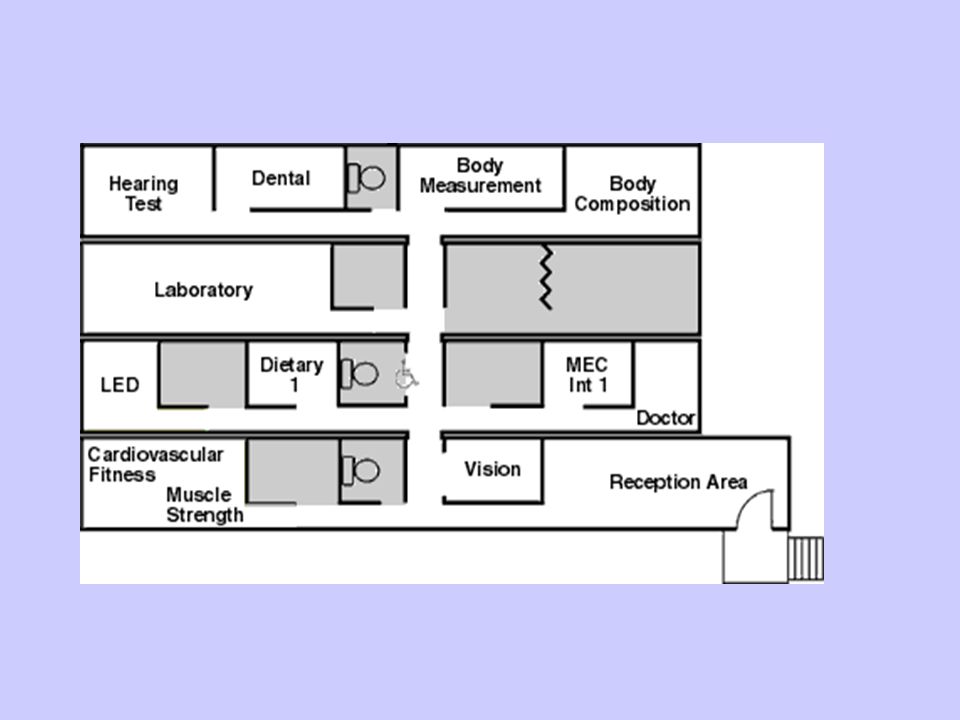
National Health and Nutrition Examination Survey (NHANES) CDC, National Center for Health Statistics (NCHS) In-person interview in household and mobile examination center stratified multistage probability sample, nationally representative of the U.S. civilian noninstitutionalized population Approximately 5,000 people are examined at 15 locations each year All ages beginning in 1999

59
NHANES - Continuous Periodic (1960–94); annual beginning in 1999 after 1999 annual sample size too small to provide reliable estimates for many measures and for most subgroups. Most analyses require 3 years of data for reliable estimates.

62
NHANES - Content Chronic disease prevalence and conditions (including undiagnosed conditions immunization status infectious disease prevalence health insurance measures of environmental exposures hearing vision mental health

63
NHANES - Content anemia diabetes cardiovascular disease osteoporosis obesity oral health physical fitness

64
NHANES - Data National; four U.S. Census Bureau regions Demographics: Gender, age, education, race/ethnicity, place of birth, income, occupation, and industry http://www.cdc.gov/nchs/nhanes.htm

65
NHANES - Nutrition Food Security Dietary supplements Weight history Dietary Recall - one 24 hour

66
NHANES III Anthropometric Procedures Video Body weight Standing height Sitting height Upper leg length Recumbent length Upper arm length Knee height Arm circumference Waist circumference Buttocks circumference Thigh circumference Head circumference Skinfolds (including thighs, triceps, subscapular, and suprailiac) Wrist breadth Elbow breadth
 Wrist breadth Elbow breadth")
68
WHAT WE EAT IN AMERICA: NHANES-CFSII Integration Staged integration of the two surveys 2001 a year of testing, 2002 full integration Goals: continuous data collection, linkage of diet and health data, 2 days of dietary data collection (second day by phone 3 to 10 days after initial exam) DHKS not part of integrated efforts at this time, but under consideration
 DHKS not part of integrated efforts at this time, but under consideration")
69
What We Eat in America Food intake data can be linked to health status data from other NHANES components HHS is responsible for the sample design and data and USDA is responsible for the survey’s dietary data collection methodology, maintenance of the database used to code and process the data, and data review and processing

71
History of the Food Security Measurement Project 1990NMRR Act recommends a standardized mechanism for defining and obtaining data on the prevalence of food insecurity 1992USDA staff review existing research 1994USDA and DHHS sponsor conference on Food Security Measurement and Research 1995Current Population Survey of US Census Bureau includes Food Security Measurement scale 1996- present Annual Surveys, ERS assumes leadership, others encouraged to use FSMS 2006Release of IOM report, “Food Insecurity and Hunger in the United States: An Assessment of the Measure.”

72
Sample of Other Population Surveillance Systems with Nutrition Components Breastfeeding: National Immunization Survey Growth in Low Income Children: Pediatric Nutrition Surveillance System Pregnancy Risk Assessment Monitoring System

Similar presentations


 strives to create innovative partnerships that empower low-income Californians to increase.>")


