Download presentation
Presentation is loading. Please wait.

1
Measuring Adversaries Vern Paxson International Computer Science Institute / Lawrence Berkeley National Laboratory vern@icir.org June 15, 2004

2
Data courtesy of Rick Adams = 80% growth/year

3
= 60% growth/year

4
= 596% growth/year

5
The Point of the Talk Measuring adversaries is fun: –Increasingly of pressing interest –Involves misbehavior and sneakiness –Includes true Internet-scale phenomena –Under-characterized –The rules change

6
The Point of the Talk, con’t Measuring adversaries is challenging: –Spans very wide range of layers, semantics, scope –New notions of “active” and “passive” measurement –Extra-thorny dataset problems –Very rapid evolution: arms race

7
Adversaries & Evasion Consider passive measurement: scanning traffic for a particular string (“USER root”) Easiest: scan for the text in each packet –No good: text might be split across multiple packets Okay, remember text from previous packet –No good: out-of-order delivery Okay, fully reassemble byte stream –Costs state …. –…. and still evadable

8
Evading Detection Via Ambiguous TCP Retransmission

9
The Problem of Evasion Fundamental problem passively measuring traffic on a link: Network traffic is inherently ambiguous Generally not a significant issue for traffic characterization … … But is in the presence of an adversary: Attackers can craft traffic to confuse/fool monitor

10
The Problem of “Crud” There are many such ambiguities attackers can leverage A type of measurement vantage-point problem Unfortunately, these occur in benign traffic, too : –Legitimate tiny fragments, overlapping fragments –Receivers that acknowledge data they did not receive –Senders that retransmit different data than originally In a diverse traffic stream, you will see these: –What is the intent?

11
Countering Evasion-by-Ambiguity Involve end-host: have it tell you what it saw Probe end-host in advance to resolve vantage-point ambiguities (“active mapping”) –E.g., how many hops to it? –E.g., how does it resolve ambiguous retransmisions? Change the rules - Perturb –Introduce a network element that “normalizes” the traffic passing through it to eliminate ambiguities E.g., regenerate low TTLs (dicey!) E.g., reassemble streams & remove inconsistent retransmissions
 E.g., reassemble streams & remove inconsistent retransmissions.")
12
Adversaries & Identity Usual notions of identifying services by port numbers and users by IP addresses become untrustworthy E.g., backdoors installed by attackers on non- standard ports to facilitate return / control E.g., P2P traffic tunneled over HTTP General measurement problem: inferring structure

13
Adversaries & Identity: Measuring Packet Origins Muscular approach (Burch/Cheswick) –Recursively pound upstream routers to see which ones perturb flooding stream Breadcrumb approach: –ICMP ISAWTHIS Relies on high volume –Packet marking Lower volume + intensive post-processing Yaar’s PI scheme yields general tomography utility Yields general technique: power of introducing small amount of state inside the network
 –Recursively pound upstream routers to see which ones perturb flooding stream Breadcrumb approach: –ICMP ISAWTHIS Relies on high volume –Packet marking Lower volume + intensive post-processing Yaar’s PI scheme yields general tomography utility Yields general technique: power of introducing small amount of state inside the network")
14
Adversaries & Identity: Measuring User Origins Internet attacks invariably do not come from the attacker's own personal machine, but from a stepping-stone: a previously- compromised intermediary. Furthermore, via a chain of stepping stones. Manually tracing attacker back across the chain is virtually impossible. So: want to detect that a connection going into a site is closely related to one going out of the site. Active techniques? Passive techniques?

15
Measuring User Origins, con’t Approach #1 (SH94; passive): Look for similar text –For each connection, generate a 24-byte thumbprint summarizing per-minute character frequencies Approach #2 (USAF94) - particularly vigorous active measurement: –Break-in to upstream attack site –Rummage through its logs –Recurse
: Look for similar text –For each connection, generate a 24-byte thumbprint summarizing per-minute character frequencies Approach #2 (USAF94) - particularly vigorous active measurement: –Break-in to upstream attack site –Rummage through its logs –Recurse")
16
Measuring User Origins, con’t Approach #3 (ZP00; passive): Leverage unique on/off pattern of user login sessions: –Look for connections that end idle periods at the same time. –Two idle periods correlated if ending time differ by ≤ sec. –If enough periods coincide stepping stone pair. –For A B C stepping stone, just 2 correlations suffices –(For A B … C D, 4 suffices.)
.")
17
Measuring User Origins, con’t Works very well, even for encrypted traffic But: easy to evade, if attacker cognizant of algorithm –C’est la arms race And: also turns out there are frequent legit stepping stones Untried active approach: imprint traffic with low-frequency timing signature unique to each site (“breadcrumb”). Deconvolve recorded traffic to extract.

18
Global-scale Adversaries: Worms Worm = Self-replicating/self-propagating code Spreads across a network by exploiting flaws in open services, or fooling humans (viruses) Not new --- Morris Worm, Nov. 1988 –6-10% of all Internet hosts infected Many more small ones since … … but came into its own July, 2001

19
Code Red Initial version released July 13, 2001. Exploited known bug in Microsoft IIS Web servers. 1 st through 20 th of each month: spread. 20 th through end of each month: attack. Spread: via random scanning of 32-bit IP address space. But: failure to seed random number generator linear growth reverse engineering enables forensics

20
Code Red, con’t Revision released July 19, 2001. Payload: flooding attack on www.whitehouse.gov. Bug lead to it dying for date ≥ 20 th of the month. But: this time random number generator correctly seeded. Bingo!

21
Worm dies on July 20th, GMT

22
Measuring Internet-Scale Activity: Network Telescopes Idea: monitor a cross-section of Internet address space to measure network traffic involving wide range of addresses –“Backscatter” from DOS floods –Attackers probing blindly –Random scanning from worms LBNL’s cross-section: 1/32,768 of Internet –Small enough for appreciable telescope lag UCSD, UWisc’s cross-section: 1/256.

23
Spread of Code Red Network telescopes give lower bound on # infected hosts: 360K. Course of infection fits classic logistic. That night ( 20 th ), worm dies … … except for hosts with inaccurate clocks! It just takes one of these to restart the worm on August 1 st …
, worm dies … … except for hosts with inaccurate clocks. It just takes one of these to restart the worm on August 1 st ….")
24
Could parasitically analyze sample of 100K’s of clocks!

25
The Worms Keep Coming Code Red 2: –August 4th, 2001 –Localized scanning: prefers nearby addresses –Payload: root backdoor –Programmed to die Oct 1, 2001. Nimda: –September 18, 2001 –Multi-mode spreading, including via Code Red 2 backdoors!

26
Code Red 2 kills off Code Red 1 Code Red 2 settles into weekly pattern Nimda enters the ecosystem Code Red 2 dies off as programmed CR 1 returns thanks to bad clocks

27
Code Red 2 dies off as programmed Nimda hums along, slowly cleaned up With its predator gone, Code Red 1 comes back!, still exhibiting monthly pattern

28
80% of Code Red 2 cleaned up due to onset of Blaster Code Red 2 re- released with Oct. 2003 die-off Code Red 1 and Nimda endemic Code Red 2 re-re- released Jan 2004 Code Red 2 dies off again

29
Detecting Internet-Scale Activity Telescopes can measure activity, but what does it mean?? Need to respond to traffic to ferret out intent Honeyfarm: a set of “honeypots” fed by a network telescope Active measurement w/ an uncooperating (but stupid) remote endpoint
 remote endpoint.")
30
Internet-Scale Adversary Measurement via Honeyfarms Spectrum of response ranging from simple/cheap auto-SYN acking to faking higher levels to truly executing higher levels Problem #1: Bait –Easy for random-scanning worms, “auto-rooters” –But for “topological” or “contagion” worms, need to seed honeyfarm into application network Huge challenge Problem #2: Background radiation –Contemporary Internet traffic rife with endemic malice. How to ignore it??

31
Measuring Internet Background Radiation -- 2004 For good-sized telescope, must filter: –E.g., UWisc /8 telescope sees 30Kpps of traffic heading to non-existing addresses Would like to filter by intent, but initially don’t know enough Schemes - per source: –Take first N connections –Take first N connections to K different ports –Take first N different payloads –Take all traffic source sends to first N destinations

32
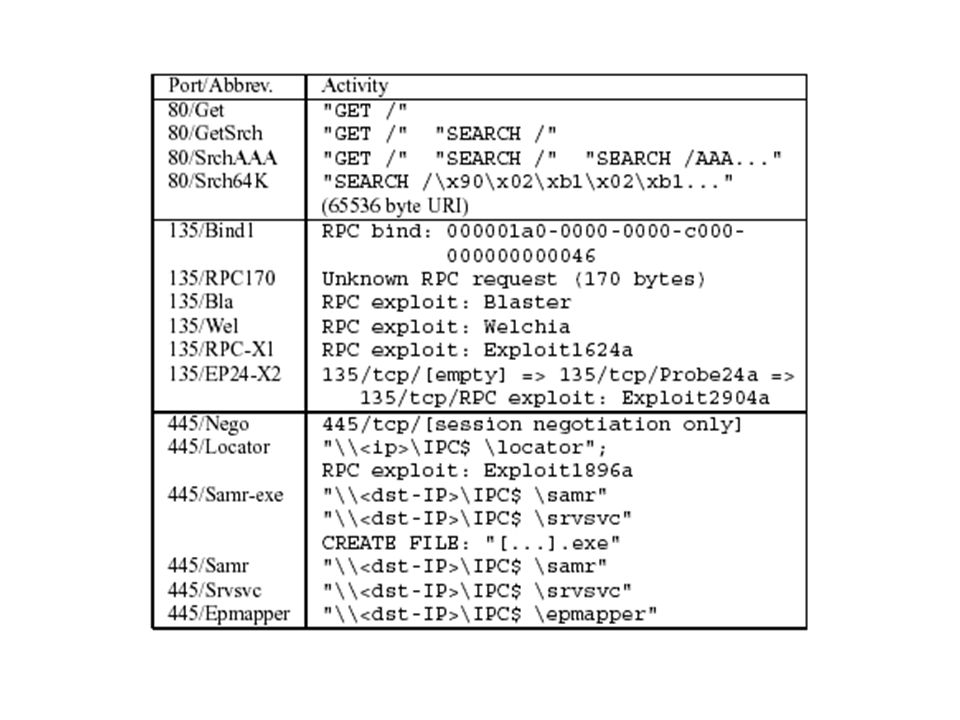
Responding to Background Radiation

33
Hourly Background Radiation Seen at a 2,560-address Telescope

35
Measuring Internet-scale Adversaries: Summary New tools & forms of measurement: –Telescopes, honeypots, filtering New needs to automate measurement: –Worm defense must be faster-than-human The lay of the land has changed: –Endemic worms, malicious scanning –Majority of Internet connection (attempts) are hostile (80+% at LBNL) Increasing requirement for application- level analysis
 are hostile (80+% at LBNL) Increasing requirement for application- level analysis")
36
The Huge Dataset Headache Adversary measurement particularly requires packet contents –Much analysis is application-layer Huge privacy/legal/policy/commercial hurdles Major challenge: anonymization/agents technologies –E.g. [PP03] “semantic trace transformation” –Use intrusion detection system’s application analyzers to anonymize trace at semantic level (e.g., filenames vs. users vs. commands) –Note: general measurement increasingly benefits from such application analyzers, too
 –Note: general measurement increasingly benefits from such application analyzers, too.")
37
Attacks on Passive Monitoring State-flooding : –E.g. if tracking connections, each new SYN requires state; each undelivered TCP segment requires state Analysis flooding: –E.g. stick, snot, trichinosis But surely just peering at the adversary we’re ourselves safe from direct attack?

38
Attacks on Passive Monitoring Exploits for bugs in passive analyzers! Suppose protocol analyzer has an error parsing unusual type of packet –E.g., tcpdump and malformed options Adversary crafts such a packet, overruns buffer, causes analyzer to execute arbitrary code E.g. Witty, BlackIce & packets sprayed to random UDP ports –12,000 infectees in < 60 minutes!

39
Summary The lay of the land has changed –Ecosystem of endemic hostility –“Traffic characterization” of adversaries as ripe as characterizing regular Internet traffic was 10 years ago –People care Very challenging: –Arms race –Heavy on application analysis –Major dataset difficulties

40
Summary, con’t Revisit “passive” measurement: –evasion –telescopes/Internet scope –no longer isolated observer, but vulnerable Revisit “active” measurement –perturbing traffic to unmask hiding & evasion –engaging attacker to discover intent IMHO, this is "where the action is” … … And the fun!

Similar presentations
 Denial of Service Nick Feamster CS 4251 Spring 2008.>")

 June 2006.>")


 Paul Barford(Univ. Wisconsin) Balachander Krishnamurthy(AT&T Labs - Research)>")


 Sireesha Dasaraju CS526 - Advanced Internet Systems UCCS.>")


